Sea ice extent for February 2020 tracked below average, ranking as the thirteenth lowest monthly average in the satellite record. A brief pause in ice growth in the middle of February was related to the regional wind pattern. As has been the case for the past several months, the Arctic Oscillation was in a persistently positive phase. This manifested as unusually low sea level pressure over the Atlantic side of the Arctic Ocean and high pressure over Eastern Eurasia, extending eastward into Arctic Canada.
Overview of conditions
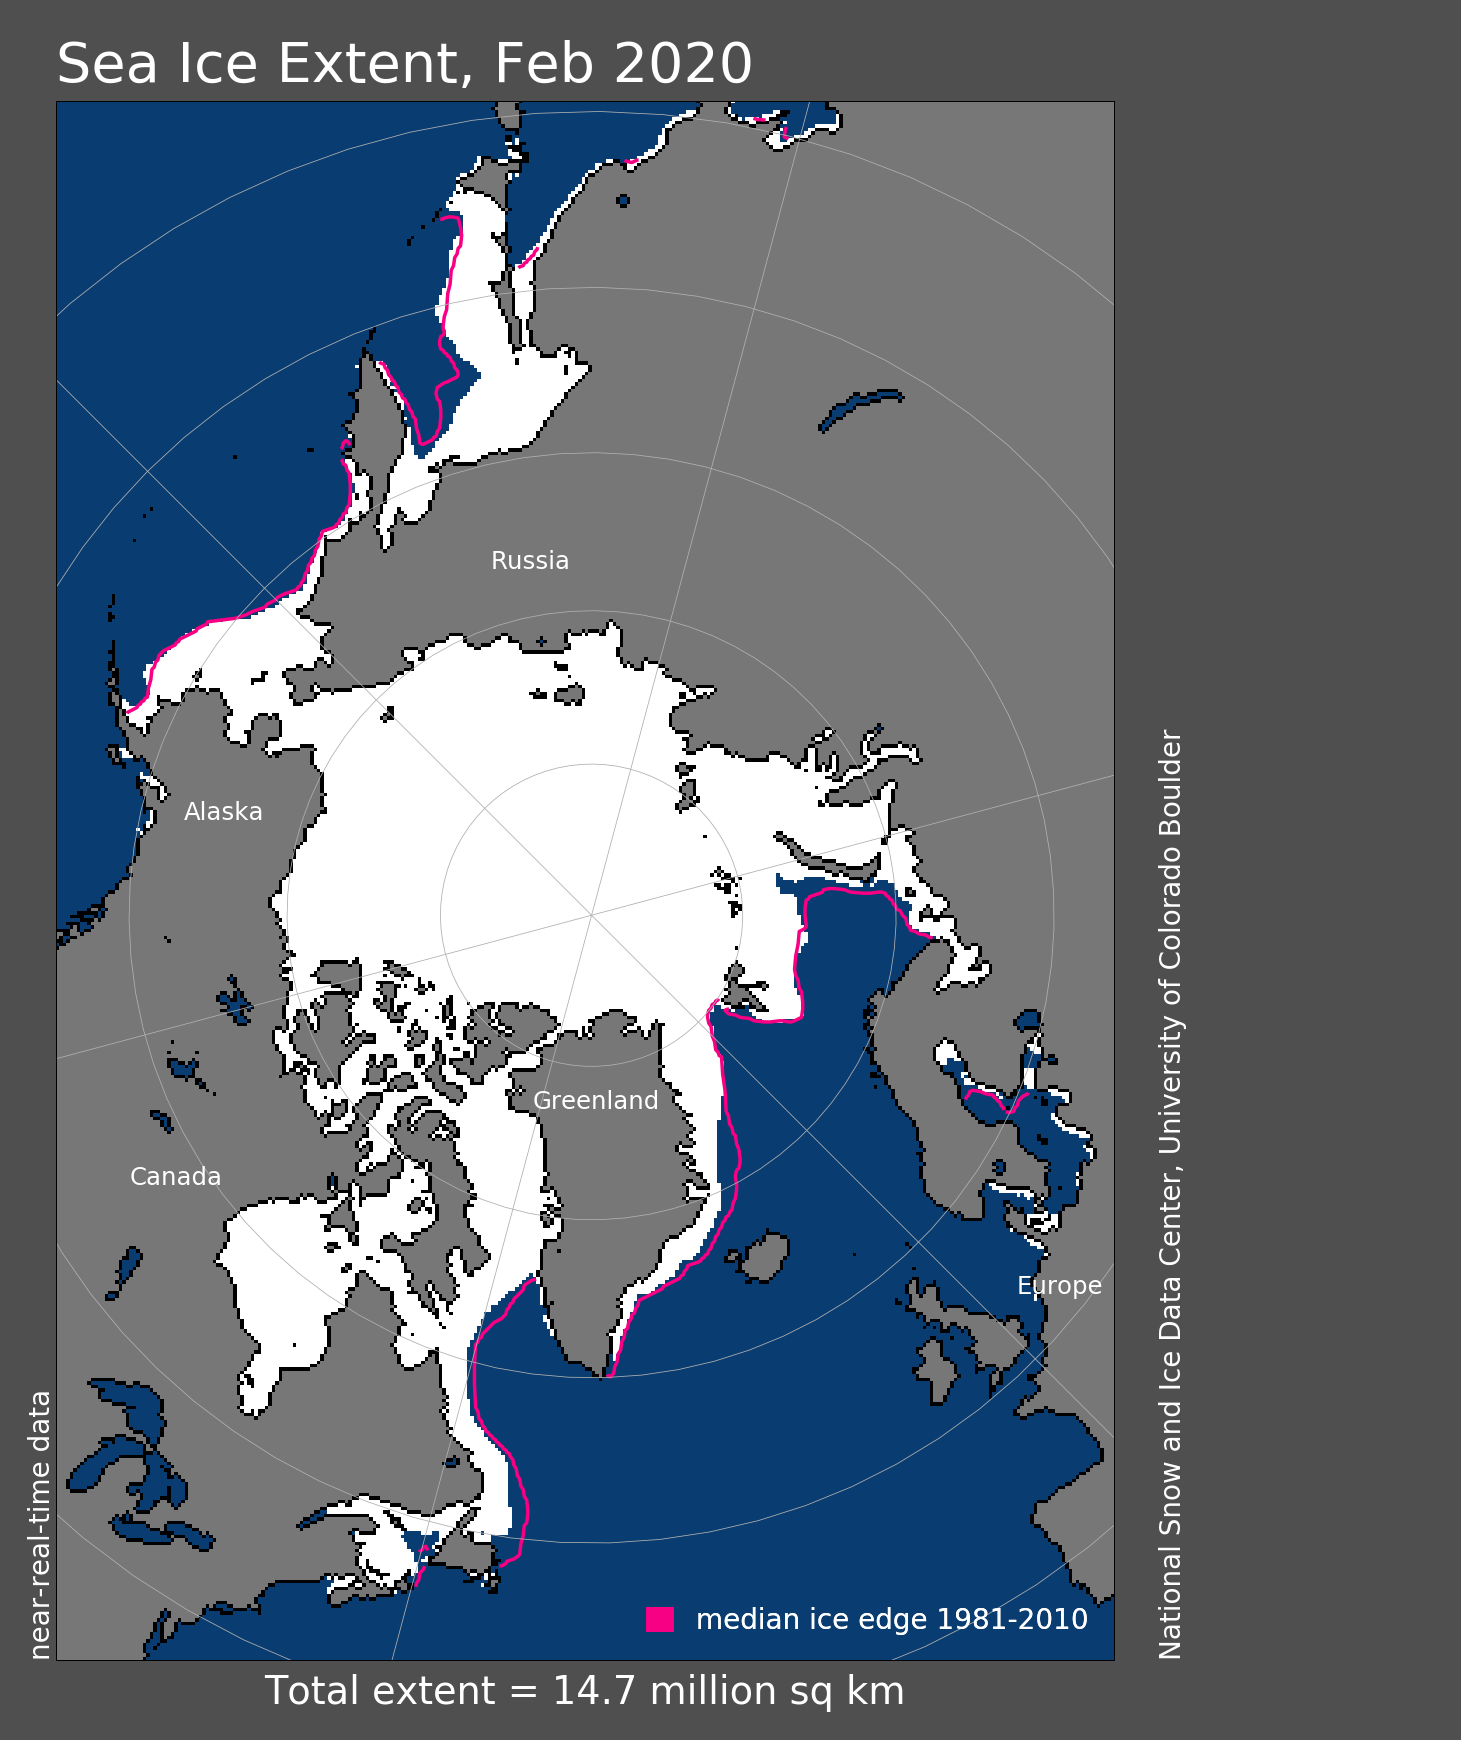
Figure 1. Arctic sea ice extent for February 2020 was 14.68 million square kilometers (5.67 million square miles). The magenta line shows the 1981 to 2010 average extent for that month. Sea Ice Index data. About the data
Credit: National Snow and Ice Data Center
High-resolution image
Arctic sea ice extent for February 2020 was 14.68 million square kilometers (5.67 million square miles), the thirteenth lowest in the satellite record. This was 620,000 square kilometers (239,000 square miles) below the 1981 to 2010 February average and 710,000 square kilometers (274,000 square miles) above the record low mark for February set in 2018. At the end of February, ice extent was below average over parts of the Barents and Kara Seas, and the eastern Greenland Sea.
Conditions in context
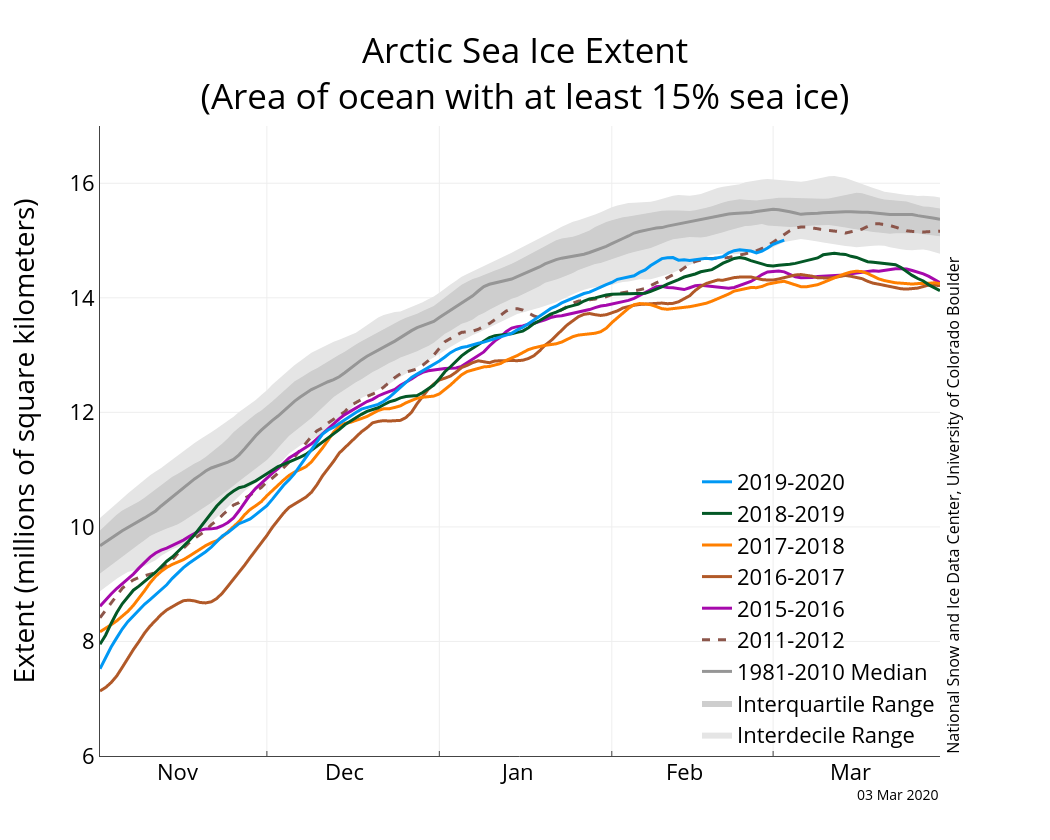
Figure 2a. The graph above shows Arctic sea ice extent as of March 3, 2020, along with daily ice extent data for four previous years and the record low year. 2019 to 2020 is shown in blue, 2018 to 2019 in green, 2017 to 2018 in orange, 2016 to 2017 in brown, 2015 to 2016 in purple, and 2011 to 2012 in dashed brown. The 1981 to 2010 median is in dark gray. The gray areas around the median line show the interquartile and interdecile ranges of the data. Sea Ice Index data.
Credit: National Snow and Ice Data Center
High-resolution image
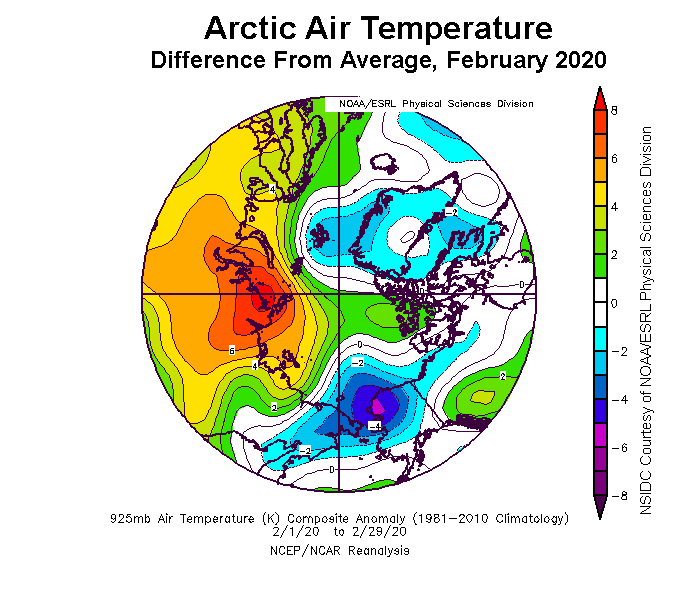
Figure 2b. This plot shows the departure from average air temperature in the Arctic at the 925 hPa level, in degrees Celsius, for February 2020. Yellows and reds indicate higher than average temperatures; blues and purples indicate lower than average temperatures.
Credit: NSIDC courtesy NOAA Earth System Research Laboratory Physical Sciences Division
High-resolution image
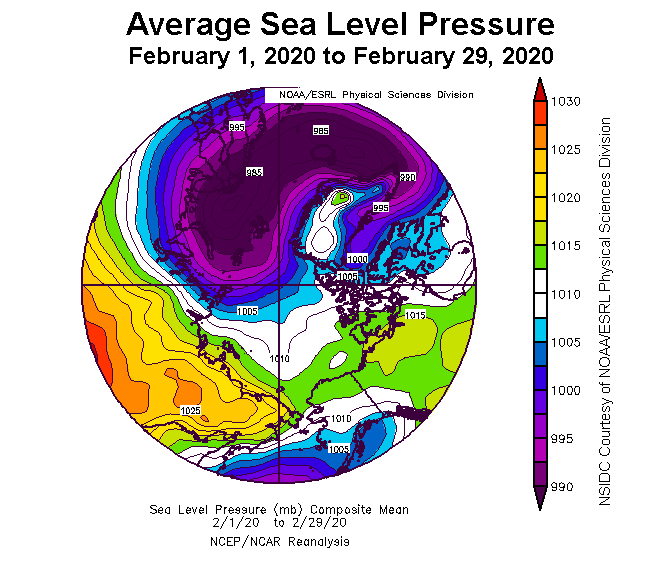
Figure 2c. This plot shows average sea level pressure in the Arctic in millibars (hPa) for February 2020. Yellows and reds indicate high air pressure; blues and purples indicate low pressure.
Credit: NSIDC courtesy NOAA Earth System Research Laboratory Physical Sciences Division
High-resolution image
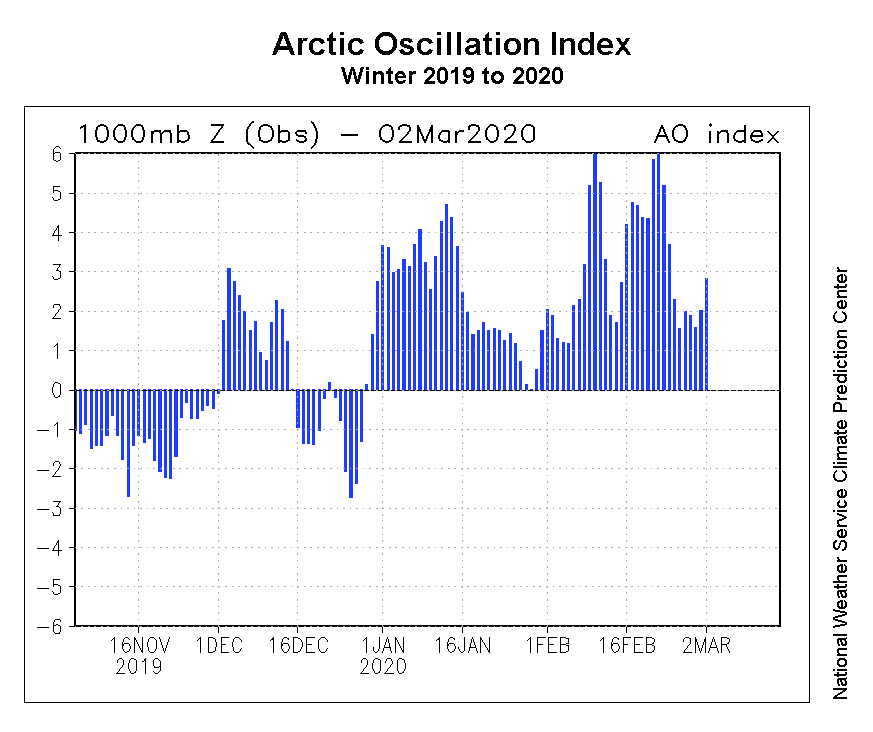
Figure 2d. Over the past several months, the Arctic Oscillation has been in a persistently positive phase. This manifested as unusually low sea level pressure over the Atlantic side of the Arctic Ocean and high pressure over Eastern Eurasia, extending eastward into Arctic Canada. This figure shows the Observed Arctic Oscillation Index from November 2019 through March 1, 2020. Credit: National Weather Service Climate Prediction Center
High-resolution image
Through the month, sea ice grew by an average of 22,100 square kilometers (8,500 square miles) per day, fairly close to the average rate over the 1981 to 2010 period of 20,200 square kilometers (7,800 square miles) per day.
Air temperatures at the 925 hPa level (about 2,500 feet above the surface, Figure 2b) were from 1 to 7 degrees Celsius (2 to 13 degrees Fahrenheit) above average across much of the Eurasian side of the Arctic Ocean, with especially large departures from average around the Taymyr Peninsula (Figure 2b). At the same time, northern Alaska and the Chukchi and Beaufort Seas saw temperatures by up to 6 degrees Celsius (11 degrees Fahrenheit) below average.
The sea level pressure pattern average for February was similar to that of January, with low pressure areas extending from the northern North Atlantic into the Kara Sea, paired with high pressure over eastern Eurasia and extending across Alaska and into northern Canada (Figure 2c). Pressures over the Barents and Kara Seas were as much as 18 hPa below the 1981 to 2010 average. This pattern was associated with a positive phase of the Arctic Oscillation (AO), continuing the basic AO pattern that has persisted since December. A very high positive AO index (4 to 6) marked portions of February, which has been associated with warm air and stormy weather from Northern Europe into the Barents Sea. This likely explains the reduction in sea ice extent in the Barents Sea and the week-long pause in sea ice growth for the Arctic as a whole during the middle of the month. Beginning around February 22, total Arctic sea ice extent started to increase again, driven by substantial increases in sea ice extent in the Bering Sea, and modest ice growth in the Barents Sea.
Previous studies, led by University of Washington scientist Ignatius Rigor (e.g., Rigor et al., 2002), suggest that a positive winter phase of the Arctic Oscillation favors low sea ice extent the subsequent September. Wind patterns “flush” old, thick ice out of the Arctic Ocean through the Fram Strait and promote the production of thin ice along the Eurasian coast that is especially prone to melting out in summer. However, in recent years, this relationship has not been as clear (Stroeve et al., 2011). The potential effects this winter’s positive AO on the summer evolution of ice extent and the September 2020 minimum bears watching.
The Bering Sea ice extent is near-average, which is in marked contrast to the previous two years when extent was at or near record lows for the satellite record through much of the winter (Thoman et al., 2020).
February 2020 compared to previous years
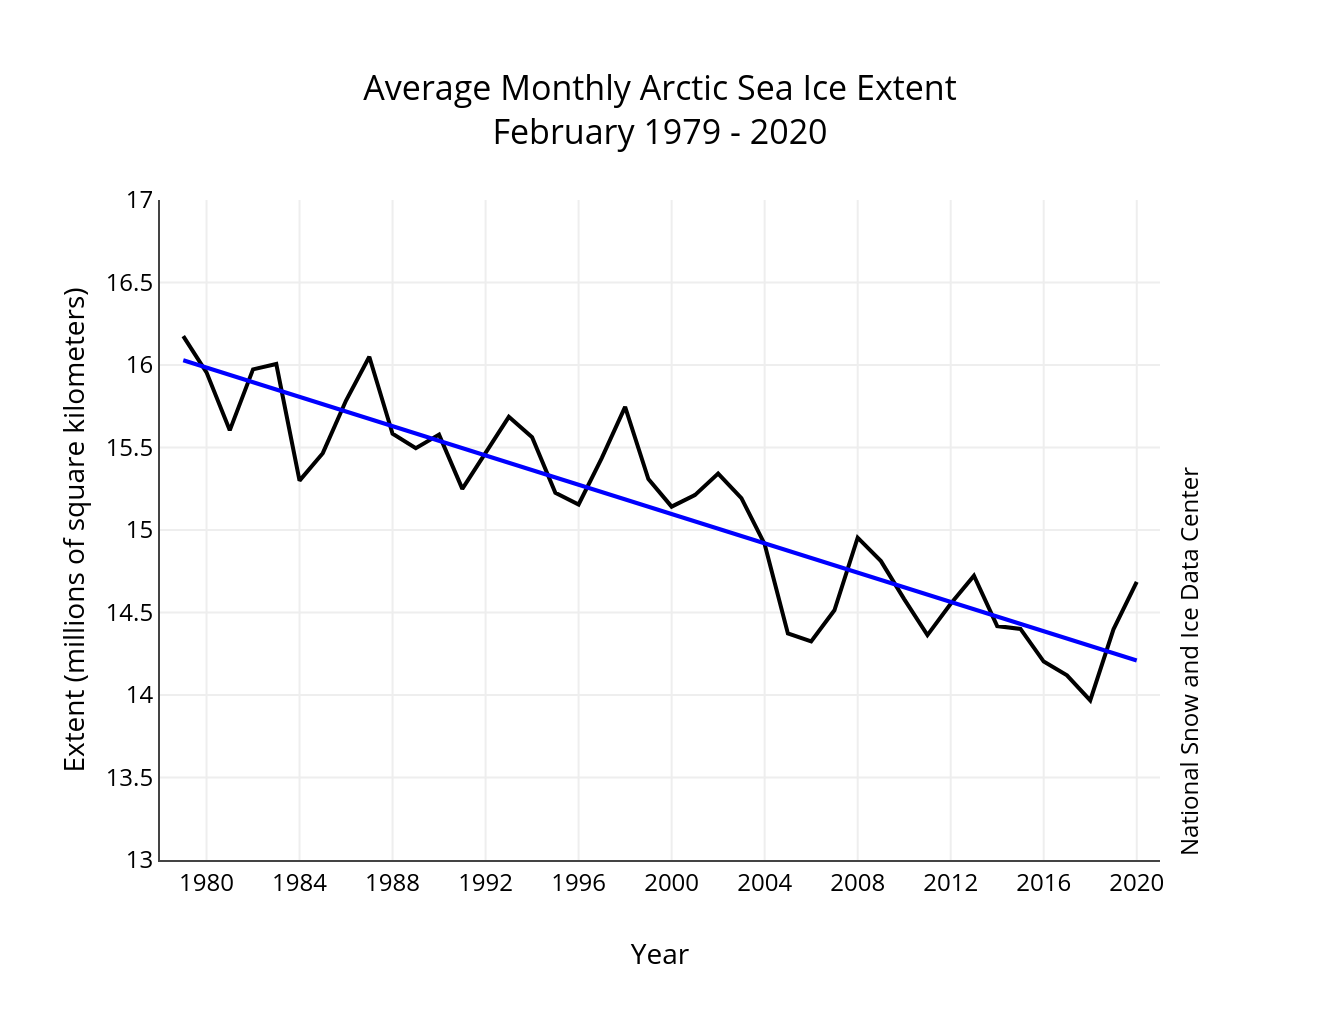
Figure 3. Monthly February sea ice extent for 1979 to 2020 shows a decline of 2.91 percent per decade.
Credit: National Snow and Ice Data Center
High-resolution image
Including 2020, the linear rate of decline for February ice extent is 2.91 percent per decade. This corresponds to a trend of 44,500 square kilometers (17,200 square miles) per year, which is roughly twice the size of the state of New Hampshire. Over the 42-year satellite record, the Arctic has lost about 1.75 million square kilometers (676,000 square miles) of sea ice in February, based on the difference in linear trend values in 2020 and 1979. This is comparable to the size of the state of Alaska.
Nearing the minimum in the south

Figure 4. Antarctic sea ice extent likely reached its annual minimum on February 20 and 21, 2020. Antarctic sea ice extent for February 20 and 21, 2020 was 2.69 million square kilometers (1.04 million square miles). The orange line shows the 1981 to 2010 average extent for February 21. Sea Ice Index data. About the data
Credit: National Snow and Ice Data Center
High-resolution image
As of February 20 and 21, Antarctic sea ice extent likely reached its annual minimum at 2.69 million square kilometers (1.04 million square miles). However, as of March 1, sea ice extent has increased only marginally above the minimum value, to 2.71 million square kilometers (1.05 million square miles). The latest Antarctic minimum over the satellite record was March 3. We anticipate that sea ice will continue to expand as late summer and autumn proceed.
At this time of year, Antarctic sea ice cover is characterized by a number of small remnant patches of ice around the coast, with the largest being the western Weddell Sea and the Amundsen-Ross Sea coastal area. Overall sea ice remains below the 1981 to 2010 average, a trend that has persisted since September 2016. Sea ice extent in the Weddell area is near average overall, while ice extent in the Amundsen-Ross region is well below average. However, a patch of sea ice in the Pine Island Bay region is hampering research vessels in the area seeking to study ice-ocean interaction near some of the very large and rapidly changing glaciers draining the West Antarctic Ice Sheet.
The increasing influence of ocean waves on sea ice
A new project from University of Washington’s Applied Physics Laboratory is focusing on the complex ways that ocean waves and sea ice are interacting, as reported in a recent ARCUS webinar by researcher Jim Thomson. In October 2019, a storm-generated swell of 3- to 4-meter (10- to 13-foot) waves was observed in the Chukchi Sea. These waves are significantly larger than any previously observed in the region and are linked to declining autumn sea ice cover. Waves and sea ice have a complex range of interactions (Squire, 2018). Sea ice acts as a barrier between the ocean and atmosphere, limiting the influence of winds on the ocean surface. Waves encountering an open pack are strongly damped by the interaction of ice floes bumping together. However, large waves can fracture the ice pack and set landfast ice in motion, further breaking up the ice pack and eventually reducing the damping effect. In some cases in Antarctica, the loss of sea ice damping of waves may trigger ice shelf collapse if the ice shelves have been pre-conditioned and weakened (Massom et al., 2018). When ice is forming, waves can push pancakes of ice together, aiding in ice formation. The Coastal Ocean Dynamics in the Arctic (CODA) and Stratified Ocean Dynamics of the Arctic (SODA) projects are dedicated to further understanding these complex interactions.
Introducing the Sea Ice Analysis Tool
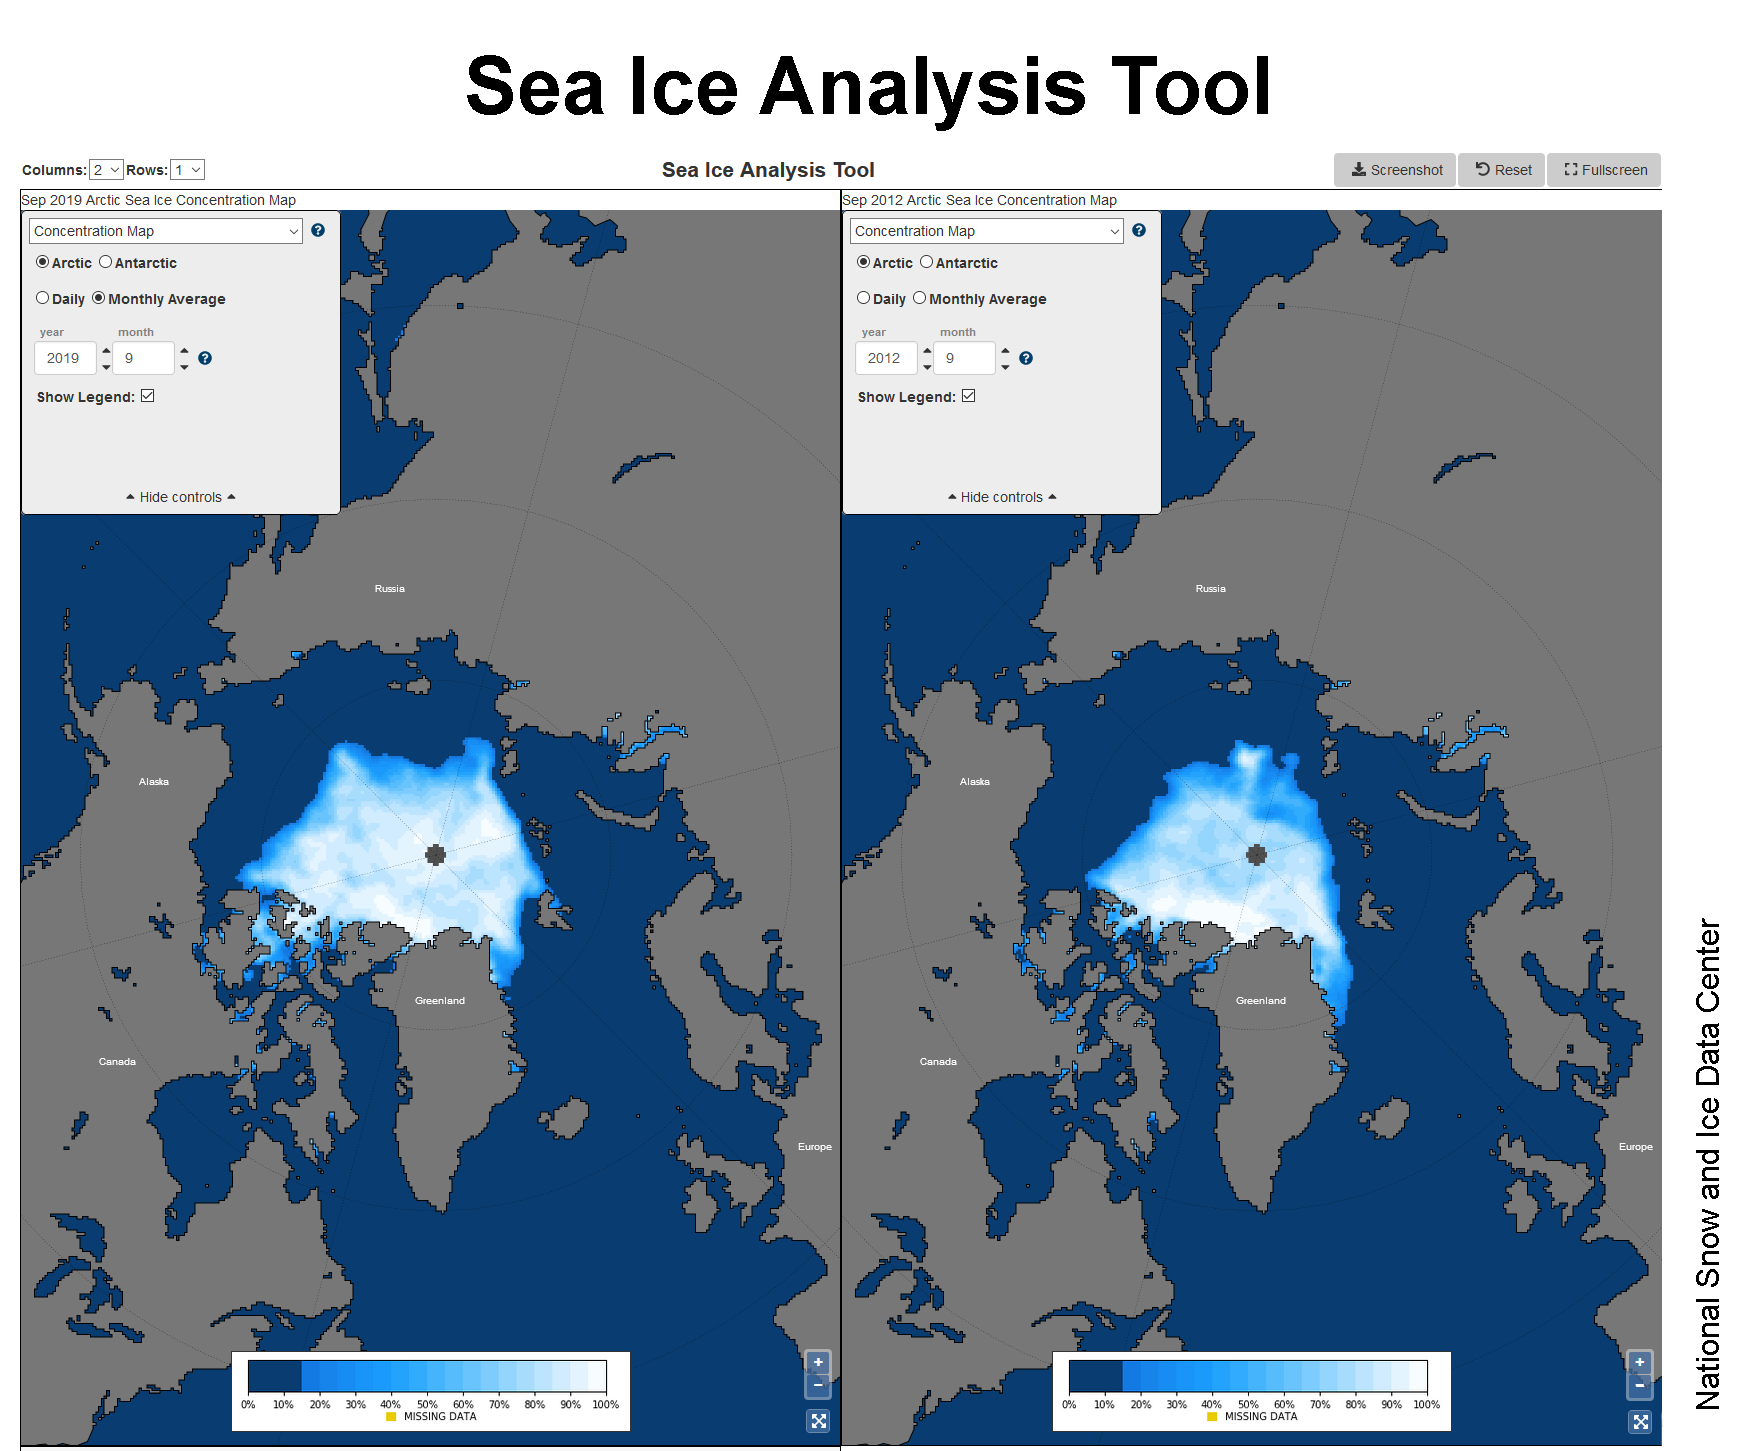
Figure 5. NSIDC developed the Sea Ice Analysis Tool to allow users to interactively analyze sea ice data from the Sea Ice Index while allowing them to visualize the data using different reference and average periods.
Credit: National Snow and Ice Data Center
High-resolution image
NSIDC has developed a new visualization tool—the Sea Ice Analysis Tool—that helps users customize sea ice extent and concentration data more easily than ever before. Users have the capability to create graphs or maps that show changes in sea ice based on their chosen criteria.
Drawing on input from the user community, the Arctic Sea Ice News & Analysis (ASINA) team developed the Sea Ice Analysis Tool as a way to allow users to interactively analyze sea ice data from the Sea Ice Index while allowing them to visualize the data using different reference and average periods. This is a change from other ASINA tools, such as ChArctic, that do not have this same flexibility because they use static averaging periods.
This new tool allows users to analyze monthly-averaged or daily sea ice extent and concentration via interactive maps and graphs. In addition, the user can plot monthly ice extent anomalies, map sea ice concentration anomalies, and display images of trends in sea ice concentration, with anomalies being departures from the long-term average.
All maps and graphs are customizable; they can be created for a variety of dates, averaging periods, and trends. In addition, maps can be zoomed to focus on a specific region.
Further reading
Gautier, A. 2020. Seeing sea ice: A new tool shows dynamic changes. NSIDC.org.
Massom, R. A., T. A. Scambos, L. G. Bennetts, P. Reid, V. A. Squire, and S. E. Stammerjohn. 2018. Antarctic ice shelf disintegration triggered by sea ice loss and ocean swell. Nature. doi.org/10.1038/s41586-018-0212-1.
Rigor, I. G., J. M. Wallace, and R. L. Colony. 2002. Response of Sea Ice to the Arctic Oscillation. Journal of Climate. doi.org/10.1175/1520-0442(2002)015<2648:ROSITT>2.0.CO;2.
Squire, V. A fresh look at how ocean waves and sea ice interact. 2018. Philosophical Transactions of the Royal Society A: Mathematical, Physical and Engineering Sciences. doi.org.colorado.idm.oclc.org/10.1098/rsta.2017.0342.
Stroeve, J. C., J. Maslanik, M. C. Serreze, I. Rigor, W. Meier, and C. Fowler. 2011. Sea ice response to an extreme negative phase of the Arctic Oscillation during winter 2009/2010, Geophyical Research Letters. doi:10.1029/2010GL045662.
Thoman, Jr., R. L., U. S. Bhatt, P. A. Bieniek, B. R. Brettschneider, M. Brubaker, S. L. Danielson, Z. Labe, R. Lader, W. N. Meier, G. Sheffield, and J. E. Walsh. 2020. The record low Bering Sea ice extent in 2018: Context, impacts, and an assessment of the role of anthropogenic climate change. Bulletin of the American Meteorological Society. doi:10.1175/BAMS-D-19-0175.1.
Thomson, J., Y. Fan, S. Stammerjohn, J. Stopa, W. E. Rogers, F. Girard-Ardhuin, F. Ardhuin, H. Shen, W. Perrie, H. Shen, S. Ackley, A. Babanin, Q. Liu, P. Guest, T. Maksym, P. Wadhams, C. Fairall, O. Persson, M. Doble, H. Graber, B. Lundr, V. Squires, J. Gemmricht, S. Lehneru, B. Holt, M. Meylan, J. Brozenax, and J. R. Bidlot. 2016. Emerging trends in the sea state of the Beaufort and Chukchi seas. Ocean Modelling. doi.org/10.1016/j.ocemod.2016.02.009.

