November 2017 will be remembered not for total Arctic ice extent, which was the third lowest recorded over the period of satellite observations, but for the record low extent in the Chukchi Sea. This is a key area for Arctic Ocean access, and is an indicator of oceanographic influences on sea ice extent.
Overview of conditions

Figure 1. Arctic sea ice extent for November 2017 was 9.46 million square kilometers (3.65 million square miles). The magenta line shows the 1981 to 2010 average extent for that month. Sea Ice Index data. About the data
Credit: National Snow and Ice Data Center
High-resolution image
Arctic sea ice extent for November 2017 averaged 9.46 million square kilometers (3.65 million square miles), the third lowest in the 1979 to 2017 satellite record. This was 1.24 million square kilometers (479,000 square miles) below the 1981 to 2010 average and 830,000 square kilometers (321,000 square miles) above the record low November extent recorded in 2016. Extent at the end of the month was below average over the Atlantic side of the Arctic, primarily in the Barents and Kara Seas, slightly above average in western Hudson Bay, but far below average in the Chukchi Sea. This continues a pattern of below-average extent in this region that has persisted for the last year.
Conditions in context
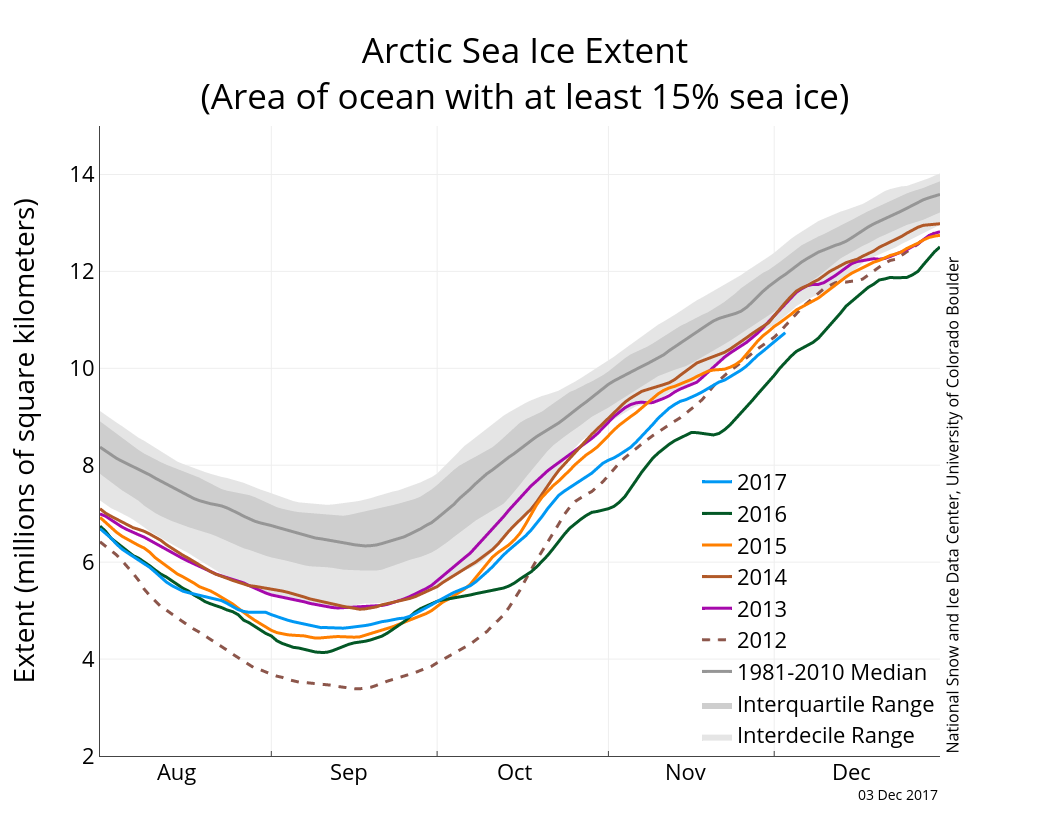
Figure 2. The graph above shows Arctic sea ice extent as of December 3, 2017, along with daily ice extent data for five previous years. 2017 is shown in blue, 2016 in green, 2015 in orange, 2014 in brown, 2013 in purple, and 2012 in dotted red. The 1981 to 2010 median is in dark gray. The gray areas around the median line show the interquartile and interdecile ranges of the data. Sea Ice Index data.
Credit: National Snow and Ice Data Center
High-resolution image
Ice growth during November 2017 averaged 80,100 square kilometers (30,900 square miles) per day. This was stronger than the average rate for the month of 69,600 square kilometers (26,900 square miles) per day. Ice growth was particularly rapid within Hudson Bay, Baffin Bay, and the Kara Sea.
November air temperatures at 925 hPa (about 3,000 feet above sea level) were above average over essentially all of the Arctic Ocean, with prominent warm spots (more than 6 degrees Celsius, or 11 degrees Fahrenheit above the 1981 to 2010 average) over the Chukchi Sea and north of Svalbard. The unusual warmth in the Chukchi Sea at least in part manifests the extensive open water in this region, but a pattern of winds blowing in from the southwest also appears to have had an influence. The warmth north of Svalbard is more clearly related to the average pattern of atmospheric circulation over the month, with an area of low pressure centered over the Norwegian Sea and an area of high pressure centered north of the Taymyr Peninsula combining to transport warm air into the region.
November 2017 compared to previous years

Figure 3. Monthly November ice extent for 1979 to 2017 shows a decline of 5.14 percent per decade.
Credit: National Snow and Ice Data Center
High-resolution image
The linear rate of sea ice decline for November is 55,000 square kilometers (21,200 square miles) per year, or 5.14 percent per decade. Recall from our previous post that NSIDC recently revised the way in which monthly average extents are computed, which has minor impacts on computed trends.
Open water in the Chukchi Sea

Figure 4. The map at top shows an analysis of sea ice concentration on November 30, 2017 in the area of the Bering and Chukchi Seas. The graph at bottom shows the combined sea ice concentration from 1978 to 2017, based on Sea Ice Index data.
Credit: Rick Thoman of the NOAA National Weather Service Alaska Region
High-resolution image
Based on an analysis by Rick Thoman of the NOAA National Weather Service, as of 19 November, ice extent in the combined Beaufort and Chukchi Seas sector was the lowest ever observed in the sea ice record (Figure 4). This was largely driven by the lack of sea ice within the Chukchi Sea. By the end of November, the Beaufort Sea was completely ice-covered. The NOAA analysis makes use of the NSIDC Sea Ice Index data set. As discussed in our June 7 post, the current state of the ice cover in this region likely has its origin as far back as last year, when warm conditions favored the persistence of open water in the Chukchi Sea into December of 2016.
Strong winds from the north occurred for a few days at the end of March and early April, pushing ice southward in the Bering Sea, breaking up the ice in the Chukchi Sea, and even flushing some ice out through the Bering Strait. We also suggested a possible role of a strong oceanic heat inflow to the Chukchi Sea via Bering Strait. In support of this view, in the summer of 2017, Rebecca Woodgate of the University of Washington, Seattle, sailing on the research vessel Norseman II, recovered mooring data that indicated an early arrival of warm ocean water in the strait, about a month earlier than the average. This resulted in June ocean temperatures that were 3 degrees Celsius (5 degrees Fahrenheit) above average. Higher ocean temperatures in summer plays a large role in the timing of when the ice will form again in winter. There is likely a considerable amount of heat remaining in the top layer of the ocean, which will need to be lost to the atmosphere and outer space before the region becomes fully ice covered.
Low Antarctic sea ice extent
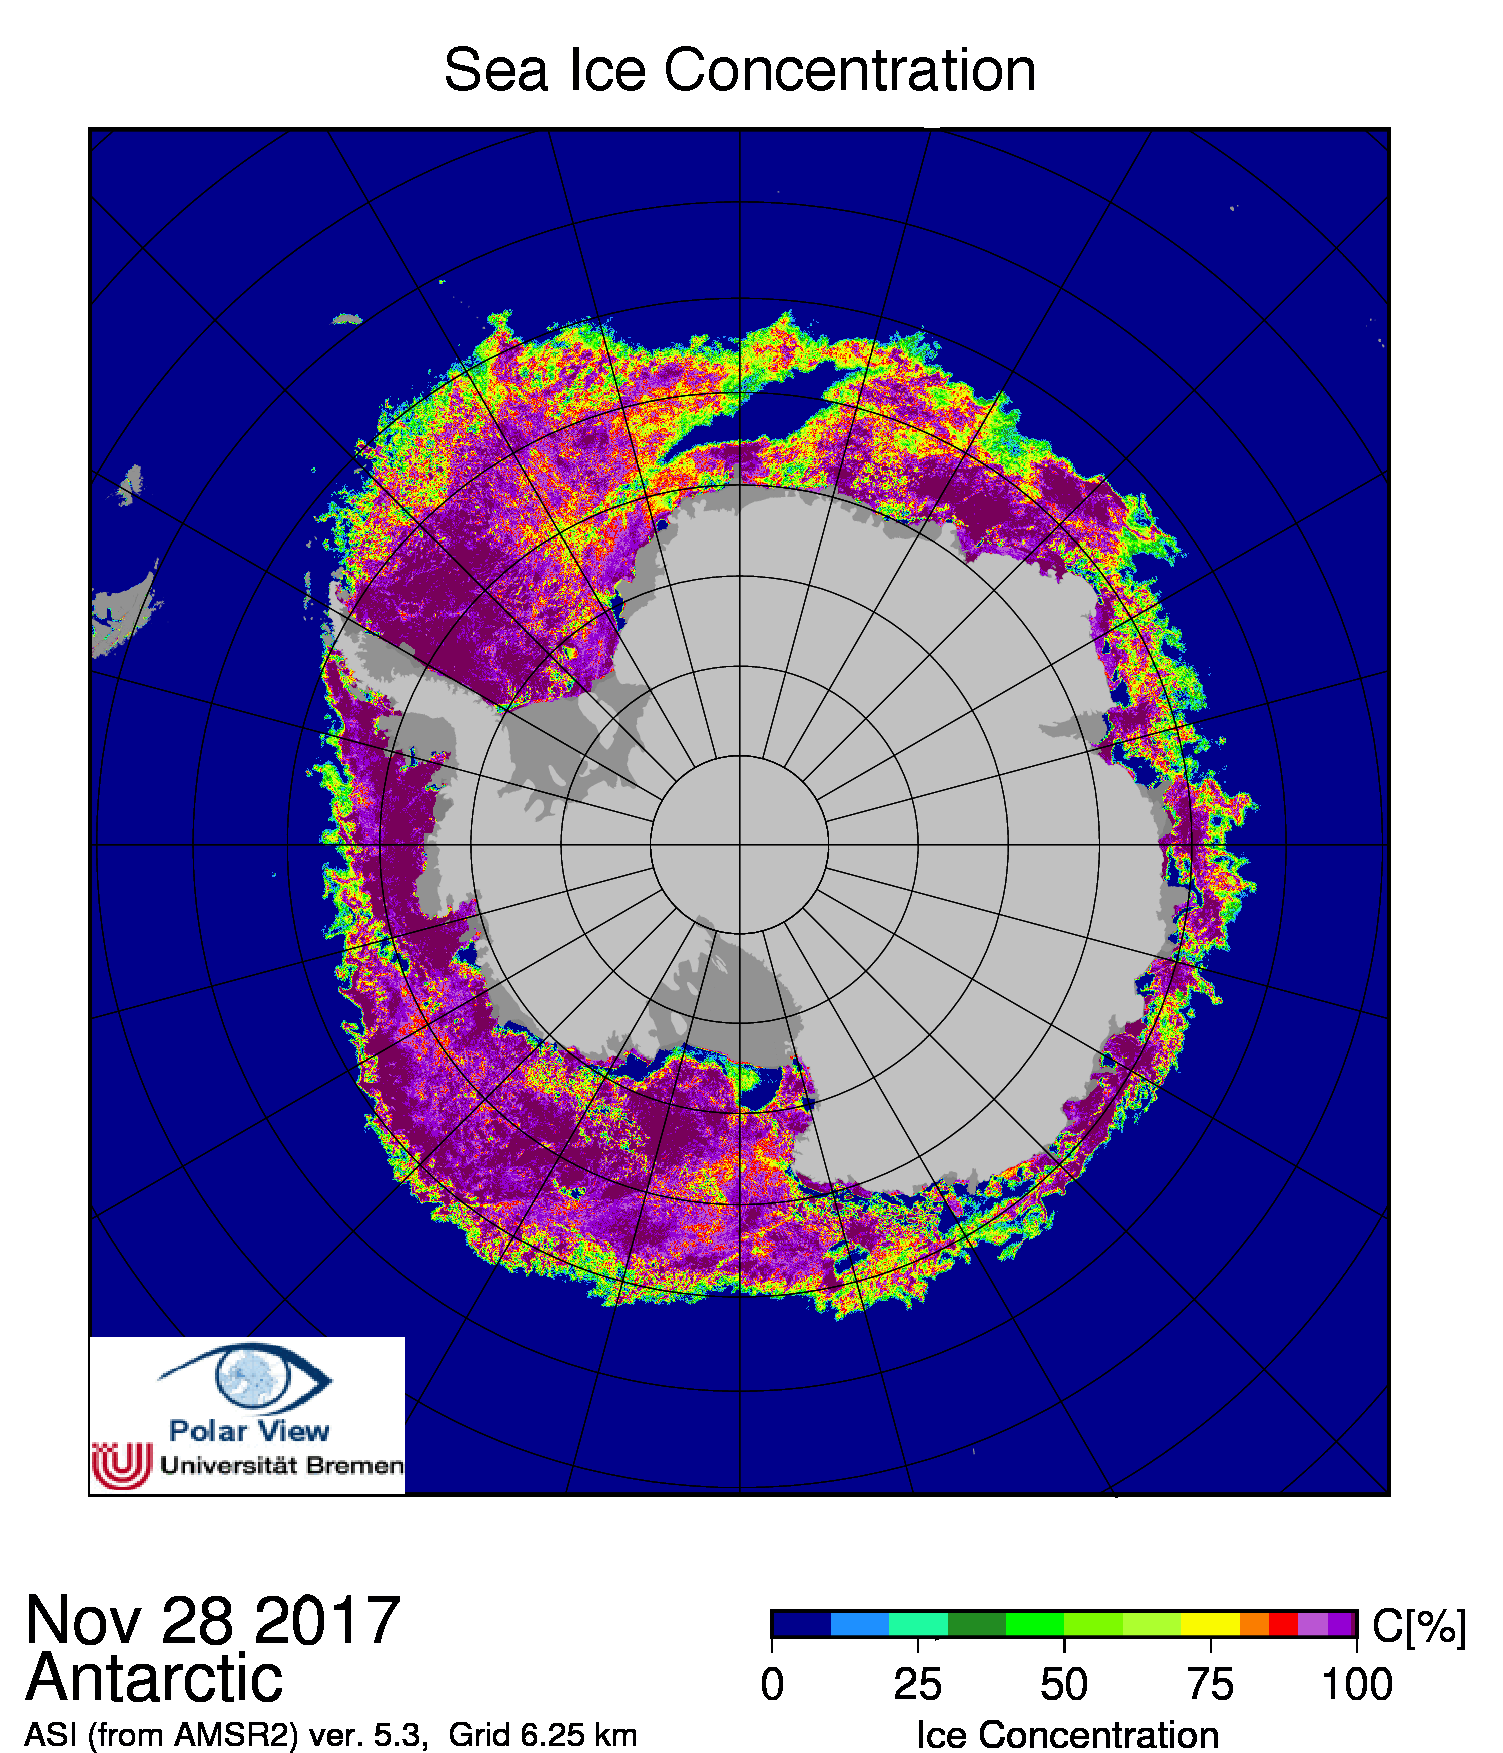
Figure 5a. Antarctic sea ice concentration from AMSR2, in percent, for November 28, 2017. The Maud Rise polynya is seen at top.
Credit: University of Bremen
High-resolution image

Figure 5b. Small tabular icebergs are seen in the marginal ice zone of the northern Weddell Sea on November 22, 2017 during a NASA Operation IceBridge flight.
Credit: NASA/John Sonntag
High-resolution image
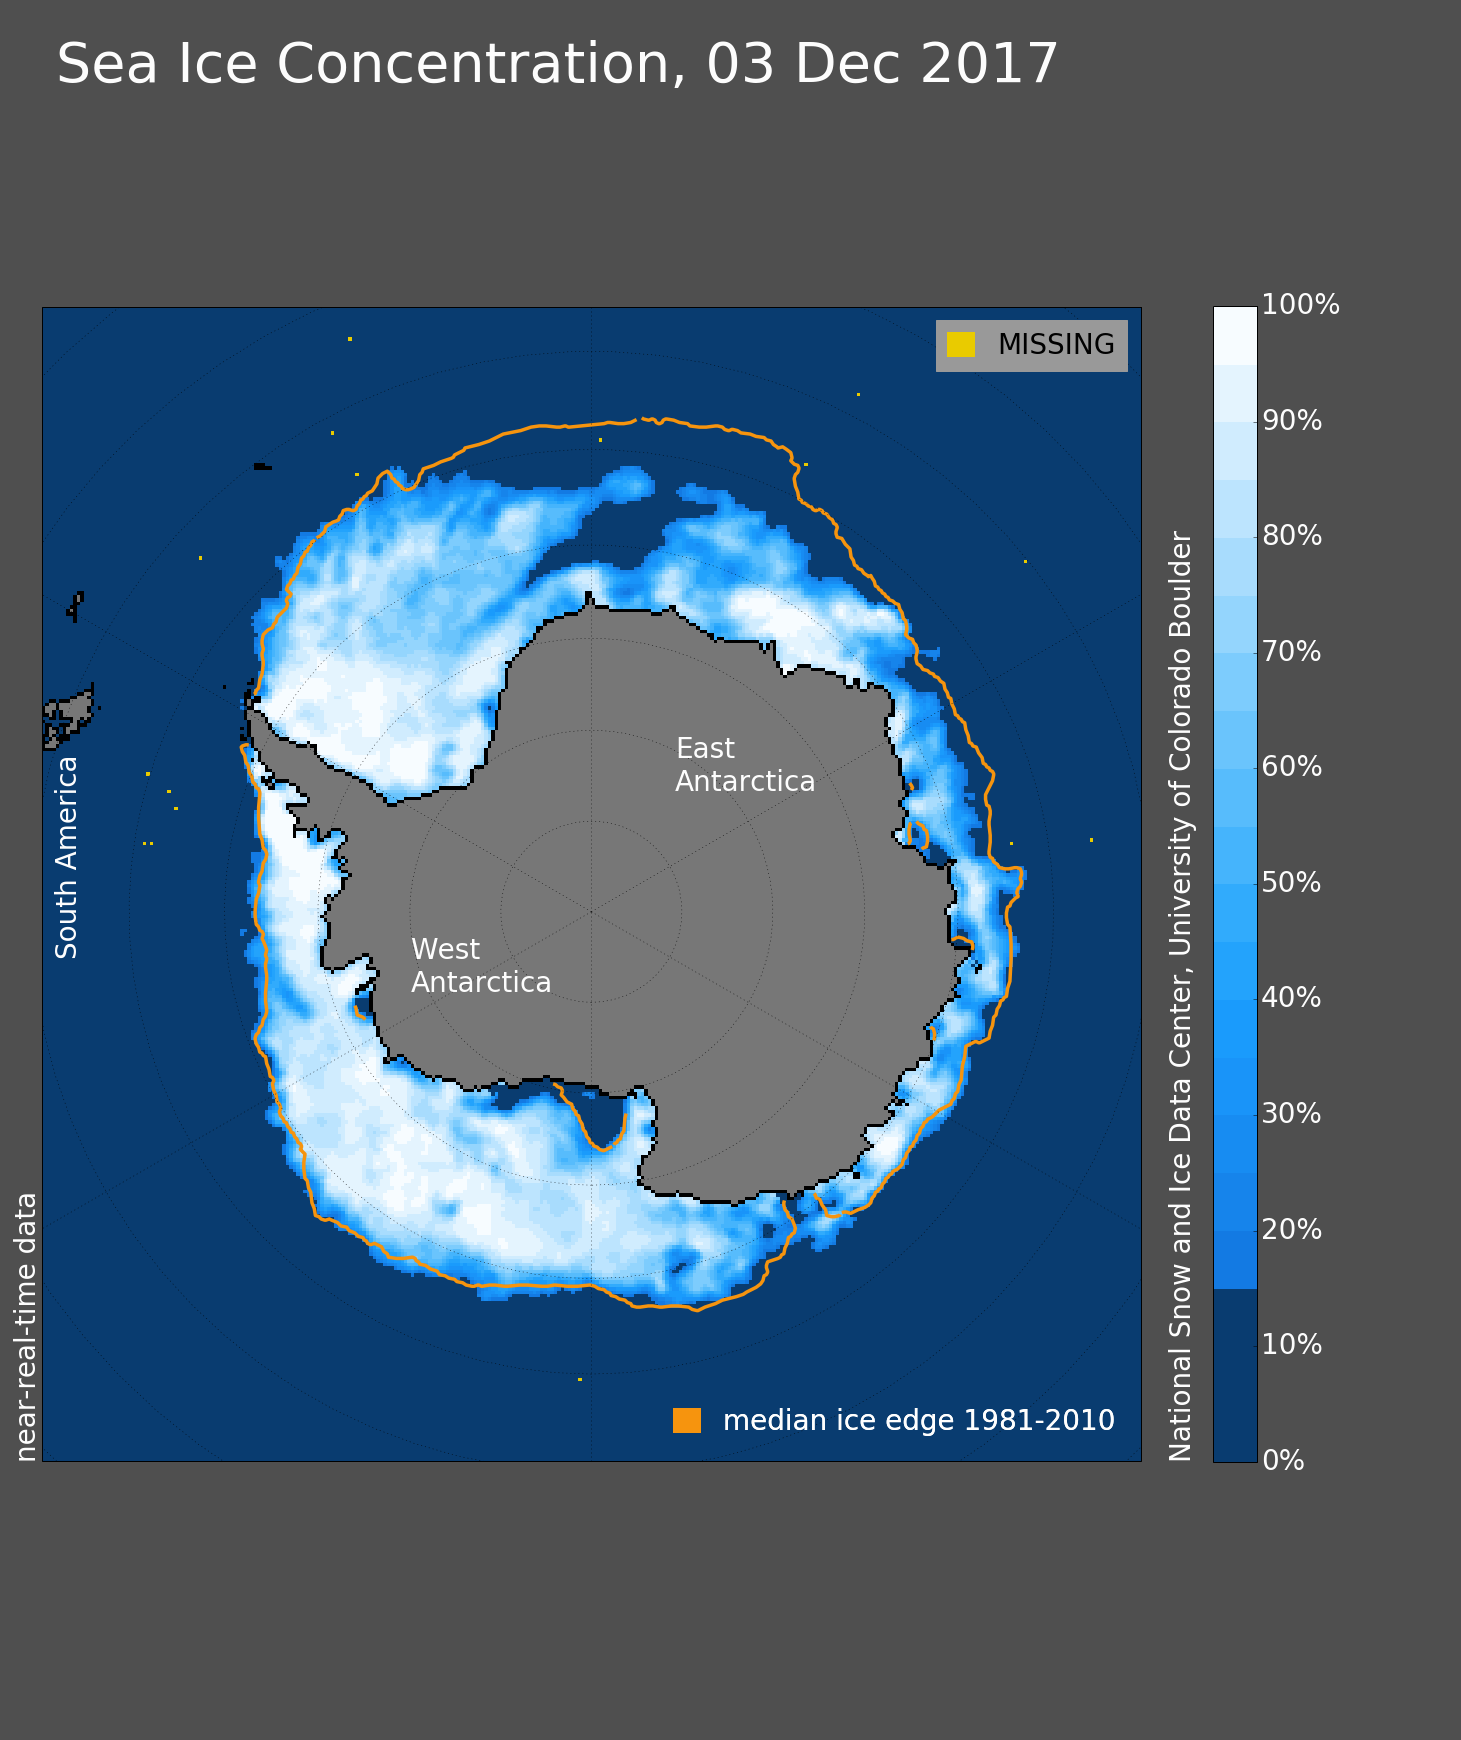
In the Southern Hemisphere, where it is late spring, sea ice declined at a faster-than-average pace after the very late-season October 12 maximum extent. This led to the third-lowest November average monthly extent in the satellite record, behind 1986 and 2016. Sea ice extent was near-average in all regions except the Weddell Sea, where extent is at a satellite-era record low.
The atmospheric circulation for November exhibited a very strong wave-3 pattern. In a wave-3 pattern, there are three major low-pressure areas around the continent separated by three high-pressure areas. Air temperatures for the month were near-average in most regions except for the eastern Weddell Sea, consistent with the reduced sea ice extent there.
The Maud Rise Polynya (Figure 5a) continued to grow through November, as increased sunshine and air temperatures allowed the upwelling warm water to expand the opening in the floating sea ice cover. At the beginning of December, retreat of the sea ice edge converted the polynya to a large embayment in the sea ice cover.

