After setting a record low seasonal maximum in early March, Arctic sea ice extent continued to track low through July. However, the rate of ice loss slowed in August and September. The daily minimum extent, reached on September 13, was the eighth lowest on record, while the monthly average extent was seventh lowest. In Antarctica, sea ice extent may have reached its annual winter maximum.
Overview of conditions
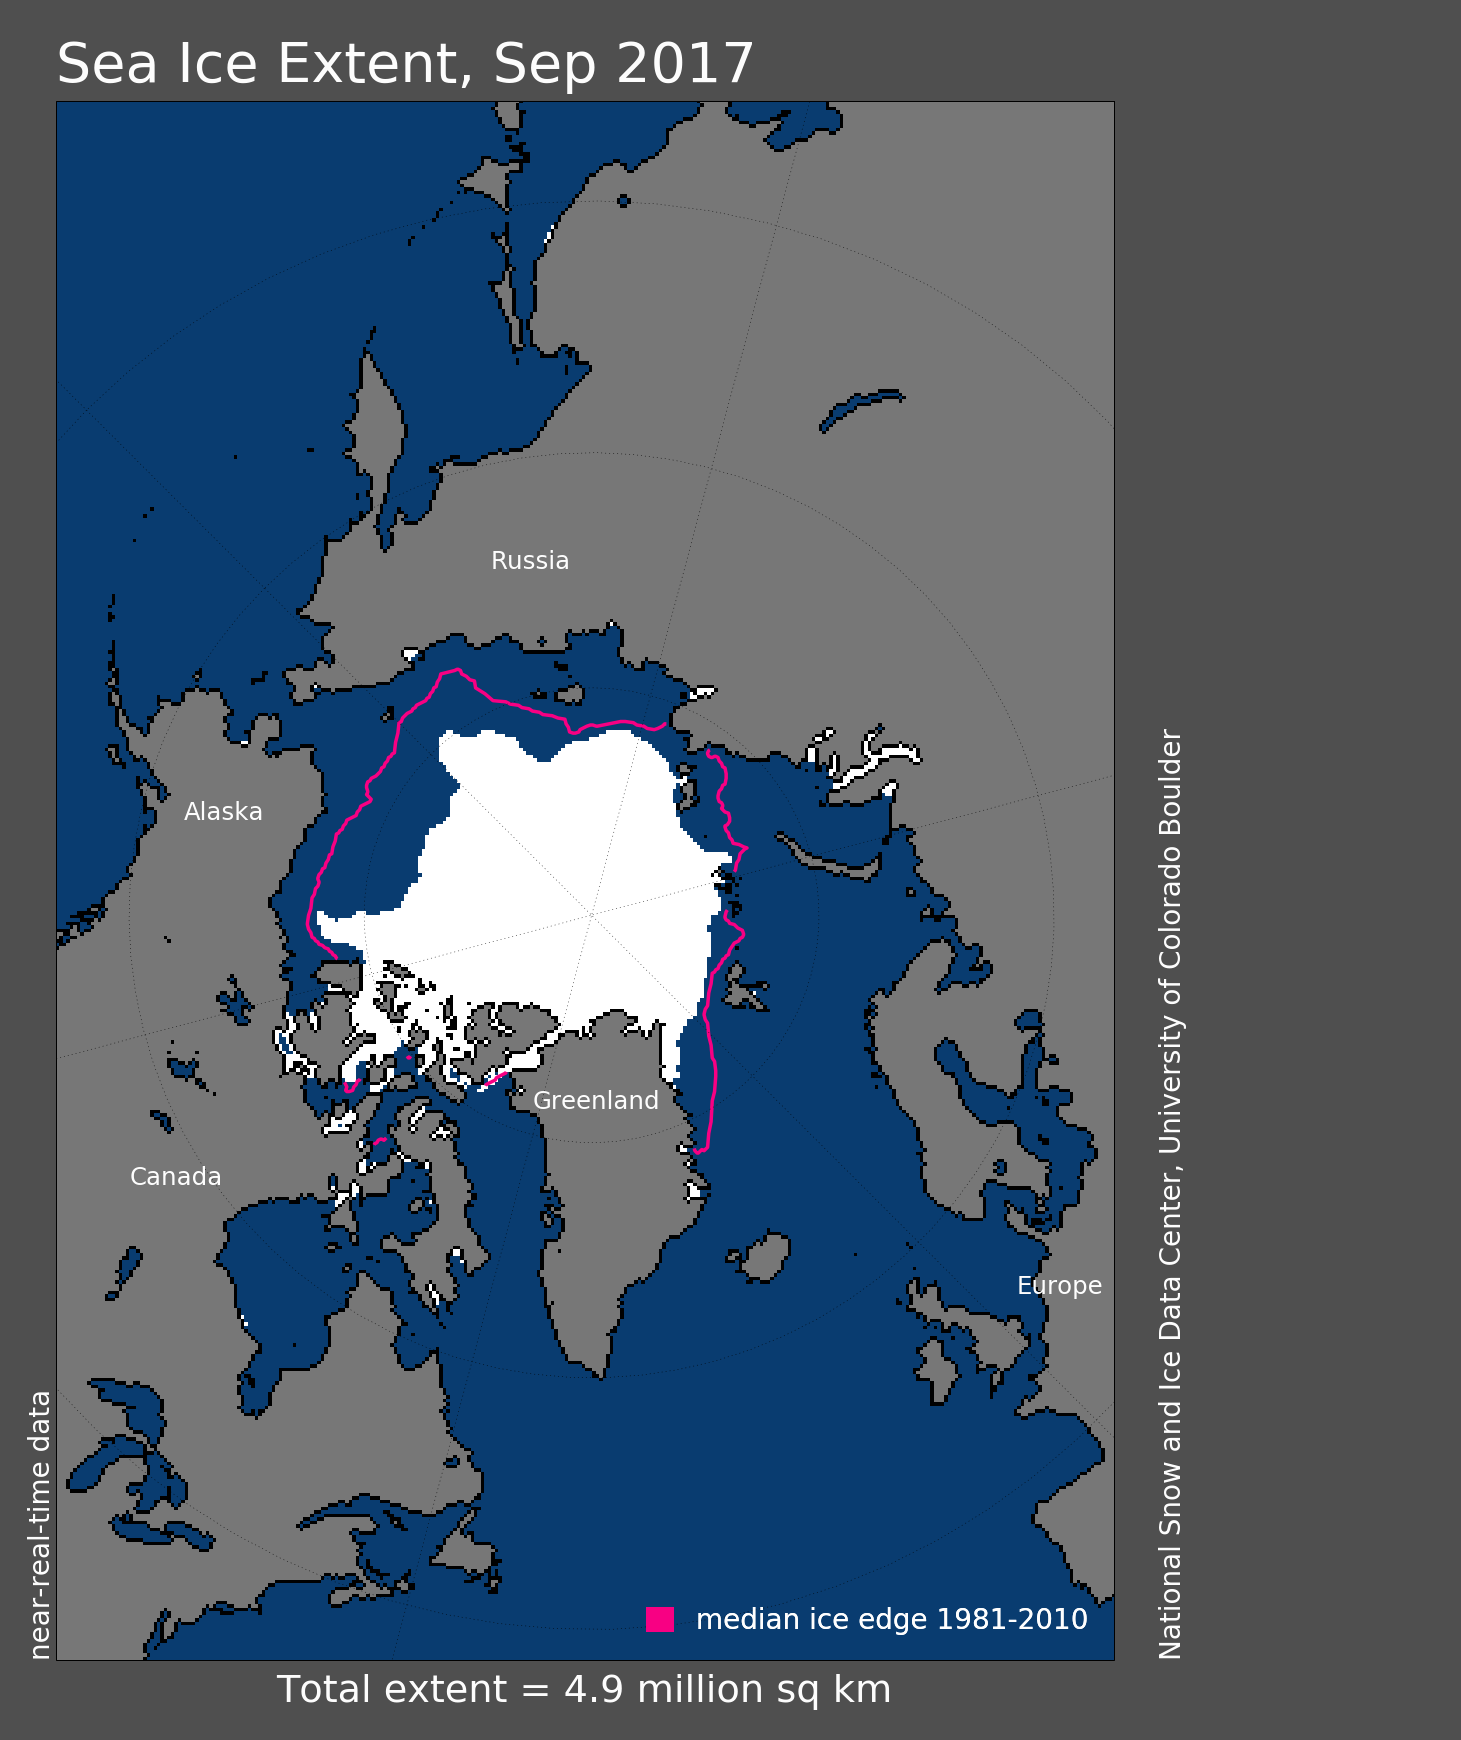
Figure 1. Arctic sea ice extent for September 2017 was 4.87 million square kilometers (1.88 million square miles). The magenta line shows the 1981 to 2010 average extent for that month. Sea Ice Index data. About the data
Credit: National Snow and Ice Data Center
High-resolution image
Arctic sea ice extent for September 2017 averaged 4.87 million square kilometers (1.88 million square miles), the seventh lowest in the 1979 to 2017 satellite record. This was 1.67 million square kilometers (645,000 square miles) below the 1981 to 2010 average, and 1.24 million square kilometers (479,000 square miles) above the record low September set in 2012.
After reaching the minimum on September 13 (eighth lowest on record), extent initially increased slowly (about 20,000 square kilometers, or 8,000 square miles, per day). However, starting September 26 and persisting through the end of the month, ice growth rates increased to about 60,000 square kilometers (23,000 square miles) per day. During the second half of the month, extent increased in all sectors except in the Beaufort Sea, where some local ice retreat persisted. The most rapid growth occurred along the Siberian side of the Arctic Ocean, where the ice edge advanced as much as 150 kilometers (90 miles) over the latter half of September. At the end of September, the ice edge in the Beaufort and Chukchi Seas remained considerably further north than is typical.
Conditions in context

Figure 2a. The graph above shows Arctic sea ice extent as of October 4, 2017, along with daily ice extent data for five previous years. 2017 is shown in blue, 2016 in green, 2015 in orange, 2014 in brown, 2013 in purple, and 2012 in dotted brown. The 1981 to 2010 median is in dark gray. The gray areas around the median line show the interquartile and interdecile ranges of the data. Sea Ice Index data.
Credit: National Snow and Ice Data Center
High-resolution image
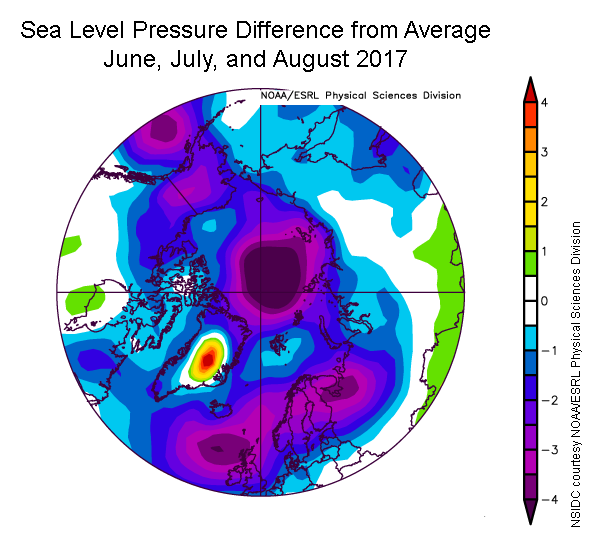
Figure 2b. This image shows the departure from average sea level pressure in millibars over the Arctic for June, July, and August in 2017. Yellows and reds indicate higher than average pressures; blues and purples indicate lower than average pressures.
Credit: NSIDC courtesy NOAA/ESRL Physical Sciences Division
High-resolution image
September air temperatures at the 925 hPa level (approximately 2,500 feet above sea level) were above average over much of the Arctic Ocean. Temperatures ranged from 5 degrees Celsius (9 degrees Fahrenheit) above the 1981 to 2010 long term average in the far northern Atlantic east of Greenland, to 1 to 2 degrees Celsius (2 to 4 degrees Fahrenheit) above the reference period in the western Arctic. Cooler conditions (1 degree Celsius or 2 degrees Fahrenheit below average) were present in Baffin Bay. Part of the above average temperatures over the coastal areas of the Arctic Ocean and in the northern North Atlantic likely results from heat fluxes from open water.
Looking back at this past summer (June through August), air temperatures at the 925 hPa level averaged for June through August were near or below the 1981 to 2010 average over much of the Arctic Ocean, notably along the Siberian side centered over the Laptev Sea (1 degree Celsius or 1.8 degrees Fahrenheit below the 1981 to 2010 average). By contrast, temperatures were slightly above average over much of the East Siberian, Chukchi and Beaufort Seas (1 degree Celsius, or 1.8 degrees Fahrenheit above average).
Like 2016, the summer of 2017 was characterized by persistently stormy patterns over the central Arctic Ocean, reflected in the summer average sea level pressure field (Figure 2b) as an area of low pressure centered just south of the North Pole in the Siberian sector of the Arctic. As has been shown in past studies, low pressure systems found over the central Arctic Ocean in summer are typically “cold cored.” This helps to explain the cool summer temperatures noted above. The cyclonic (counterclockwise) winds associated with the stormy pattern also tend to spread out the sea ice. Both processes likely helped to slow sea ice loss this summer.
September 2017 compared to previous years
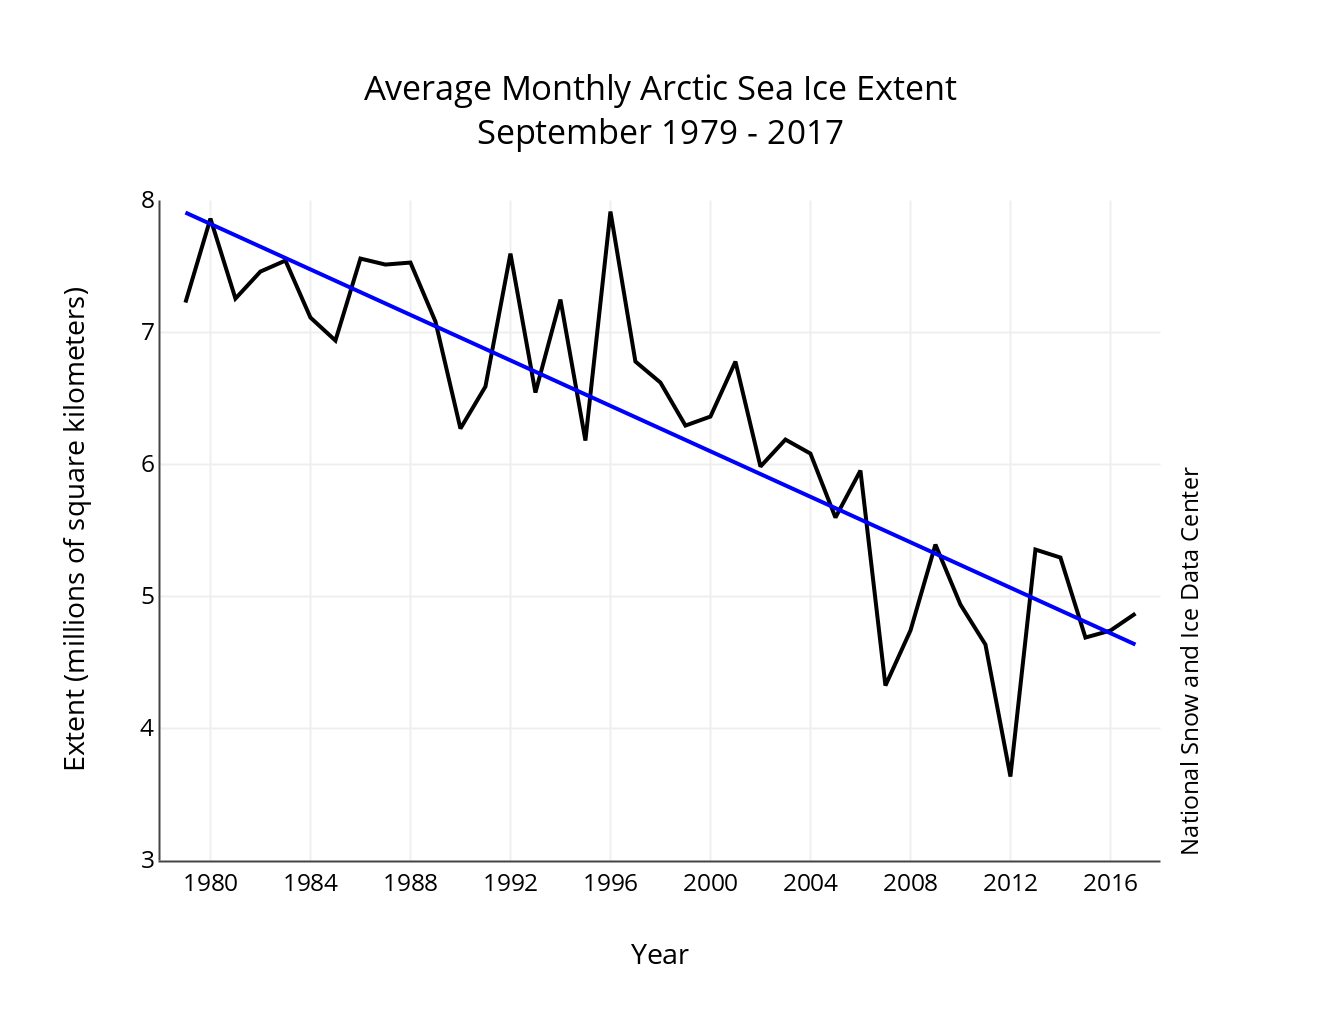
Figure 3. Monthly September ice extent for 1979 to 2017 shows a decline of 13.2 percent per decade.
Credit: National Snow and Ice Data Center
High-resolution image
The linear rate of sea ice decline for September is 86,100 square kilometers (33,200 square miles) per year, or 13.2 percent per decade relative to the 1981 to 2010 average. For comparison, the decline rate was calculated at 13.7 percent after the 2013 minimum, and 13.4 percent in 2016. Although sea ice shows significant year-to-year variability, the overall trend of decline remains strong.
Thickness and age trends in Arctic sea ice from models and data
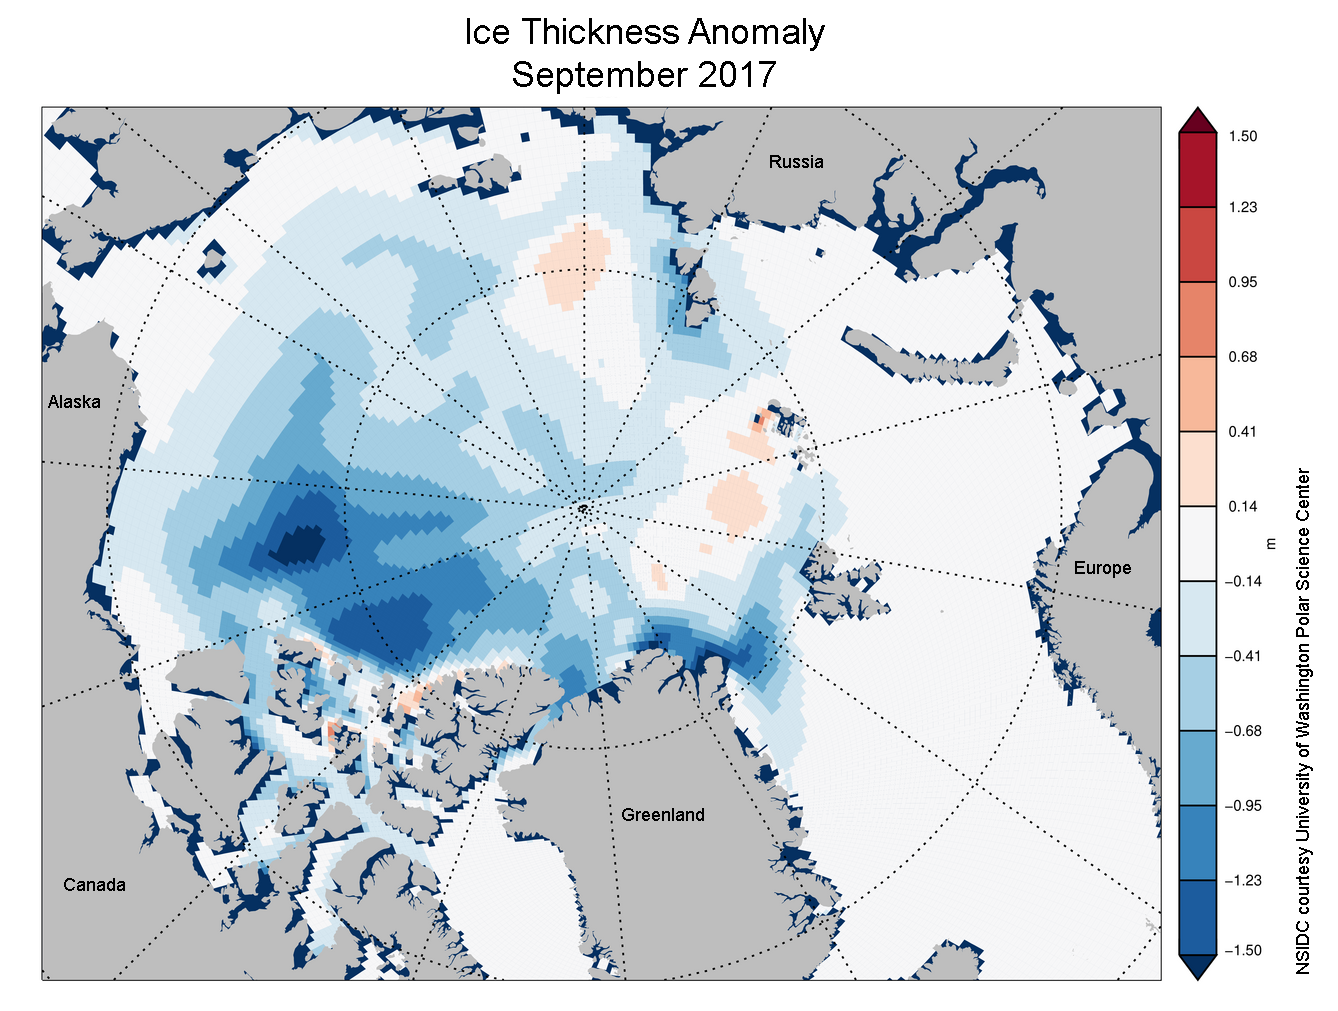
Figure 4a. This image from the Pan-Arctic Ice Ocean Modeling and Assimilation System (PIOMAS) shows Arctic sea ice thickness departures from average (anomaly) in meters for September 2017, relative to the 2000 to 2015 average. Reds indicate thicker than average ice; blues indicate thinner than average ice.
Credit: NSIDC courtesy University of Washington Polar Science Center
High-resolution image
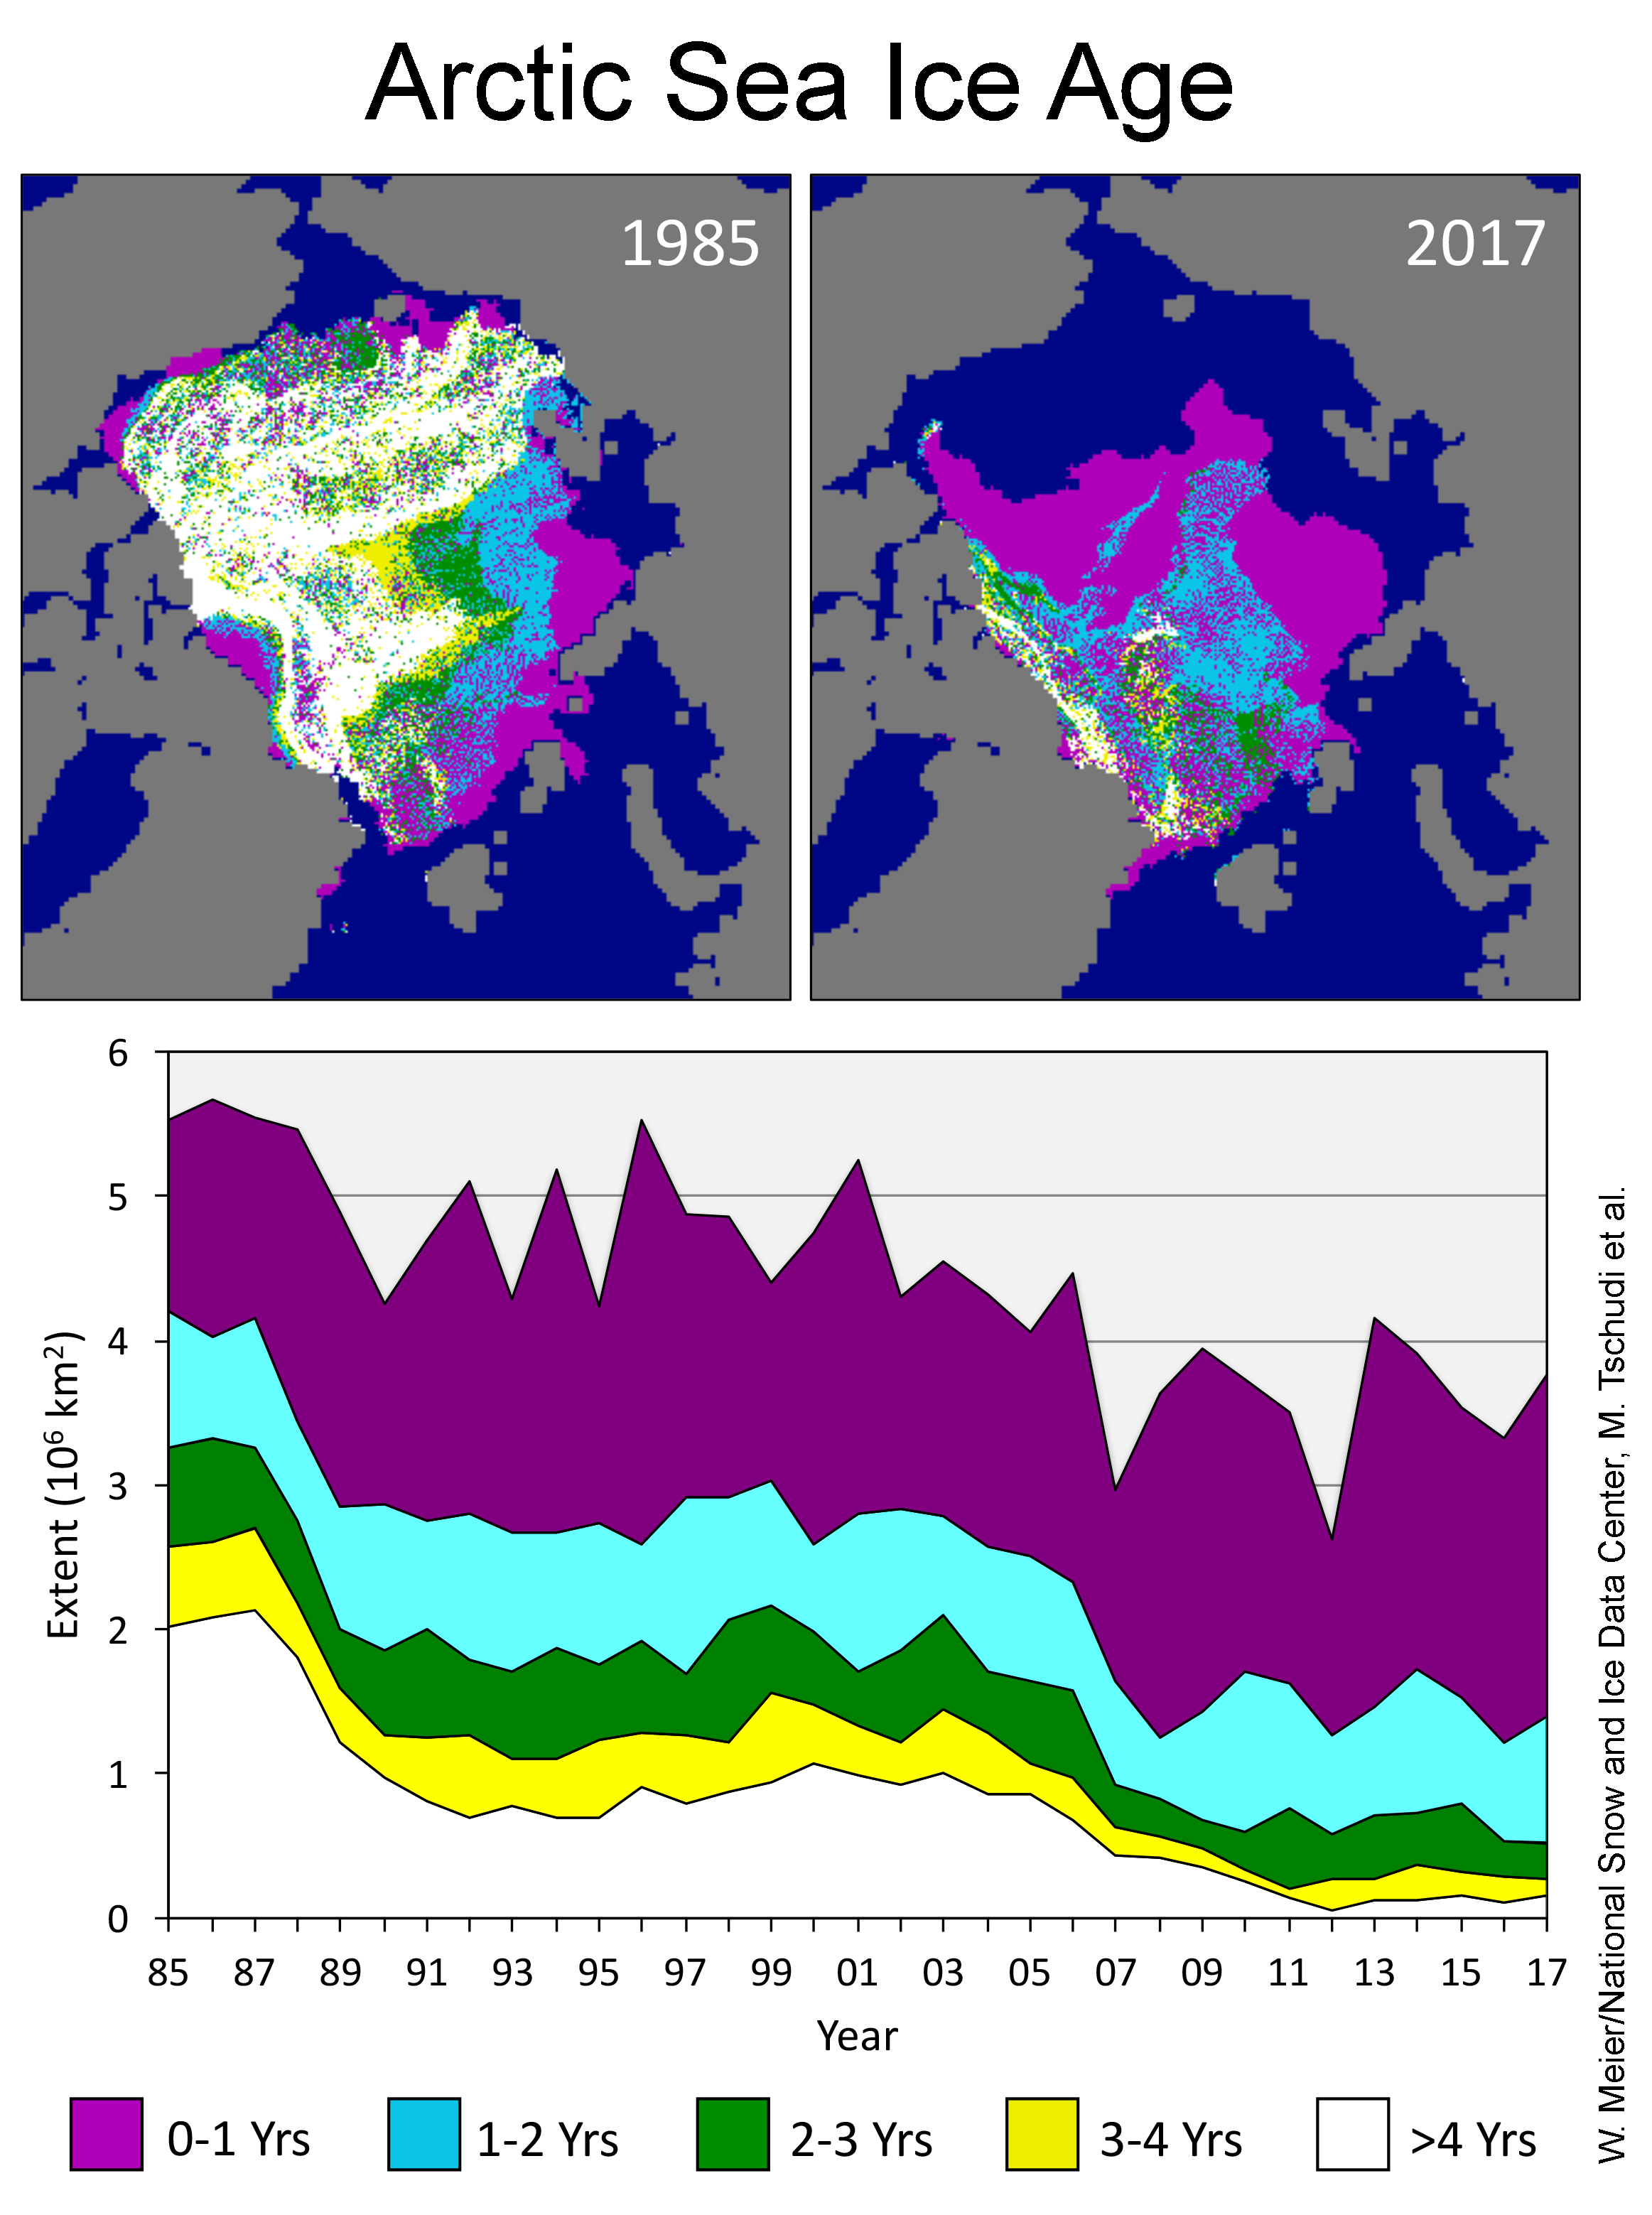
Figure 4b. Sea ice age distribution at the annual minimum extent for 1985 (upper left) and 2017 (upper right). Time series (bottom) of different age categories the minimum extent for 1985 to 2017. Note that the ice age product does not include ice in the Canadian Archipelago. Data from Tschudi et al., EASE-Grid Sea Ice Age, Version 3
Credit: W. Meier/National Snow and Ice Data Center, M. Tschudi et al.
High-resolution image
According to estimates from the University of Washington Polar Science Center’s PIOMAS, which assimilates observational data into a coupled ice-ocean model, sea ice volume was at record low levels from January through June of 2017. However, the generally cool summer conditions slowed the rate of ice melt, and the ice volume for September ended up fourth lowest in the PIOMAS record, above 2010, 2011, and 2012.
Another way to assess the volume of the ice, at least in a qualitative sense, is through tracking sea ice age (Figure 4b). Older ice is generally thicker ice. Over the satellite record, there has been a significant decline in coverage of the oldest, thickest ice. While this year’s minimum sea ice extent is higher than in 2016, the marginal gain can be largely attributed to younger ice types: first-year ice (0 to 1 years old) and second-year ice (1 to 2 years old). The oldest ice, that which is over 4 years old, is only slightly higher than last year and remains almost non-existent within the Arctic. At the minimum this year, ice older than 4 years constituted only ~150,000 square kilometers (~58,000 square miles), compared to over 2 million square kilometers (~770,000 square miles) during the mid-1980s.
Antarctic maximum extent
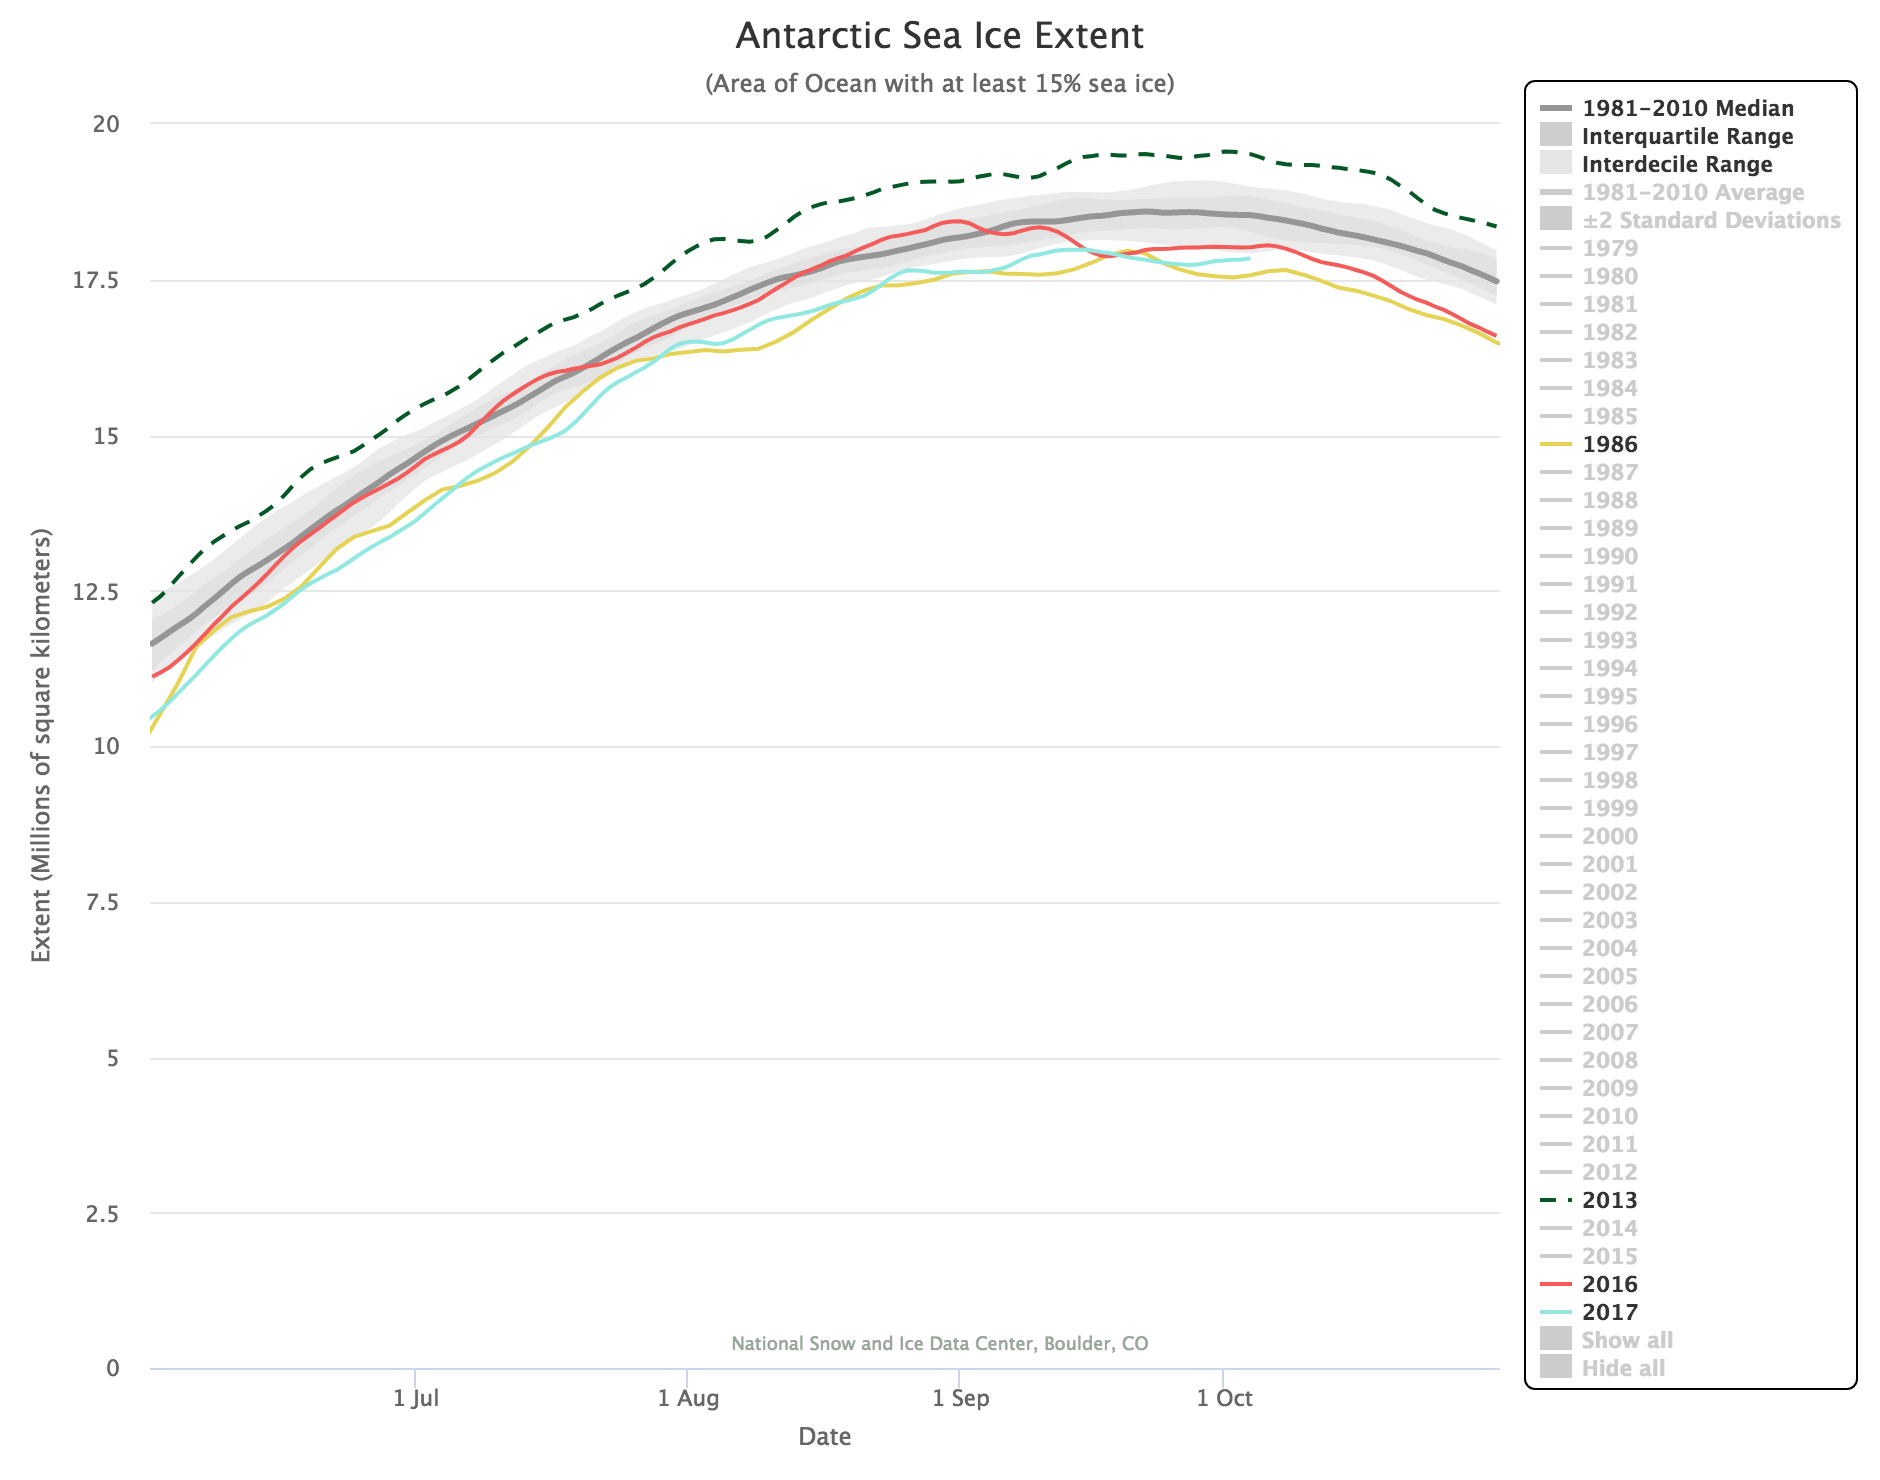
Figure 5. The graph above shows Antarctic sea ice extent as of October 4, 2017, along with daily ice extent data for 2017 (aqua), 2016 (red), 2013 (dotted green), and 1986 (yellow). The 1981 to 2010 median is in dark gray. The gray areas around the median line show the interquartile and interdecile ranges of the data. Sea Ice Index data.
Credit: National Snow and Ice Data Center
High-resolution image
Antarctic sea ice may have reached its maximum extent on September 15, at 17.98 million square kilometers (6.94 million square miles), among the earliest maxima on record. If this date and extent hold, it will be the second-lowest daily maximum in the satellite record, 20,000 square kilometers (7,700 square miles) above 1986. Antarctic sea ice extent has been at record or near-record lows since September 2016. A series of recent studies have explored causes of the sudden decline in extent that occurred in austral late winter and spring of 2016. Most studies conclude that an unusual period of strong meridional winds—consistent with a very pronounced negative phase of the Southern Annular Mode index, coupled with a significant ‘wave-3 pattern’ in the atmospheric circulation—were the cause. A ‘wave-3 pattern’ refers to a tendency for circulation around the southern continent to resemble a three-leaf clover, rather than the more typical near-zonal (along lines of latitude) pattern.
The Maud Rise polynya, discussed in our last post, continues to grow and is now at about 35,000 square kilometers (14,000 square miles). A recent study (see Further reading, below) discusses how its formation is related to climate patterns and natural variability, and that the recent reappearance supports a forecast by an updated climate model.
Driftwood and long-term changes in Arctic ice movement
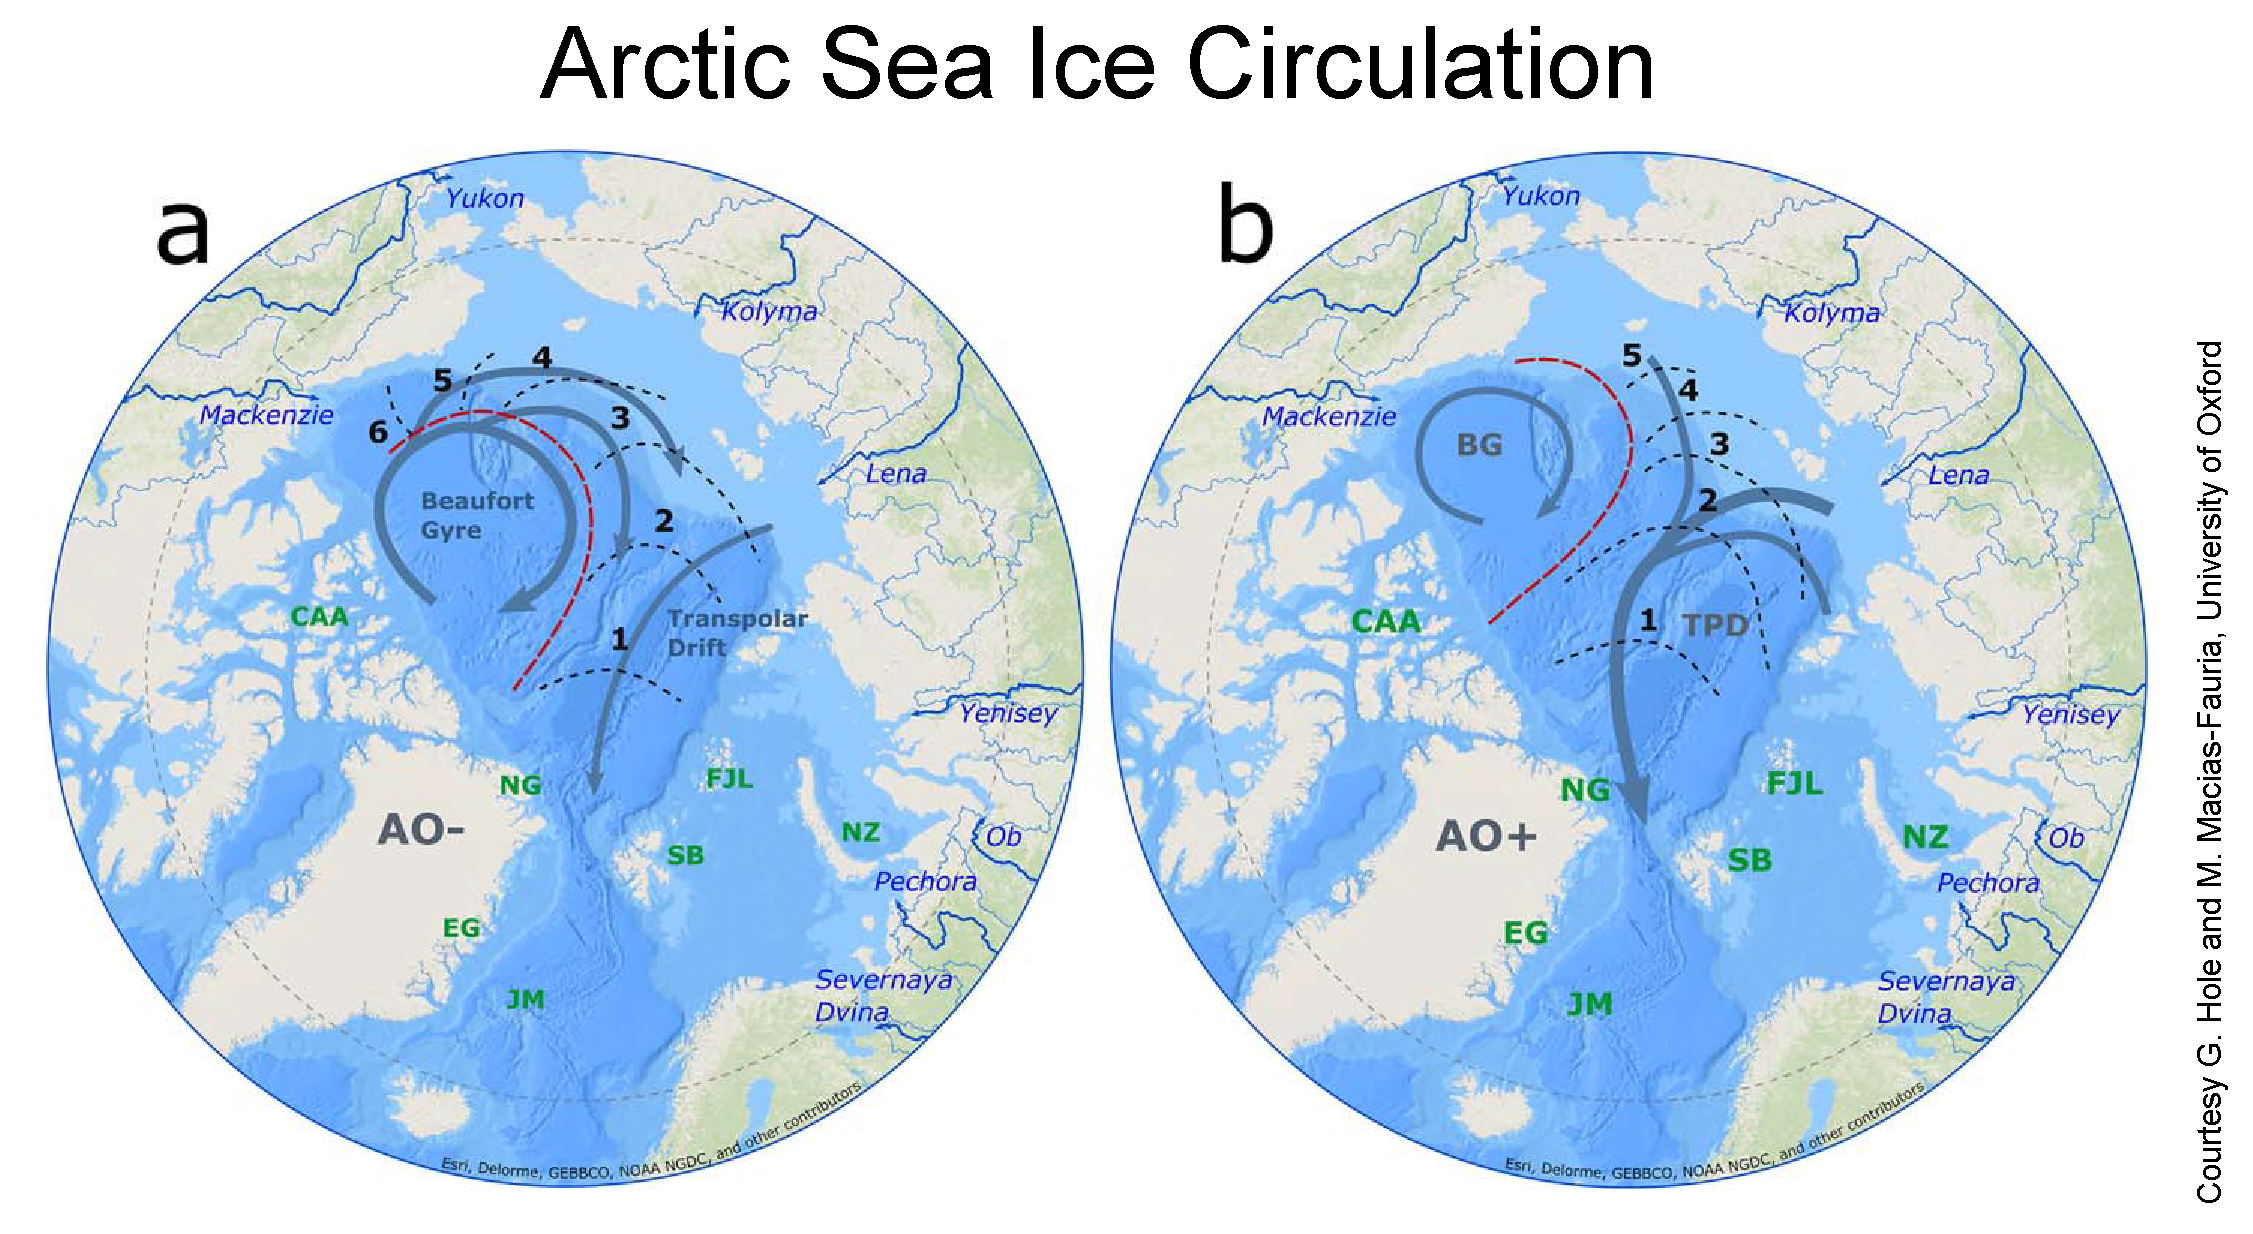
Figure 6. The maps show two modes of wintertime Arctic sea ice circulation patterns. (a) shows the Low Arctic Oscillation (AO) index has a strong Beaufort Gyre which supports ice re-circulation within the Arctic. (b) shows the High AO index in which the Beaufort Gyre is weak and the Transpolar Drift expands, leading to Arctic ice exported in a shorter time interval. Bold numbers show the average time in years for ice starting from various locations to be exported through Fram Strait under the illustrated patterns. The red dashed lines encircle the region of ice recirculation and persistence (Rigor et al., 2002). Over continents, light blue lines show watersheds with named major rivers (shown as bold blue lines) that export driftwood into the Arctic Ocean. Green letters indicate driftwood sample regions: CAA, Canadian Arctic Archipelago; EG, East Greenland; JM, Jan Mayen; NG, North Greenland; FJL, Franz Josef Land; NZ, Novaya Zemlya; SB, Svalbard. Circulation patterns compiled and modified from Rigor et al. (2002).
Credit: G. Hole and M. Macias-Fauria, The Cryosphere Discuss.
High-resolution image
While the satellite record has been key in documenting large declines in the Arctic sea ice cover during the past four decades, the data record is still relatively short. To provide a longer record, scientists turn to the geologic record and proxy data. One approach is to analyze the age, transport, and deposition of driftwood. Driftwood distribution depends strongly on past sea ice conditions and ocean currents. New research using 913 driftwood samples collected across the western Arctic (Figure 6) has shed new insight on sea ice changes during the Holocene, between 12,000 years ago to present. During the early Holocene (12,000 to 8,000 years ago), the analysis suggests that the clockwise Beaufort Gyre dominated Arctic Ocean circulation, allowing more sea ice to stay within the Arctic Ocean. In the mid-Holocene (8,000 to 4,000 years ago), temperatures were higher and the Transpolar Drift dominated, leading to more ice export out of the Arctic Ocean through Fram Strait and less sea ice in the Arctic Ocean. In the late Holocene (4,000 years ago to present), the Beaufort Gyre once again strengthened as temperatures slowly cooled until the most recent several decades.
Further reading
Hole, G. M. and M. Macias-Fauria. 2017. Out of the woods: Driftwood insights into Holocene pan-Arctic sea ice dynamic., J. Geophys. Res. Oceans, 122, doi:10.1002/2017JC013126.
Reintges, A., T. Martin, M. Latif, and W. Park. 2017. Physical controls of Southern Ocean deep-convection variability in CMIP5 models and the Kiel Climate Model. Geophys. Res. Lett., 44 (13), 6951-6958, doi:10.1002/2017GL074087.
Rigor, I.G., Wallace, J.M. and Colony, R.L. 2002. Response of sea ice to the Arctic Oscillation. Journal of Climate,15 (18), 2648-2663, doi:10.1175/1520-0442(2002)015<2648:ROSITT>2.0.CO;2.
Schlosser, E., Haumann, F. A., and Raphael, M. N. Atmospheric influences on the anomalous 2016 Antarctic sea ice decay. The Cryosphere Discuss., doi:10.5194/tc-2017-192, in review, 2017.

