Low Arctic sea ice extent for March caps a highly unusual winter in the Arctic, characterized by persistent warmth in the atmosphere that helped to limit ice growth. Above-average influx of ocean heat from the Atlantic and southerly winds helped to keep ice extent especially low in the Barents and Kara seas. Northern Hemisphere snow cover for both February and March was also unusually low
Overview of conditions
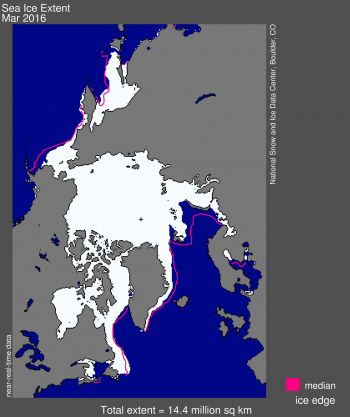
Figure 1. Arctic sea ice extent for March 2016 was 14.43 million square kilometers (5.57 million square miles). The magenta line shows the 1981 to 2010 median extent for that month. The black cross indicates the geographic North Pole. Sea Ice Index data. About the data
Credit: National Snow and Ice Data Center
High-resolution image
Sea ice extent reached its seasonal maximum on March 24 of 14.52 million square kilometers (5.607 million square miles), barely beating out February 25, 2015 for the lowest seasonal maximum in the satellite record. Arctic sea ice extent averaged for the entire month of March 2016 was 14.43 million square kilometers (5.57 million square miles), the second lowest in the satellite record. This is 1.09 million square kilometers (421,000 square miles) below the 1981 to 2010 average extent, and 40,000 square kilometers (15,000 square miles) above the record low monthly average for March that occurred in 2015. At the end of the month, extent remained well below average everywhere except in the Labrador Sea, Baffin Bay, and Hudson Bay. Ice extent was especially low in the Barents and Kara seas.
Conditions in context
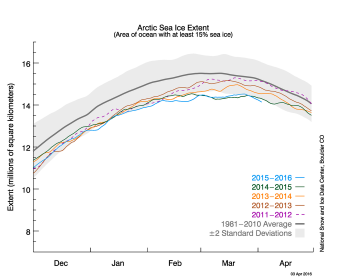
Figure 2. The graph above shows Arctic sea ice extent as of April 3, 2016, along with daily ice extent data for four previous years. 2015 to 2016 is shown in blue, 2014 to 2015 in green, 2013 to 2014 in orange, 2012 to 2013 in brown, and 2011 to 2012 in purple. The 1981 to 2010 average is in dark gray. The gray area around the average line shows the two standard deviation range of the data. Sea Ice Index data.
Credit: National Snow and Ice Data Center
High-resolution image
Because ice extent typically climbs through the first part of March until it reaches its seasonal maximum and then declines, the daily average ice growth rate for the month is typically quite small and is not a particularly meaningful number. This year’s seasonal maximum, while quite low, also occurred rather late in the month. Very early in the month, extent declined, raising anticipation that an early maximum had been reached. However, after a period of little change, extent slowly rose again, reaching the seasonal maximum on March 24.
March of 2016 saw unusually warm conditions over nearly all of the Arctic Ocean. Air temperatures at the 925 hPa level (about 3,000 feet above the surface) were typically 2 to 4 degrees Celsius (4 to 7 degrees Fahrenheit) above average over the Arctic coastal seas, with larger positive departures compared to average nearer the Pole (4 to 8 degrees Celsius or 7 to 14 degrees Fahrenheit). This was associated with a pattern of above-average sea level pressures centered over the northern Beaufort Sea north of Alaska, and below-average pressures over the Atlantic side of the Arctic, especially pronounced over Baffin Bay and Davis Strait. Through March, the Arctic Oscillation Index bounced between moderate positive and negative values.
March 2016 compared to previous years
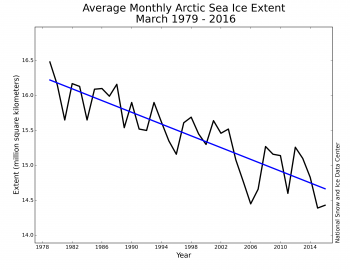
Figure 3. Monthly March ice extent for 1979 to 2016 shows a decline of 2.7 percent per decade.
Credit: National Snow and Ice Data Center
High-resolution image
Arctic sea ice extent averaged for March 2016 was the second lowest in the satellite record. Through 2016, the linear rate of decline for March extent is 2.7 percent per decade, or a decline of 42,100 square kilometers (16,200 square miles) per year.
The winter in review
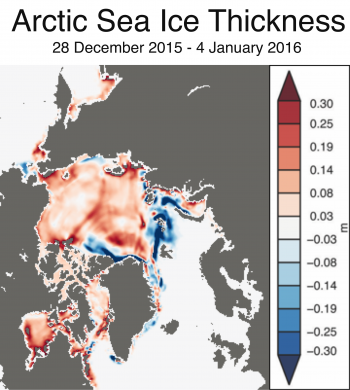
Figure 4. This graph shows differences in Arctic sea ice thickness from December 28, 2015 to January 4, 2016, estimated from the Pan-Arctic Ice Ocean Modeling and Assimilation System (PIOMAS).
Credit: National Snow and Ice Data Center, courtesy PIOMAS
High-resolution image
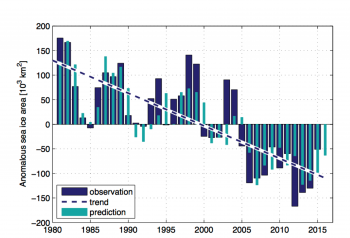
Figure 5. This figure shows observed (blue columns) and predicted (cyan) winter sea ice area in the Barents Sea. The prediction is based on observed Atlantic heat entering the Barents Sea and the sea ice area the previous year. The predicted sea ice area for this winter (2016) is well below average, and less than that observed for 2015. Anomalously strong southerly winds have also contributed to the very small sea ice area this winter (not shown).
Credit: Ingrid Onarheim/Bjerknes Centre for Climate Research
High-resolution image
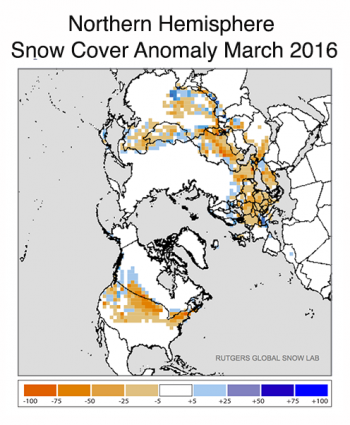
Figure 6. This snow cover anomaly map shows the percent difference between snow cover for March 2016, compared with average snow cover for March from 1981 to 2010. Areas in orange and red indicate lower than usual snow cover, while regions in blue had more snow than average.
Credit: National Snow and Ice Data Center, courtesy Rutgers University Global Snow Lab
High-resolution image
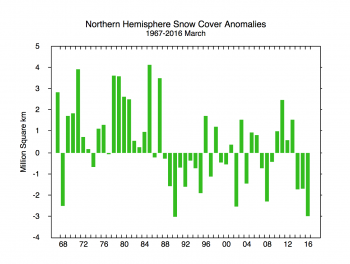
Figure 7. This graph shows snow cover extent anomalies in the Northern Hemisphere for March from 1967 to 2016. The anomaly is relative to the 1981 to 2010 average.
Credit: National Snow and Ice Data Center, courtesy Rutgers University Global Snow Lab
High-resolution image
The unusual warmth for March of 2016 continues a pattern of above-average temperatures for most of the Arctic and much of the Northern Hemisphere that has characterized the entire winter. As an exclamation point on the unusual warmth, there was a brief weather event at the very end of December 2015 when air temperatures near the Pole nearly reached the melting point. As we noted in our January post, the event was related to a pulse of warm air moving almost due south to north from the sub-tropical Atlantic to the regions north of Svalbard, an atmospheric river set between broad high and low pressure areas in Europe and the north Atlantic.
The December event also led to higher than average air temperatures over the Kara and Barents seas, reducing the sea ice concentration and causing thinning of the ice that was there. While sea ice normally grows and thickens over winter, the difference in thickness estimated from Pan-Arctic Ice Ocean Modeling and Assimilation System (PIOMAS) shows that between December 28, 2015 and January 4, 2016, sea ice within the Kara and Barents seas thinned by more than 30 centimeters (Figure 4). Thinning also occurred north of Greenland and off the coast of Siberia, while the ice thickened over most of the Arctic Ocean. Higher than average temperatures remained in the region after the weather event had passed, which may have further prevented the ice from growing back. The reasons for the persistent warmth over the entire Arctic this past winter are currently under investigation; a link with the strong El Niño pattern of this winter may be involved.
While the warm atmospheric conditions played a role in the low ice extent for March 2016, the especially low extent that has persisted in the Barents and Kara seas appears to be linked with another heat source—an influx of warm Atlantic waters, entering between Bear Island and Norway (the Barents Sea opening). Ingrid Onarheim from the Bjerknes Centre for Climate Research in Bergen, Norway has been studying this issue and predicted a small sea ice cover in the Barents Sea this winter based on observed Atlantic heat transport to the Barents Sea through April 2015 (Figure 5). In addition to the above-average ocean heat transport, prevailing southerly winds have pushed the sea ice northward since November 2015, bringing in warm air that damps the normally high ocean-air heat loss and favoring ice formation. This likely contributed to the below-average ice conditions in the Arctic this winter. Atlantic heat transport due to near-surface ocean currents reached a long-term maximum in the mid-2000s. Several studies have suggested a more moderate inflow of Atlantic waters may characterize the years ahead, leading to increases in the Barents Sea ice cover in the coming years.
Along with low sea ice extent and above-average temperatures, March of 2016 also saw a very low monthly snow cover extent for the Northern Hemisphere (Figures 6 and 7). Snow cover was low across northern Eurasia, with only minor areas of above-average snow cover in western Turkey, northern Kazakhstan and Mongolia, and easternmost High-Mountain Asia. In North America, snow cover was low across nearly all of the coterminous 48 states in the U.S., despite a series of storms late in the month in the central Rockies and Great Plains. Overall, March 2016 had 37.16 million square kilometers (14.35 million square miles) of snow cover extent, 2.97 million square kilometers (1.15 million square miles) below the 1981 to 2010 average of 40.13 million square kilometers (15.50 million square miles). This makes March 2016 the 49th lowest out of 50 years on record in snow cover extent for the Northern Hemisphere. While April and May could still bring snow to the higher latitudes, we note that low snow cover, similar to low sea ice cover, leads to greater heat absorption by the surface in the Arctic and further warming as we move toward summer.
A younger ice cover
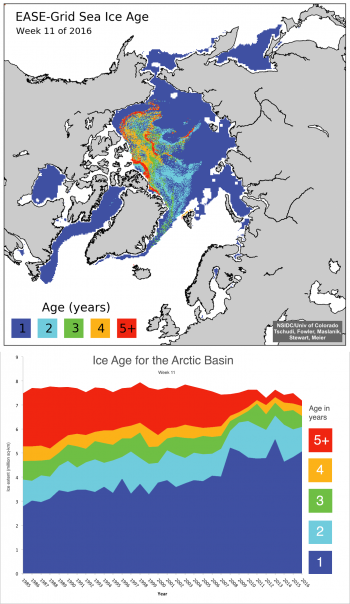
Figure 8. These graphs show Arctic sea ice age from March 4 to 10, 2016. The top graph shows ice age distribution for that week alone and the bottom graph shows ice age distribution for that week from 1985 to 2016.
Credit: NSIDC courtesy University of Colorado Boulder, M. Tschudi, C. Fowler, J. Maslanik, R. Stewart, W. Meier.
High-resolution image
Ice age data for mid-March shows that 70 percent of the sea ice within the Arctic basin consists of first-year ice and only 30 percent is multiyear ice. First-year ice is generally only 1.5 to 2 meters (5 to 6.5 feet) thick. This implies a thinner ice pack as the melt season gets underway. In addition, the oldest ice, or ice at least 5 years or older, is at its smallest level in the satellite record, representing only 3 percent of the total ice cover. Some of this very old ice is found in the western Beaufort Sea and extending towards the Chukchi Sea regions where we have seen large summer ice losses in recent years. Typically this old ice is concentrated north of Greenland and within the Canadian Arctic Archipelago.
Not only is the oldest ice at record low levels, but it it is not recovering. Beginning 2007, we see a strong decline that lasts until 2012 and has not changed much since. If anything it has gone down. In that time we have seen some recovery in younger multiyear ice types: e.g., 2-year ice jumped back up after a one-year minimum, 3-year ice recovered to a lesser degree, and 4-year ice to an even lesser degree. It is not surprising to see some recovery and that first-year ice recovery propagates through time. However, that recovery happens less as the ice gets older, and for 5-year ice and older there is essentially no recovery. The bottom line is that ice no longer survives in the Arctic for very long. It is lasting three to four years tops before melting or advecting out through Fram Strait. This is a big change from the past when much of the ice cover would survive upwards of a decade.
Southern view
Antarctic sea ice grew rapidly in March, rising from below-average daily extents to above-average extents during the month, and increasing by nearly 90,000 square kilometers (35,000 square miles) per day. Sea ice growth was particularly fast in the eastern Ross Sea. Winter temperatures on the continent through the month were near-average overall, but 4 to 6 degrees Celsius (7 to 11 degrees Fahrenheit) below average over the eastern Ross Sea and West Antarctic Ice Sheet.

