Arctic sea ice appears to have reached its annual maximum extent on March 24, and is now the lowest maximum in the satellite record, replacing last year’s record low. This year’s maximum extent occurred later than average. A late season surge in ice growth is still possible. NSIDC will post a detailed analysis of the 2015 to 2016 winter sea ice conditions in early April.
Overview of conditions

Figure 1. Arctic sea ice extent for March 24, 2016 was 14.52 million square kilometers (5.607 million square miles). The orange line shows the 1981 to 2010 median extent for that day. The black cross indicates the geographic North Pole. Sea Ice Index data. About the data
Credit: National Snow and Ice Data Center
High-resolution image
On March 24, 2016, Arctic sea ice likely reached its maximum extent for the year, at 14.52 million square kilometers (5.607 million square miles). This year’s maximum ice extent was the lowest in the satellite record, with below-average ice conditions everywhere except in the Labrador Sea, Baffin Bay, and Hudson Bay. The maximum extent is 1.12 million square kilometers (431,000 square miles) below the 1981 to 2010 average of 15.64 million square kilometers (6.04 million square miles) and 13,000 square kilometers (5,000 square miles) below the previous lowest maximum that occurred last year. This year’s maximum occurred twelve days later than the 1981 to 2010 average date of March 12. The date of the maximum has varied considerably over the years, occurring as early as February 24 in 1996 and as late as April 2 in 2010.
Conditions in context
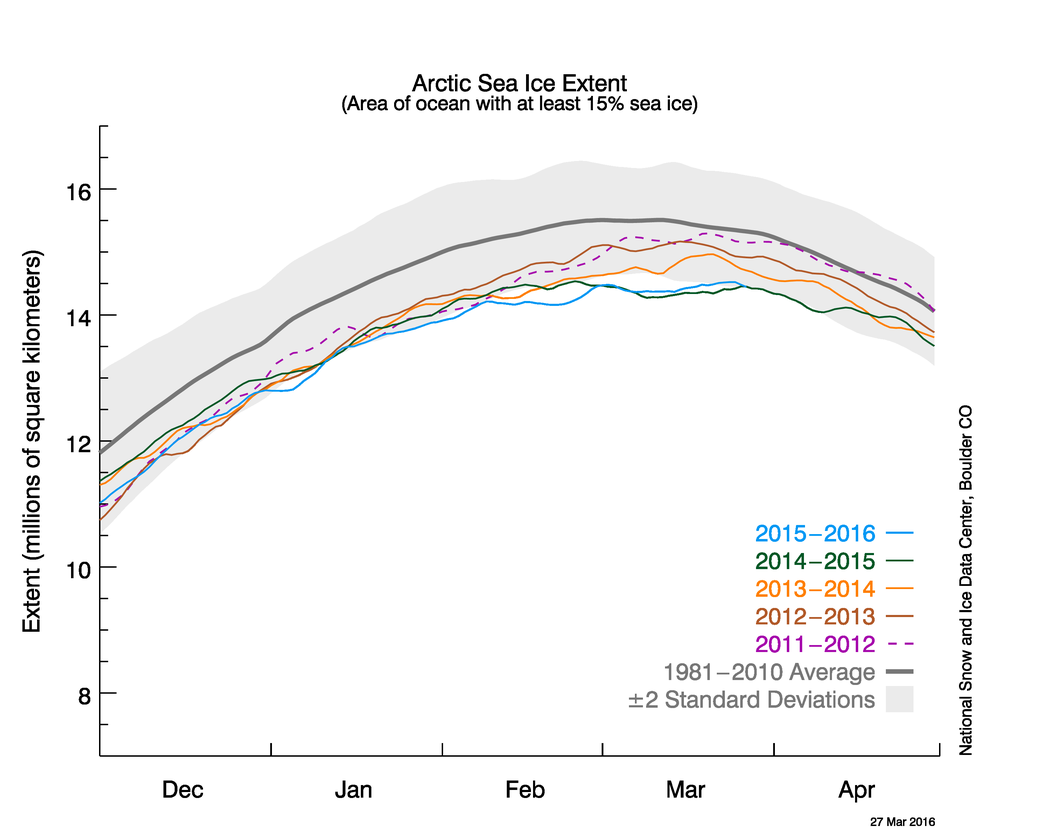
Figure 2. The graph above shows Arctic sea ice extent as of March 27, 2016, along with daily ice extent data for four previous years. 2015 to 2016 is shown in blue, 2014 to 2015 in green, 2013 to 2014 in orange, 2012 to 2013 in brown, and 2011 to 2012 in purple. The 1981 to 2010 average is in dark gray. The gray area around the average line shows the two standard deviation range of the data. Sea Ice Index data.
Credit: National Snow and Ice Data Center
High-resolution image
Sea ice extent was below average throughout the Arctic, except in the Labrador Sea, Baffin Bay, and Hudson Bay. However, it was especially low in the Barents Sea. Below average winter ice conditions in the Kara and Barents seas have been a persistent feature in the last several years, while the Bering Sea has overall seen slightly positive trends towards more sea ice during winter.
Below average sea ice extent is in part a result of higher than average temperatures that have plagued the Arctic all winter. Air temperatures at the 925 hPa level from December 2015 through February 2016 were above average everywhere in the Arctic, with hotspots near the Pole and from the Kara Sea towards Svalbard exceeding 6 Celsius degrees (11 degrees Fahrenheit) above average. These higher than average temperatures continued into March, with air temperatures during the first two weeks reaching 6 degrees Celsius (11 degrees Fahrenheit) above average in a region stretching across the North Pole toward northern Greenland, and up to 12 degrees Celsius (22 degrees Fahrenheit) above average north of Svalbard.
These unusually warm conditions have no doubt played a role in the record low ice extent this winter. Another contributing factor has been a predominance of southerly winds in the Kara and Barents seas that have helped to keep the ice edge northward of its typical position. This area has also seen an influx of warm Atlantic waters from the Norwegian Sea.
There is little correlation between the maximum winter extent and the minimum summer extent—this low maximum does not ensure that this summer will see record low ice conditions. A key factor is the timing of widespread surface melting in the high Arctic. An earlier melt onset is important to the amount of energy absorbed by the ice cover during the summer. If surface melting starts earlier than average, the snow darkens and exposes the ice below earlier, which in turn increases the solar heat input, allowing more ice to melt. With the likelihood that much of the Arctic cover is somewhat thinner due to the warm winter, early surface melting would favor reduced summer ice cover.
Final analysis pending
At the beginning of April, NSIDC scientists will release a full analysis of winter conditions, along with monthly data for March. For more information about the maximum extent and what it means, see the NSIDC Icelights post, the Arctic sea ice maximum.

