Antarctic sea ice appears to have reached its annual maximum extent on October 6. The maximum occurred relatively late compared to past years. In contrast to the past three years, the 2015 maximum did not set a new record high for the period of satellite observations, but was nevertheless slightly above the 1981 to 2010 average.
Overview of conditions
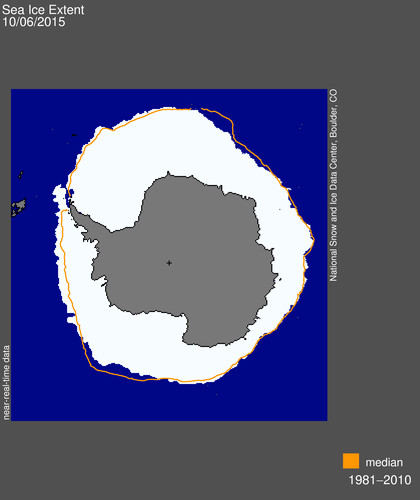
Figure 1. Antarctic sea ice extent for October 6, 2015 was 18.83 million square kilometers (7.24 million square miles). The orange line shows the 1981 to 2010 median extent for that day. The black cross indicates the geographic South Pole. Sea Ice Index data. About the data
Credit: National Snow and Ice Data Center
High-resolution image
Antarctic sea ice extent reached its likely maximum for the year, at 18.83 million square kilometers (7.24 million square miles) on October 6, 2015. This year’s maximum was the sixteenth highest in the 35-year record. It was 120,000 square kilometers (46,000 square miles) above the average maximum daily extent computed over the 1981 to 2010 period of 18.71 million square kilometers (7.19 million square miles), and 1.33 million square kilometers (514,000 square miles) below the record maximum set in 2014. The date of the maximum was quite late in comparison to the 35-year satellite record. Only one year, 2002, has had a later maximum (October 12).
At the date of the 2015 maximum, Antarctic sea ice extent was greater than average in the Antarctic Peninsula region, the Weddell Sea, and the Wilkes Land coast area; and below average in the Ross Sea and Indian Ocean sectors.
Conditions in context
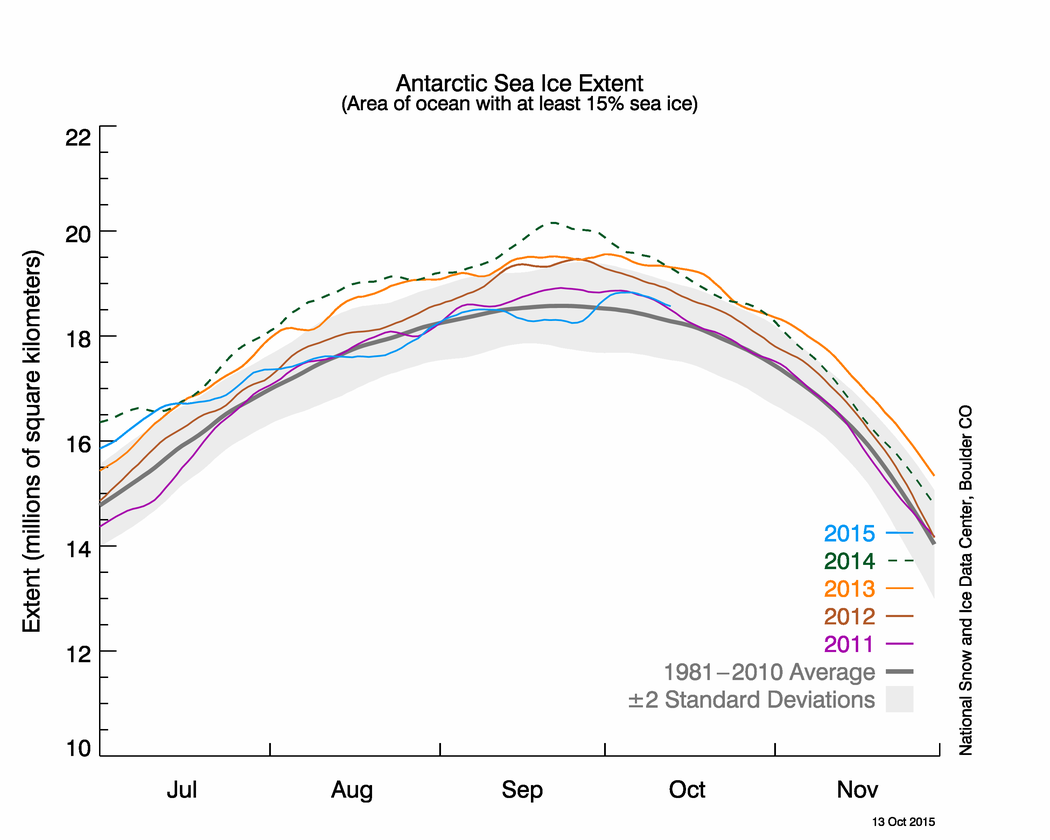
Figure 2. The graph above shows Antarctic sea ice extent as of October 13, 2015, along with daily ice extent data for four previous years. 2015 is shown in blue, 2014 in green, 2014 in orange, 2012 in brown, and 2011 in purple. The 1981 to 2010 average is in dark gray. The gray area around the average line shows the two standard deviation range of the data. Sea Ice Index data.
Credit: National Snow and Ice Data Center
High-resolution image
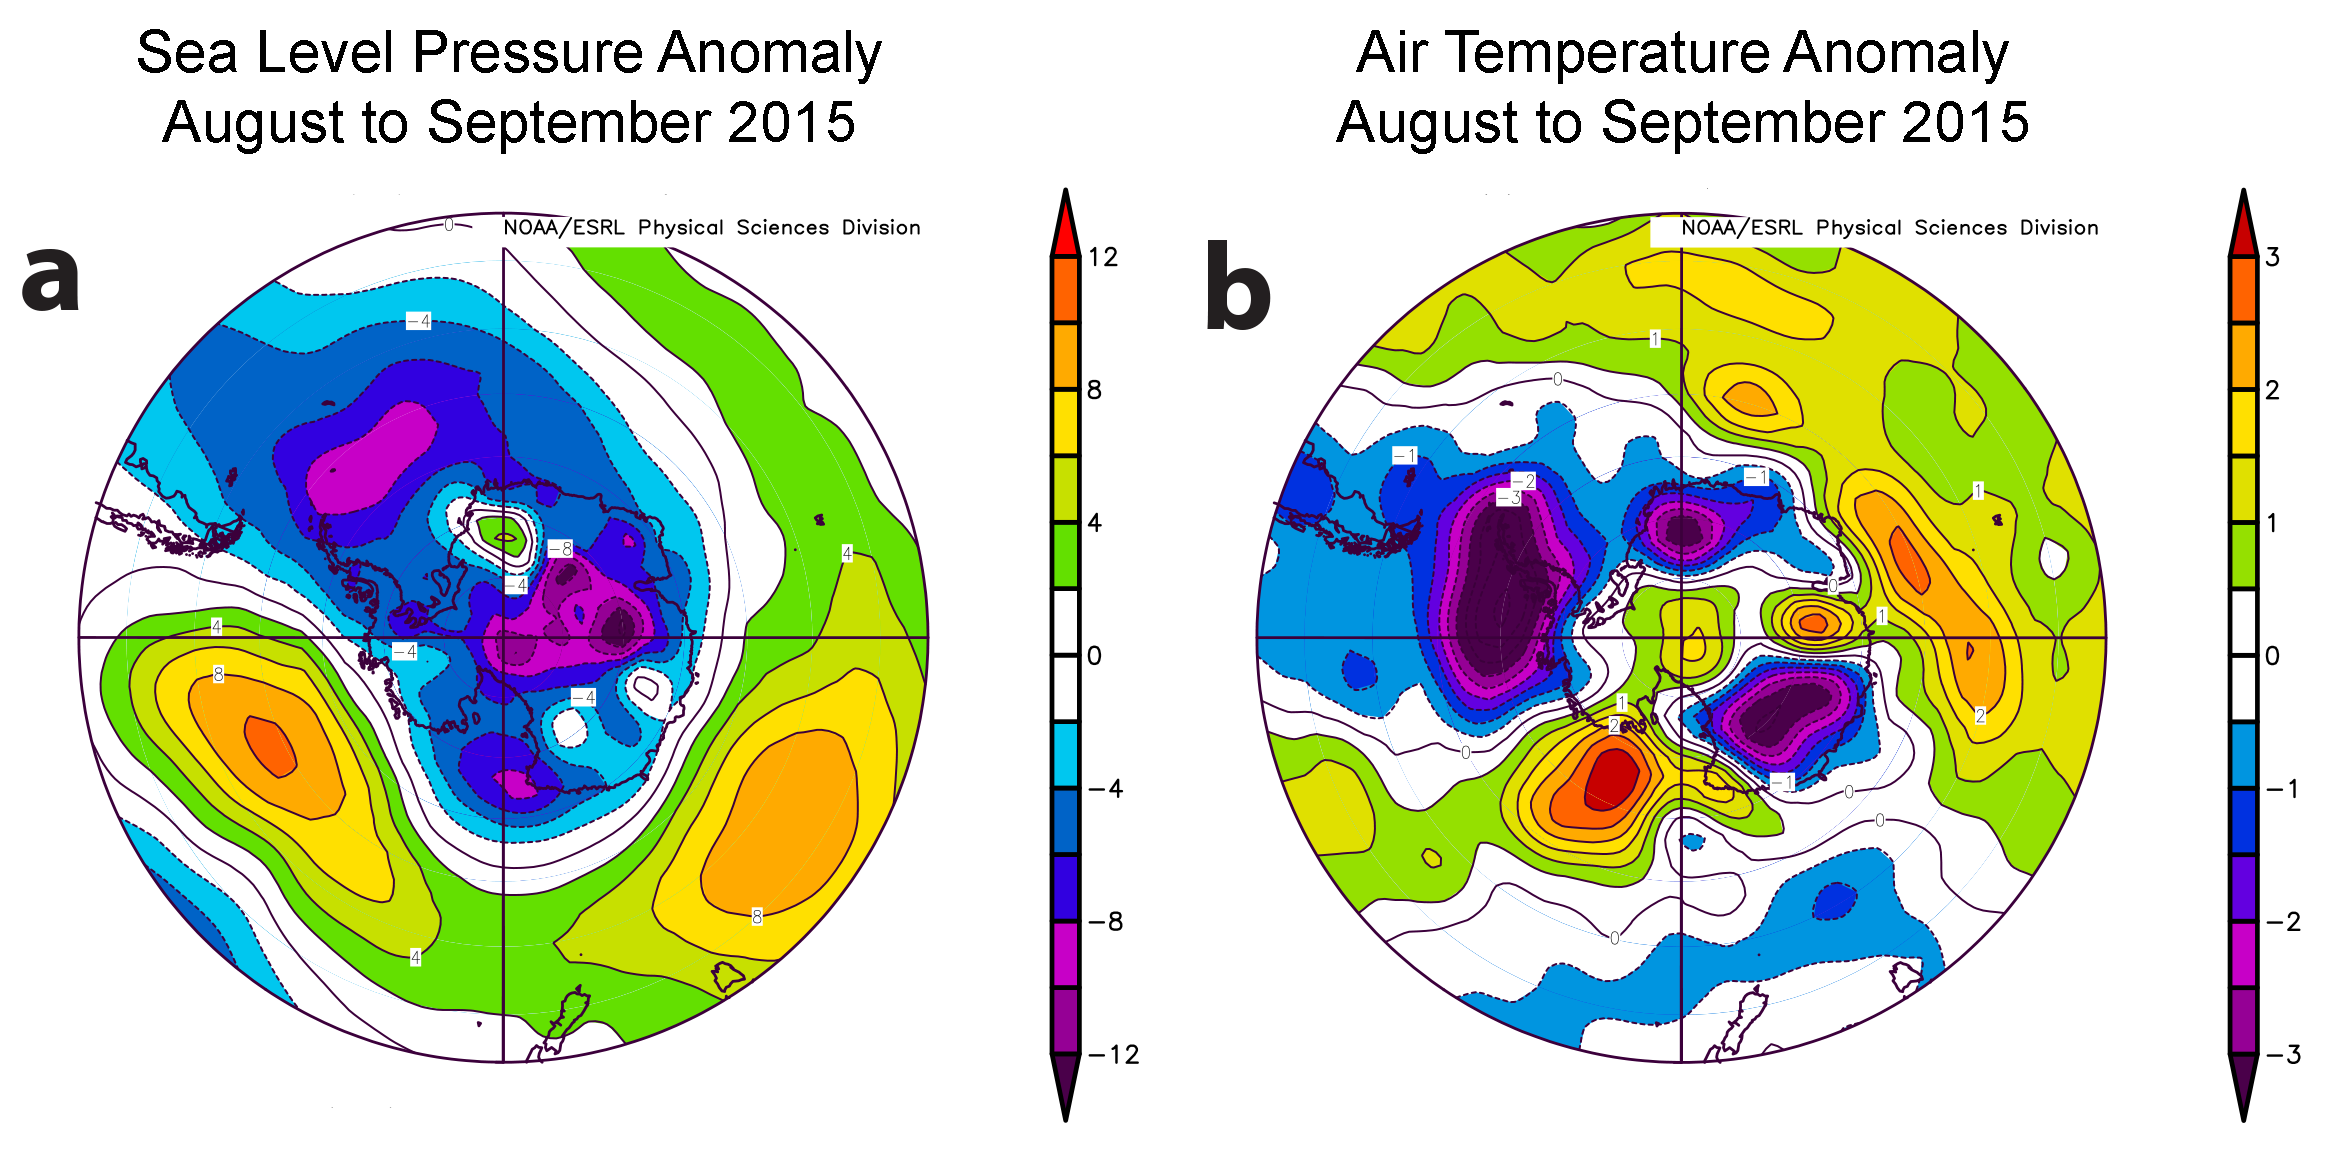
Figure 3. Panel (a) shows sea level air pressure anomaly for the Southern Ocean region, August 1 to September 30, 2015. Panel (b) shows air temperature anomaly for the Southern Ocean region, August 1 to September 30, at the 925 millibar level (approximately 1,600 feet altitude).
Credit: NOAA ESRL Physical Sciences Division
High-resolution image
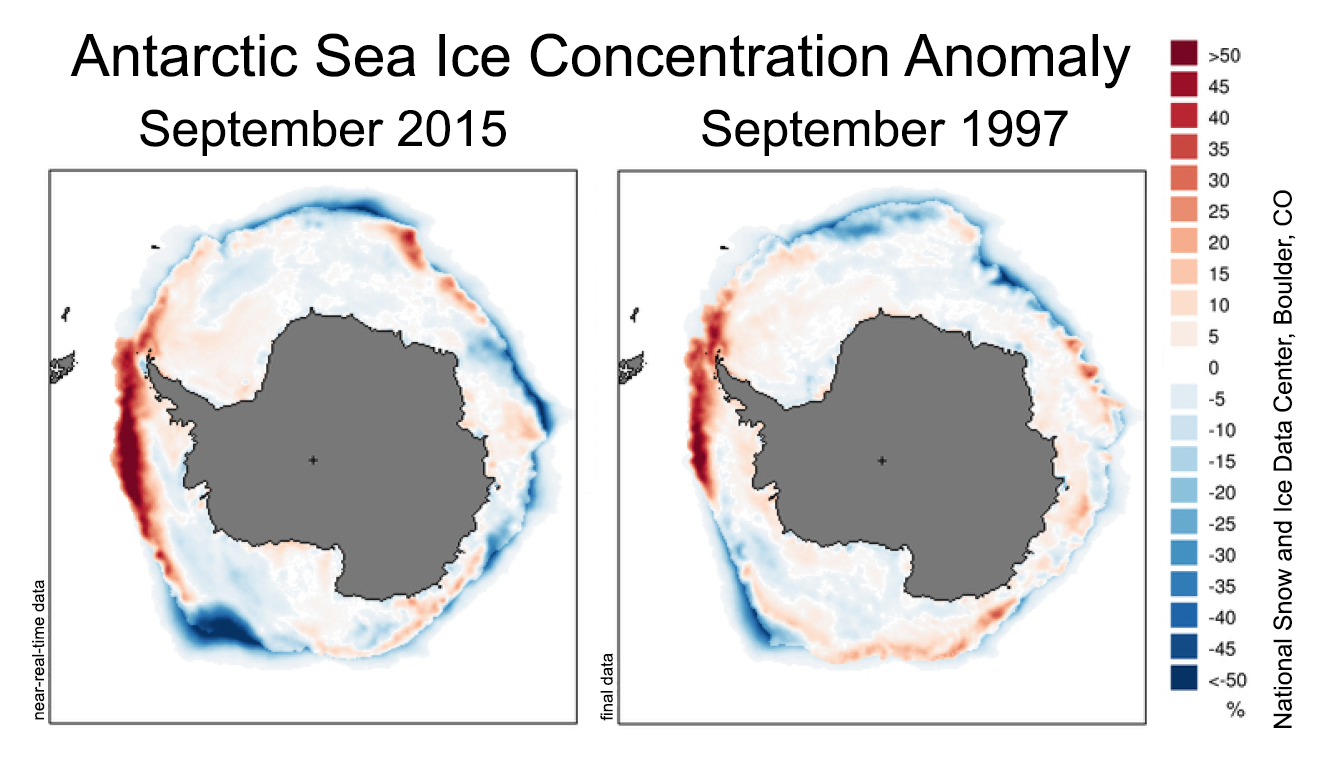
Figure 4. The images compare Antarctic sea ice concentration for Septembers during two strong El Niño events (2015, left; 1997, right) to 1981 to 2010 averages. Colors show percent difference from average sea ice concentration surrounding Antarctica. Oranges and reds indicate concentrations higher than average; greens and blues indicate concentrations lower than average.
Credit: National Snow and Ice Data Center
High-resolution image
As recently as July 12, Antarctic sea ice extent was at a record daily high extent for the satellite period of observations. For much of early 2015, Antarctic sea ice extent was either slightly above or slightly below the levels seen on the same date in 2014, the record high year. However, beginning in mid-July, the growth rate for Antarctic sea ice slowed significantly, causing the 2015 maximum extent to be only the sixteenth highest in the record.
It is likely that this slowing of late-winter ice growth is related in part to the build-up of the El Niño conditions. El Niño occurs when a large area of the surface waters in the tropical eastern Pacific Ocean warms, and it has widespread effects on weather patterns. In the Southern Ocean, El Niño conditions are typically associated with a weakening of the Amundsen Sea Low, a persistent region of low air pressure in the southernmost Pacific sector of the Antarctic coast (Raphael et al., 2015). Air pressure in the Amundsen Sea region for the months of August and September was higher than average, indicating a weakening of the low-pressure tendency in the region. Higher-than-average air pressure was also observed in the Indian Ocean sector. These regions saw reduced sea ice growth and even local sea ice retreat as the austral winter progressed, and areas of higher-than-average temperatures near the ice edge.
Patterns of sea ice concentration around Antarctica (the deviation from average ice concentration) for El Niño years show a similar pattern, with more ice near the Peninsula.
References
Raphael, M. N., G. J. Marshall, J. Turner, R. Fogt, D. Schneider, D. A. Dixon, J. S. Hosking, J. M. Jones, and W. R. Hobbs. 2015. The Amundsen Sea Low: Variability, change and impact on Antarctic climate. Bulletin of the American Meteorological Society 2015, doi:10.1175/BAMS-D-14-00018.1.

