August saw a remarkably steady decline in Arctic sea ice extent, at a rate slightly faster than the long-term average. Forecasts show that this year’s minimum sea ice extent, which typically occurs in mid to late September, is likely to be the third or fourth lowest in the satellite record. All four of the lowest extents have occurred since 2007. In mid-August, Antarctic sea ice extent began to trend below the 1981 to 2010 average for the first time since November 2011.
Overview of conditions

Figure 1. Arctic sea ice extent for August 2015 was 5.61 million square kilometers (2.16 million square miles). The magenta line shows the 1981 to 2010 median extent for that month. The black cross indicates the geographic North Pole. Sea Ice Index data. About the data
Credit: National Snow and Ice Data Center
High-resolution image
Average sea ice extent for August 2015 was 5.61 million square kilometers (2.16 million square miles), the fourth lowest August extent in the satellite record. This is 1.61 million square kilometers (621,000 square miles) below the 1981 to 2010 average for the month, and 900,000 square kilometers (350,000 square miles) above the record low for August, set in 2012.
The rapid pace of daily ice loss seen in late July 2015 slowed somewhat in August. The pace increased slightly toward the end of the month, so that by August 31 Arctic sea ice extent was only slightly greater than on the same date in 2007 and 2011. The ice is currently tracking lower than two standard deviations below the 1981 to 2010 long-term average.
Sea ice extent remains below average in nearly every sector except for Baffin Bay and Hudson Bay, where some ice persists in sheltered coastal areas. A striking feature of the late 2015 melt season are the extensive regions of low-concentration ice (less than 70% ice cover) in the Beaufort Sea. A few patches of multi-year sea ice surrounded by open water remain in the central Beaufort Sea.
Conditions in context
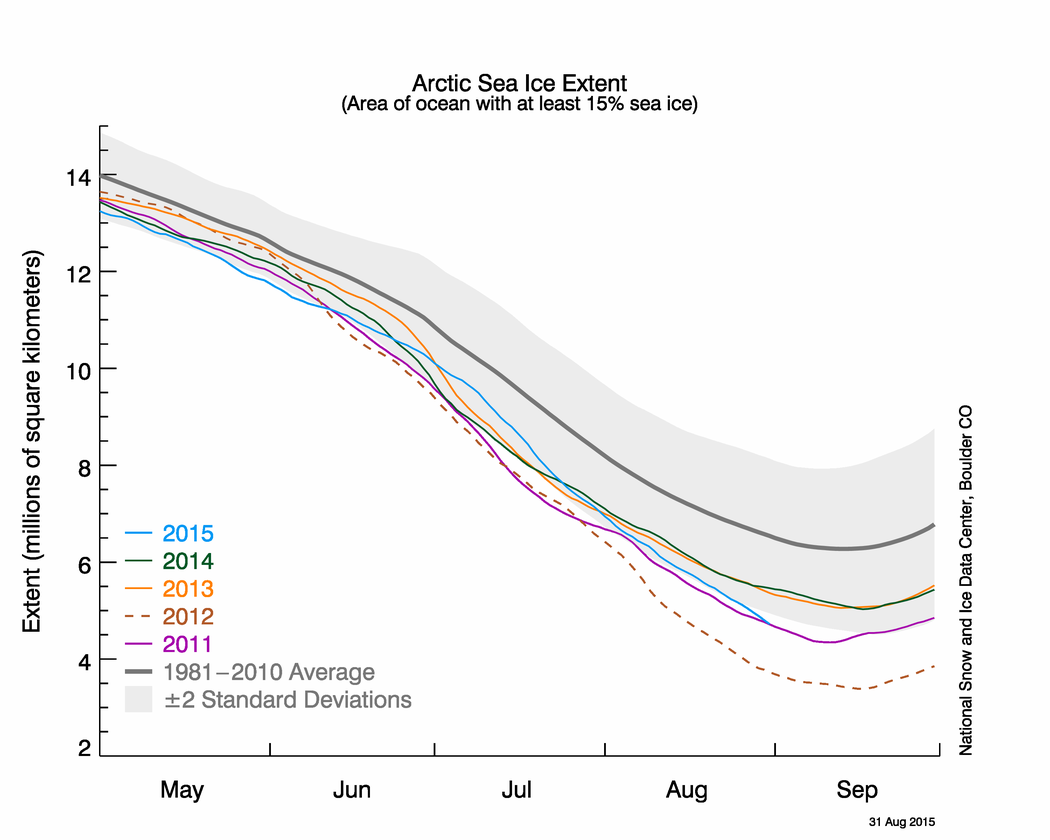
Figure 2. The graph above shows Arctic sea ice extent as of August 31, 2015, along with daily ice extent data for four previous years. 2015 is shown in blue, 2014 in green, 2013 in orange, 2012 in brown, and 2011 in purple. The 1981 to 2010 average is in dark gray. The gray area around the average line shows the two standard deviation range of the data. Sea Ice Index data.
Credit: National Snow and Ice Data Center
High-resolution image
Ice loss rates were quite steady through most of the month of August. Sea ice loss for August averaged 75,100 square kilometers per day (29,000 square miles), compared to the long-term 1981 to 2010 average value of 57,300 square kilometers per day (22,100 square miles per day), and a rate of 89,500 square kilometers per day for 2012 (34,500 square miles per day).
Cool conditions prevailed in the East Siberian, Chukchi, and western Beaufort seas, where air temperatures at the 925 millibar level were 1.5 to 2.5 degrees Celsius (3 to 5 degrees Fahrenheit) below average. However, a broad region of higher-than-average temperatures extended from Norway to the North Pole, 1.5 to 2.5 degrees Celsius (3 to 5 degrees Fahrenheit) above average. Sea level pressures were up to 10 millibars above average over the central Arctic Ocean, paired with slightly below average values in north-central Siberia, similar to the dipole-like pattern seen for July. The Arctic Oscillation was in its negative phase for most of the month, again similar to July.
August 2015 compared to previous years
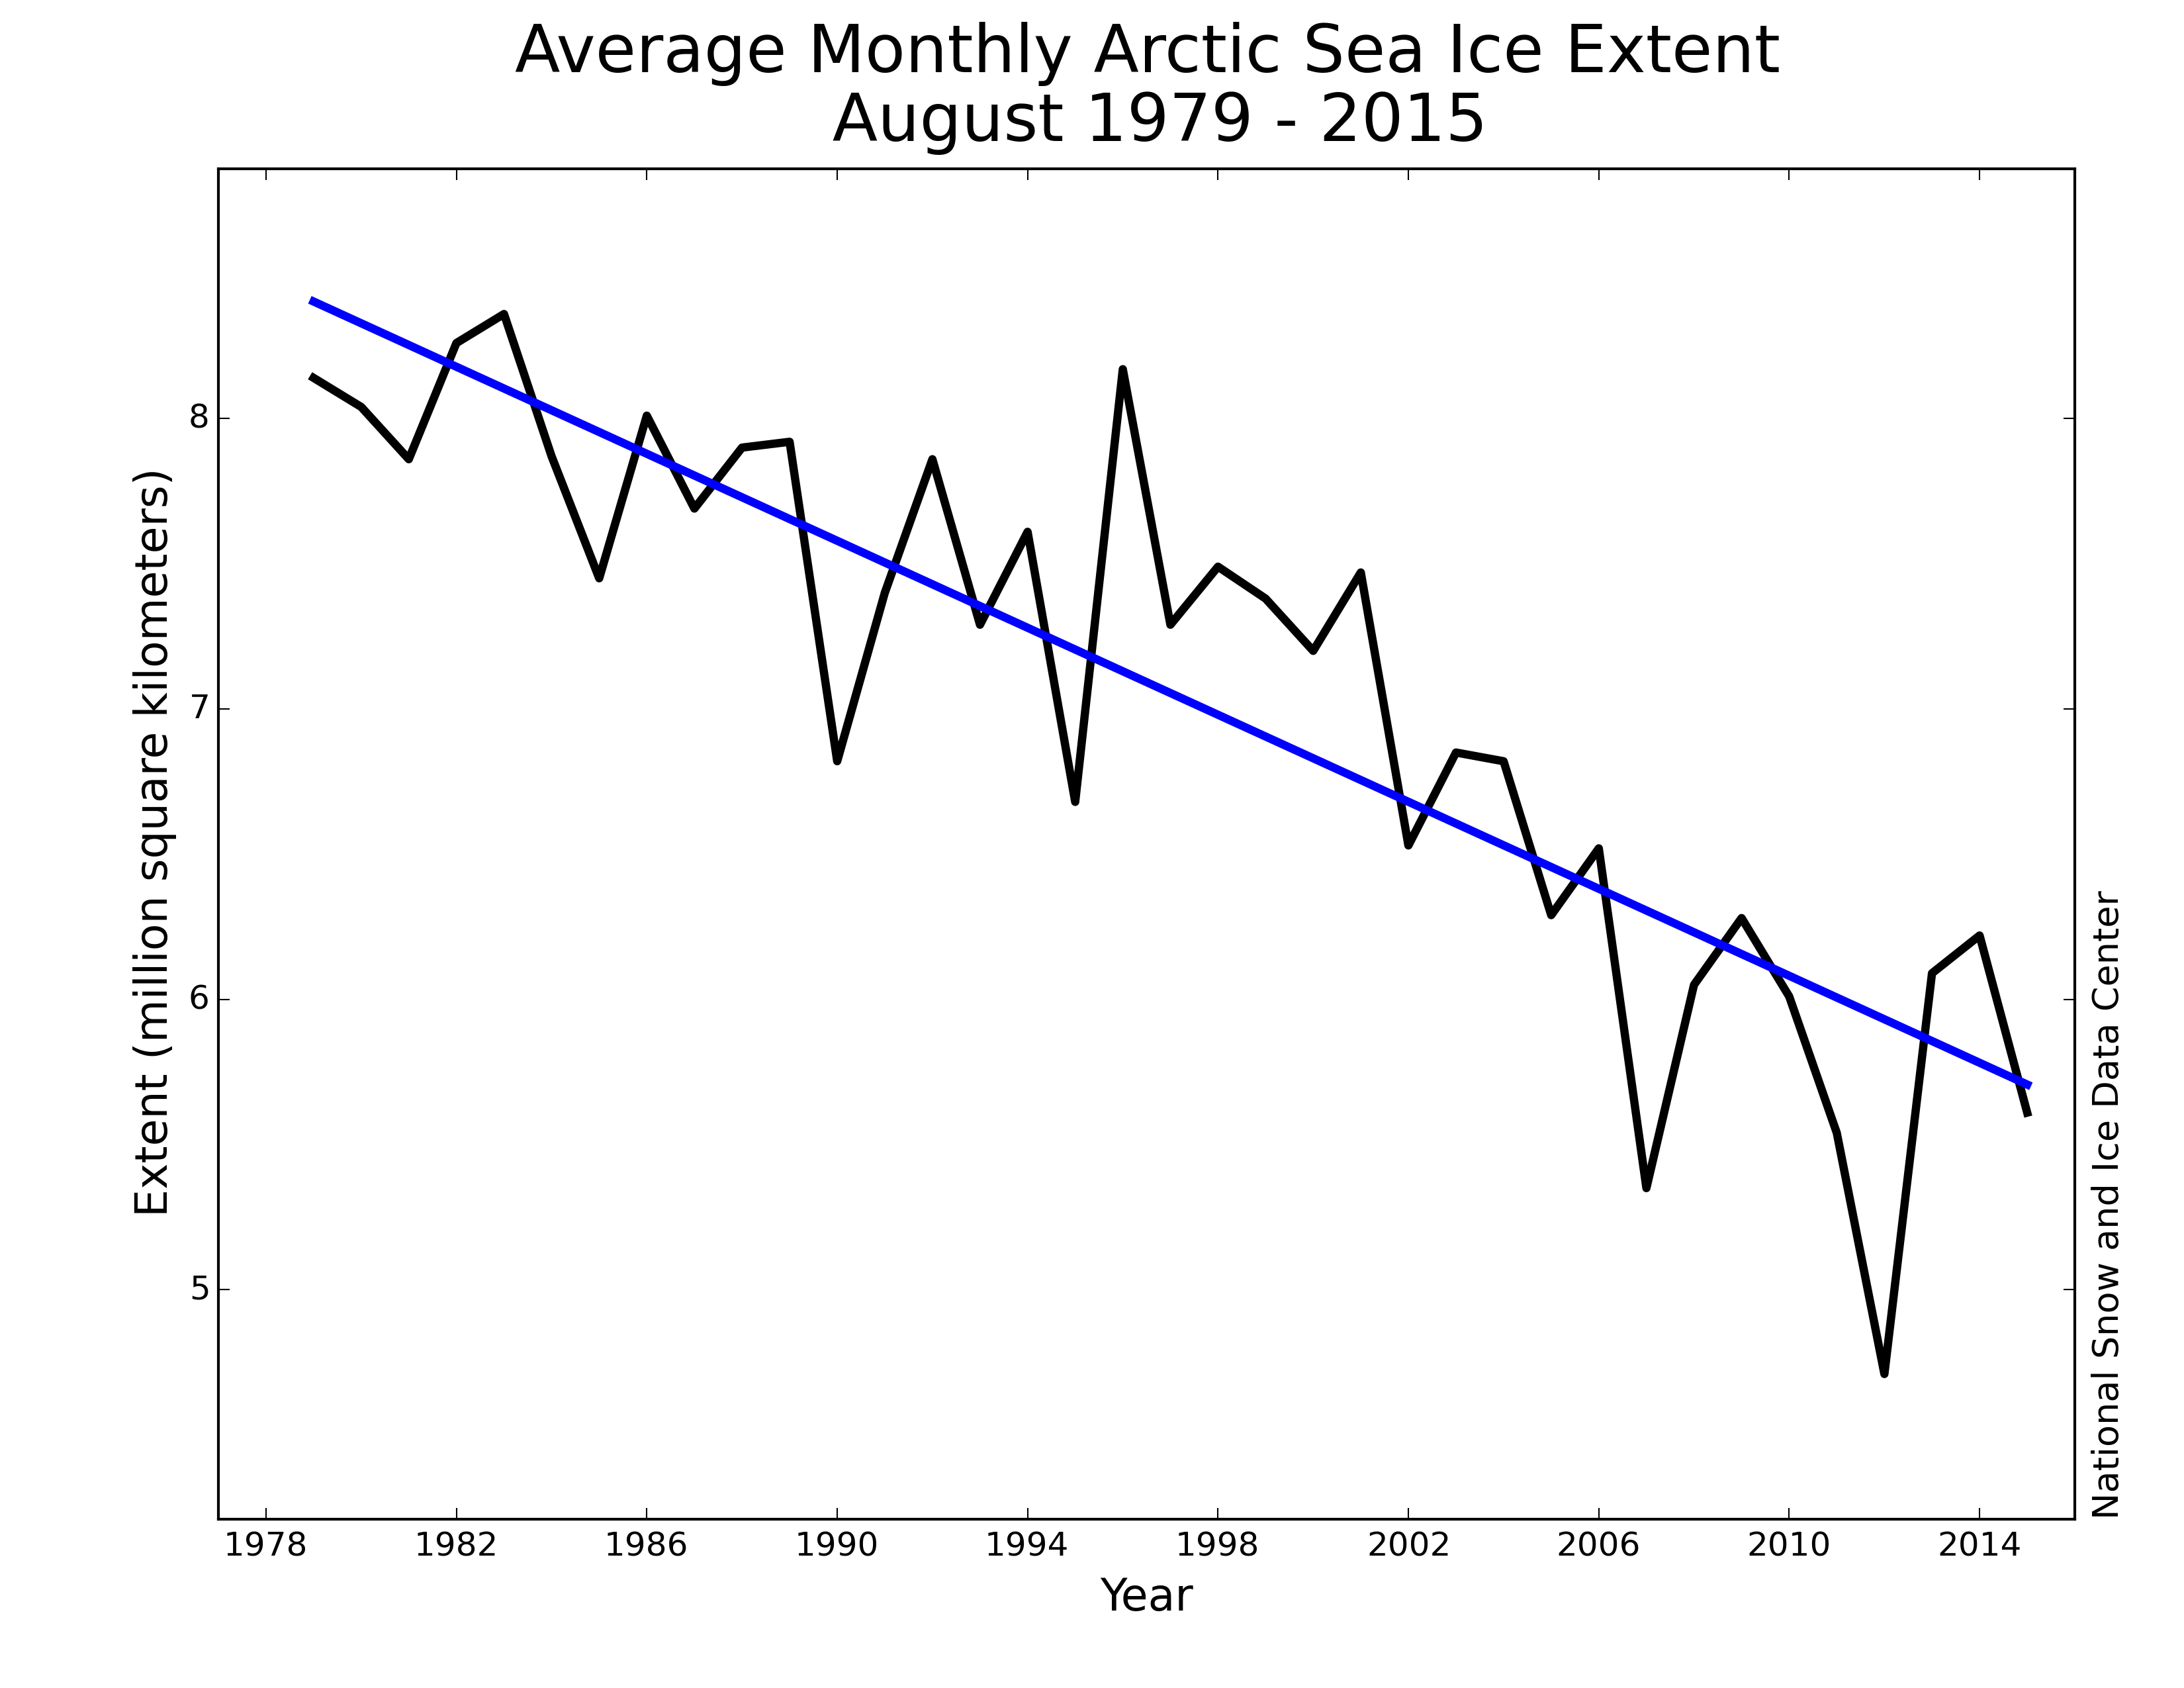
Figure 3. Monthly August ice extent for 1979 to 2015 shows a decline of 10.3% per decade.
Credit: National Snow and Ice Data Center
High-resolution image
Arctic sea ice extent averaged for August 2015 was the fourth lowest in the satellite data record. Through 2015, the linear rate of decline for August extent is 10.3% per decade.
Forecasting the minimum

Figure 4. The graph shows ice extent forecasts, based on ice extent as observed on August 31, 2015 and past years’ observed rates for selected years.
Credit: W. Meier, NASA Goddard Cryospheric Sciences Lab
High-resolution image
One way of estimating the upcoming seasonal minimum in ice extent is to extrapolate from the current extent, using previous years’ rates of daily sea ice loss. Assuming that past years’ daily rates of change indicate the range of ice loss that can be expected this year, this method gives an envelope of possible minimum extents for the September seasonal minimum. However, it is possible to have unprecedented loss rates, either slow or fast.
Starting with the ice extent observed on August 31 and then applying 2006 loss rates, the slowest rate in recent years, results in the highest extrapolated minimum for 2015 of 4.50 million square kilometers (1.74 million square miles), and a September monthly average extent of 4.59 million square kilometers (1.77 million square miles). The lowest daily minimum comes from using the 2010 pace, yielding an estimated 4.12 million square kilometers (1.67 million square miles) for the daily minimum, and a September monthly average extent of 4.33 million square kilometers (1.67 million square miles).
Using an average rate of ice loss from the most recent ten years gives a one-day minimum extent of 4.38 ± 0.11 million square kilometers (1.79 million square miles), and a September monthly average of 4.49 ± 0.09. As of August 31, the 5-day running daily average extent is 4.72 million square kilometers. If no further retreat occurred, 2015 would already be the sixth lowest daily ice extent in the satellite record.
The forecast places the upcoming daily sea ice minimum between third and fourth lowest, with fourth more likely. There is still a possibility that 2015 extent will be lower than 4.3 million square kilometers, the third lowest sea ice extent, surpassing the 2011 sea ice extent minimum, and a small chance of surpassing 2007, resulting in the second-lowest daily minimum. This assumes that we continue to have sea ice loss rates at least as fast as those of 2010. This was indeed the case for the final ten days of August 2015.
Northwest Passage icy; Northern Sea Route remains open

Figure 5. Click on the image to view an animation of sea ice concentration north of Canada for August 23 to September 1, 2015.
Credit: Canadian Ice Service Daily and Regional Ice Charts
High-resolution image
The southerly route through the Northwest Passage is open. The passage was discovered during 1903 to 1906 by Roald Amundsen, who made the first transit of the passage from Baffin Bay to the Beaufort Sea. This route passes south of Prince of Wales Island and Victoria Island before entering the Beaufort Sea south of Banks Island. Data from the AMSR-2 satellite, which uses passive microwave emission, suggests that this path is ice-free. The higher-resolution Multisensor Analyzed Sea Ice Extent (MASIE) product, based on several data sources and human interpretation, shows only a few areas of low-concentration ice. The broader and deeper passage through the Canadian Arctic Archipelago, between Lancaster Sound, Parry Channel, and McClure Strait, is still obstructed by ice, but at the end of August ice blocked only a short portion near Victoria Island. Before drawing conclusions about navigability, however, it is important to check with the operational services such as the National Ice Center (NIC) or the Canadian Ice Service (CIS). The Northern Sea Route, north of the European Russian and Siberian coasts, has remained largely clear of ice for the entire month.
Warm surface water near Alaska and the Kara Sea
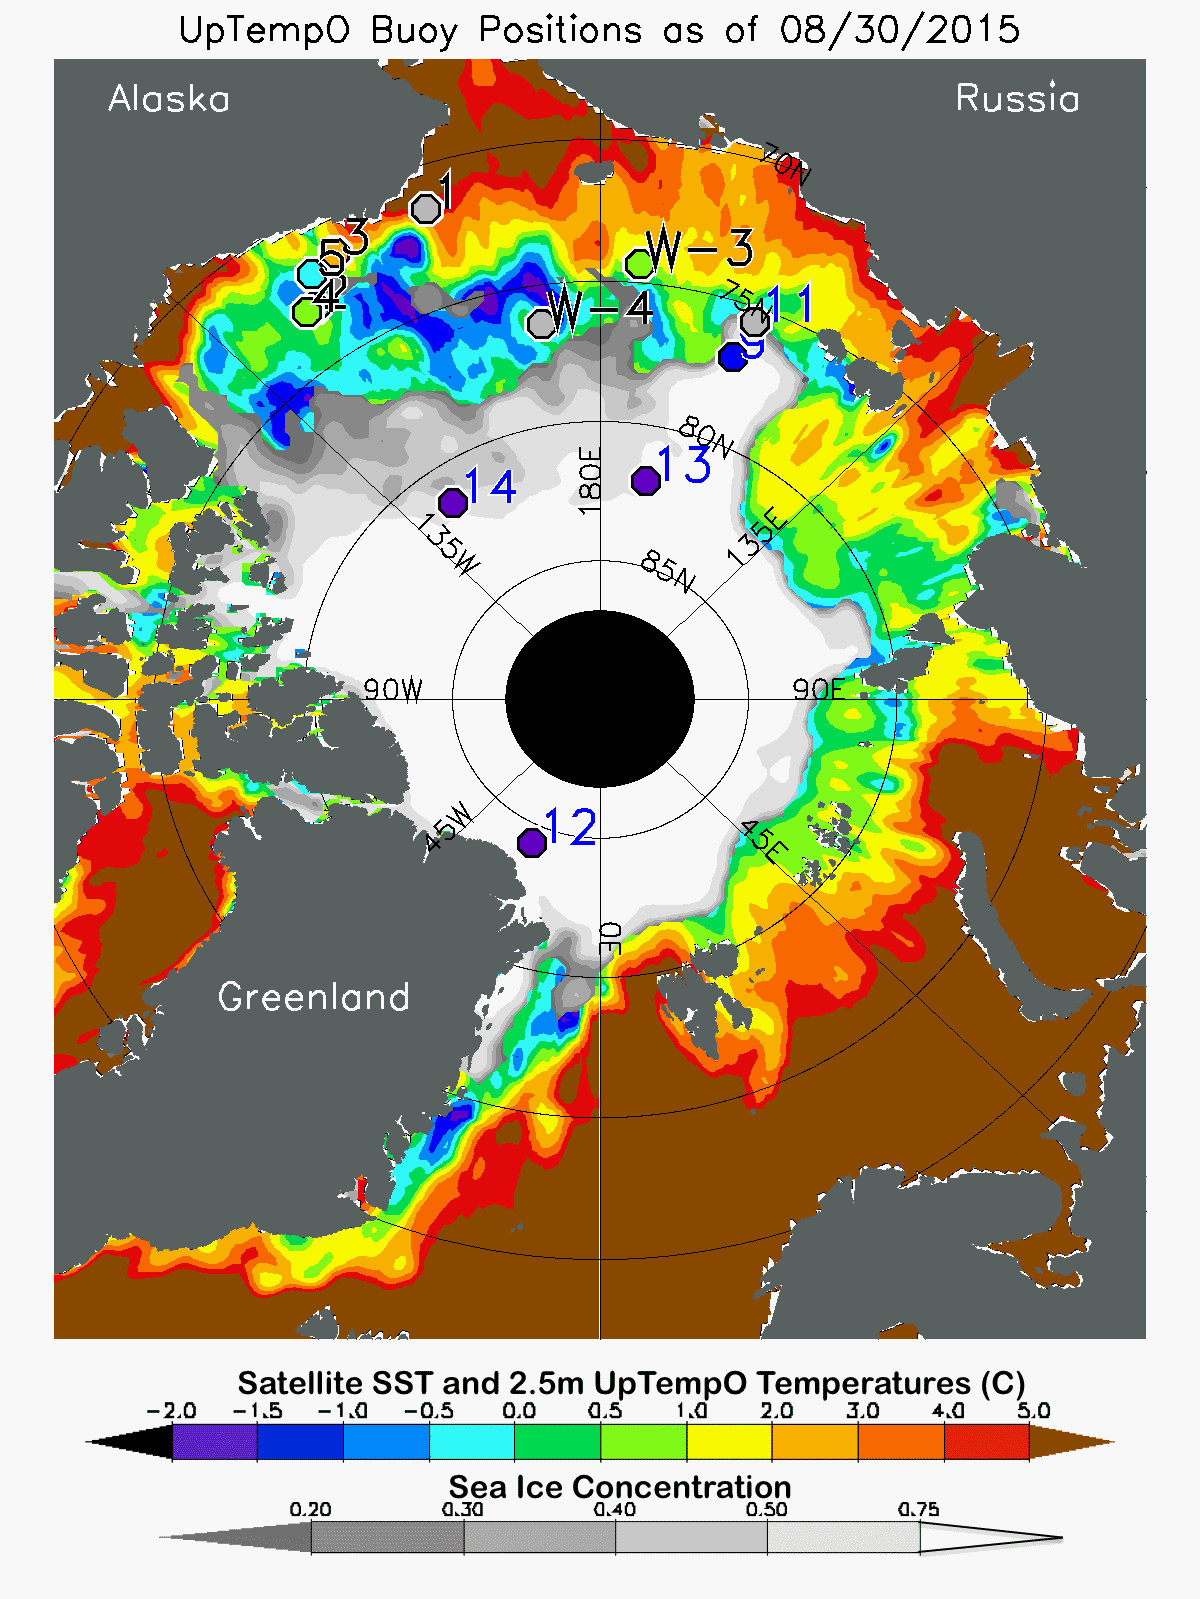
Figure 6. The map shows average ocean sea surface temperature (SST) and sea ice concentration for August 30, 2015. SST is measured by satellites using thermal emission sensors (a global product, adjusted by comparison with ship and buoy data). Sea ice concentration is derived from NSIDC’s sea ice concentration near-real-time product. Also shown are drifting buoy temperatures at 2.5 meters depth in the ocean (about 8 feet deep: colored circles); gray circles indicates that temperature data from the buoys is not available.
Credit: M. Steele, Polar Science Center/University of Washington
High-resolution image
Strong winds from the east in spring of this year opened the ice pack in the eastern Beaufort Sea quite early, allowing early warming of the ocean surface. However, the winds shifted in later spring, forcing the warmed water layer against the North American mainland rather than dispersing it further into the Arctic Ocean. Sea surface temperatures (SSTs) were high as of late August 2015 in the Beaufort, Chukchi, and Laptev Seas, as well as in Baffin Bay and the Kara and northern Barents seas.
The remaining area of low concentration ice in the Beaufort Sea has large pockets of warming open water. This area is likely to melt out by the September ice minimum; however, maximum SSTs in this region will probably not be especially high (currently about 2.5 degrees Celsius, or 5 degrees Fahrenheit above the freezing point of seawater) owing to how late we are in the melt season.
NASA airborne mission flies over sea ice in 2015 to support ICESat-2
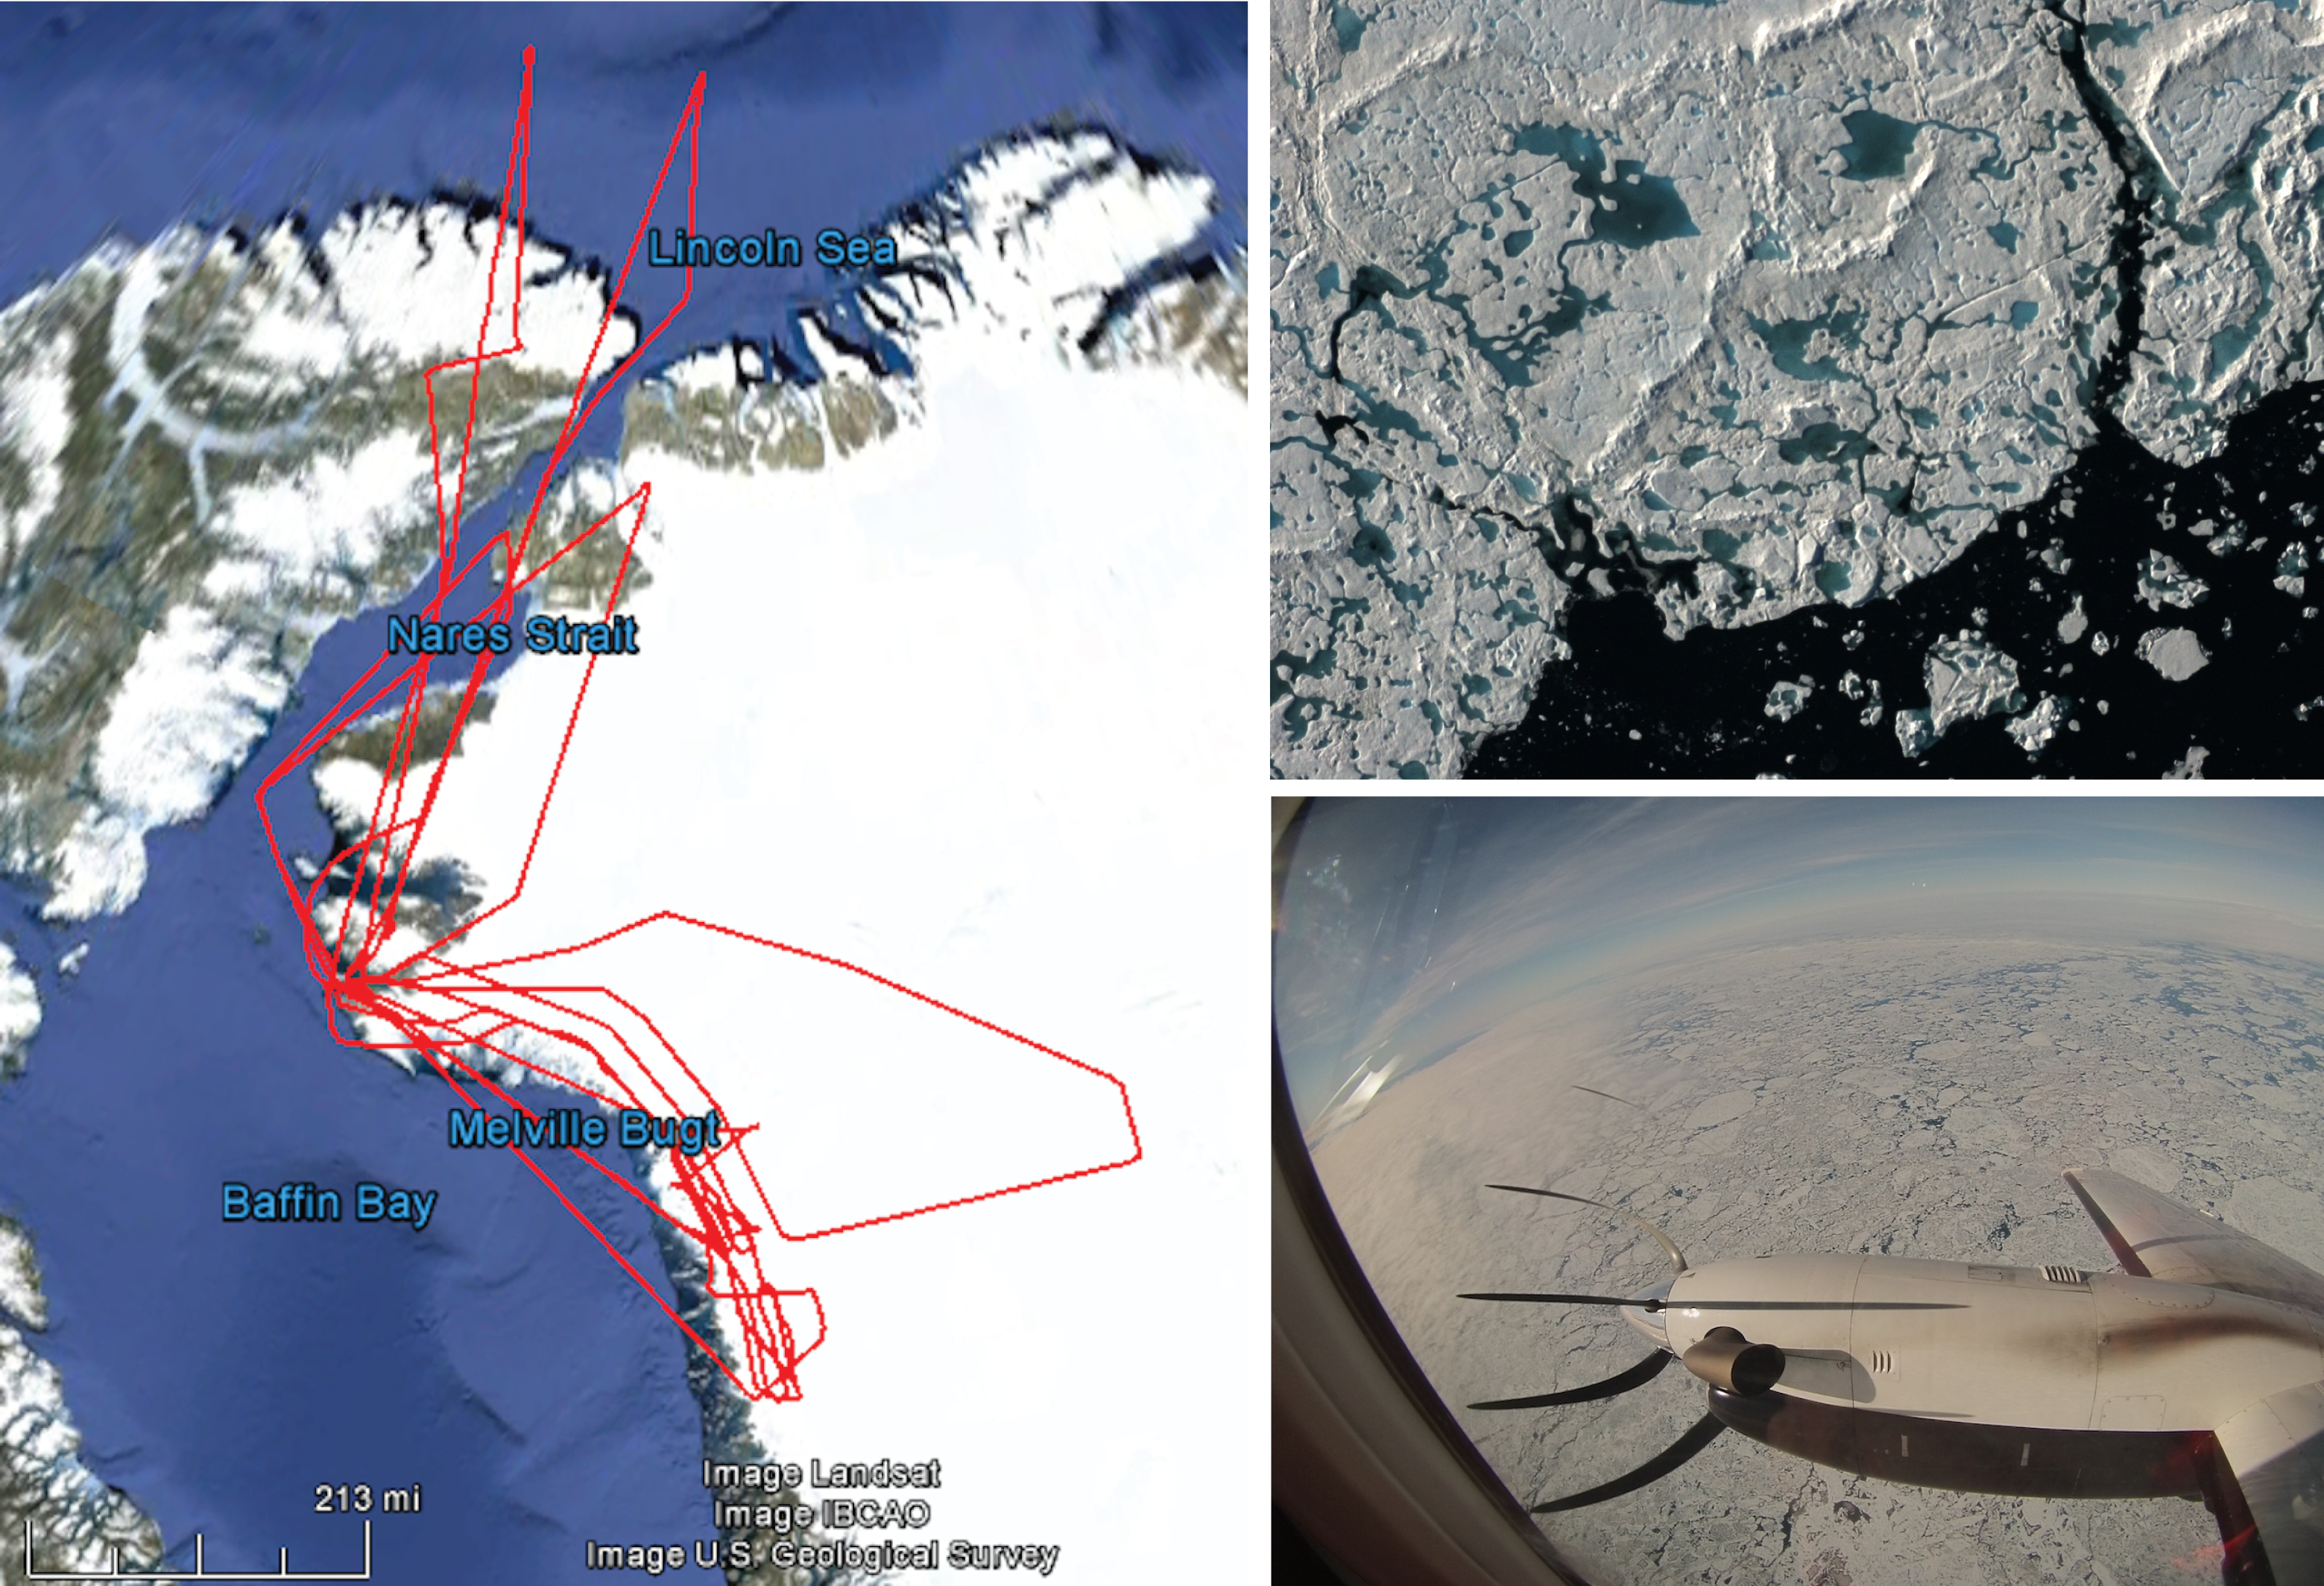
Figure 7. The map at left shows flight tracks flown by NASA to evaluate laser reflection characteristics over sea ice and land ice. The image at top right shows sea ice with melt ponds in the Lincoln Sea. The photo at bottom right shows the view from the aircraft window of moderately loose pack in the area.
Credit: K. Brunt/NASA
High-resolution image
In support of the upcoming Ice, Cloud, and land Elevation Satellite-2 (ICESat-2) mission, NASA recently deployed two instrumented aircraft to Thule Air Force Base, Greenland (near Qaanaaq) to collect data for the development of software to process the satellite data. Instrumentation for the three-week campaign (July 28 to August 19) included a laser altimeter called SIMPL and an imaging spectrometer called AVIRIS-NG. ICESat-2 is a satellite-borne laser altimetry mission that uses a new approach to space-borne determination of surface elevation, based on a high measurement rate (10,000 times per second), multiple ground tracks of laser data, and closely spaced orbital tracks to provide more detailed mapping. Specific science goals of the airborne campaign include assessing how melting ice surfaces and snow-grain-size variability affect the surface return of green-wavelength light (the color of the ICESat-2 lasers).
Over sea ice, the aircraft data provide important information on sea ice freeboard (height of flotation) and snow cover on sea ice. Both are important parameters for correcting satellite measurements of sea ice thickness. Of the more than thirty-five science flight hours of data collected based out of Thule, four flights targeted sea ice in the vicinity of Nares Strait, where loose pack ice, covered in surface melt ponds, was found. These data will be available on the NASA ICESat-2 Web site later in the year.

