The sun has set over the central Arctic Ocean and Arctic sea ice extent is now increasing. Sea ice extent in Antarctica appears to have passed its seasonal maximum. The peak Antarctic value recorded so far of over 20 million square kilometers (7.7 million square miles) sets a new record over the period of satellite observations.
Overview of conditions
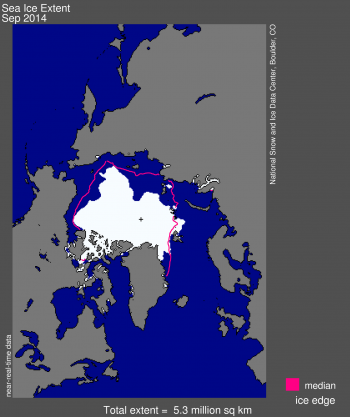
Figure 1. Arctic sea ice extent for September 2014 was 5.28 million square kilometers (2.04 million square miles). The magenta line shows the 1981 to 2010 median extent for that month. The black cross indicates the geographic North Pole. Sea Ice Index data. About the data
Credit: National Snow and Ice Data Center
High-resolution image
Following the seasonal daily minimum of 5.02 million square kilometers (1.94 million square miles) that was set on September 17, 2014 (6th lowest in the satellite record), Arctic sea ice has started its seasonal cycle of growth. Arctic sea ice extent averaged for the month of September 2014 was 5.28 million square kilometers (2.04 million square miles), also the 6th lowest in the satellite record. This is 1.24 million square kilometers (479,000 square miles) below the 1981 to 2010 average extent, and 1.65 million square kilometers (637,000 square miles) above the record low monthly average for September that occurred in 2012.
Conditions in context
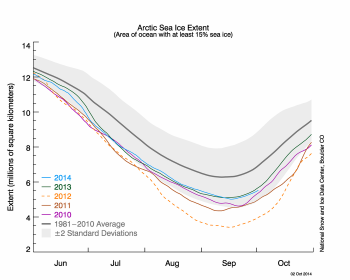
Figure 2. The graph above shows Arctic sea ice extent as of October 2, 2014, along with daily ice extent data for four previous years. 2014 is shown in blue, 2013 in green, 2012 in orange, 2011 in brown, and 2010 in purple. The 1981 to 2010 average is in dark gray. The gray area around the average line shows the two standard deviation range of the data. Sea Ice Index data.
Credit: National Snow and Ice Data Center
High-resolution image
Because ice extent falls through the first part of September and rises in the latter part, statistics on the average daily rate of ice loss or gain through the month are largely meaningless. More relevant is the total ice loss through the melt season. Between the seasonal maximum extent that occurred on March 21, 2014 and the September 17 minimum, the Arctic Ocean lost a total of 9.89 million square kilometers (3.82 million square miles) of ice, which is the 9th largest in the satellite record, but the least amount of seasonal loss since 2006. This year’s loss was 1.92 million square kilometers 741,000 square miles) less than the total loss that occurred in 2012.
September 2014 compared to previous years

Figure 3. Monthly September ice extent for 1979 to 2014 shows a decline of 13.3% per decade relative to the 1981 to 2010 average.
Credit: National Snow and Ice Data Center
High-resolution image
Through 2014, the linear rate of decline for September Arctic ice extent over the satellite record is 13.3% per decade, relative to the 1981 to 2010 average. The ten lowest September ice extents over the satellite record have all occurred in the last ten years.
Summer weather conditions in 2014
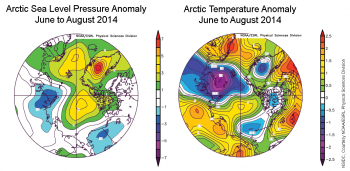
Figure 4. These images show June to August sea level pressure anomalies, compared to the 1981 to 2010 average, (left) and June to August temperature anomalies at the 925 hPa level, compared to the 1981 to 2010 average (right). At left, blues and purples indicate lower than average pressures, while greens, yellows, and reds indicate higher than average pressures. At right, reds and yellows indicate warmer than average temperatures, and blues and purples indicate lower than average temperatures.
Credit: National Snow and Ice Data Center courtesy NOAA/ESRL Physical Sciences Division
High-resolution image
Weather conditions prevailing over the summer of 2014 were unremarkable. Compared to the long term (1981 to 2010) climatology, sea level pressure over the period June through August was higher than average over much of the central Arctic Ocean, the Atlantic sector of the Arctic, and Greenland. While air temperatures at the 925 hPa level (approximately 3000 feet altitude) were slightly above average over part of the central Arctic Ocean, they were below average over the Kara Sea and just north of Alaska. The summer of 2013, which is now the 7th lowest ice extent in the satellite record, was also generally unremarkable in terms of temperature. Both of these years contrast sharply with 2012, which saw unusually warm conditions across the Arctic Ocean. The one significant weather pattern over the summer was a larger than normal pressure gradient over the Laptev Sea that drove southerly winds, brought warmer air, and helped drive sea ice northward. This led to the tongue of open water that reached to within 5 degrees latitude of the pole. However, this pressure gradient was not particularly extreme so thinner ice cover in the area was also a significant contributor to the open water near the pole. Sea surface temperatures may also have played a role, as we discussed in a previous post.
Ice age
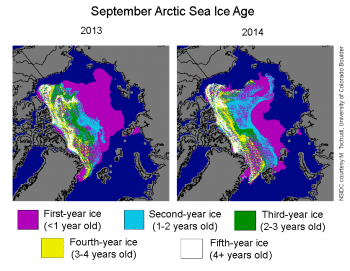
Figure 5. These images show the ages of ice in the Arctic at the end of September 2013 and 2014.
Credit: NSIDC courtesy M. Tschudi, University of Colorado
High-resolution image
The distribution of sea ice age at the time of the minimum provides some insights into the summer evolution of the ice cover. For ice that is three years and older, the distribution is similar to recent years, with most of this ice along the northern coast of Greenland and northwestern coast of the Canadian Archipelago. Through the winter, older ice moved across the Beaufort and Chukchi seas due to the typical clockwise circulation of the Beaufort Gyre. Similar to recent summers, much of this ice melted away, though this year it lasted through most of the summer, contributing to the relatively late development of open water along the Alaskan coast.
One notable feature this year compared to last year is that a tongue of second-year ice (ice that is 1 to 2 years old) persisted north and east of the East Siberian Sea. This likely helped limit the loss of ice in this region and kept the ice edge much farther southward than in the neighboring Laptev Sea to the east. The predominance of thinner first-year ice in the Laptev region, along with persistent southerly winds, led to seasonal retreat of the ice edge to north of 85 degrees North latitude.
Sea Ice maximum in Antarctica
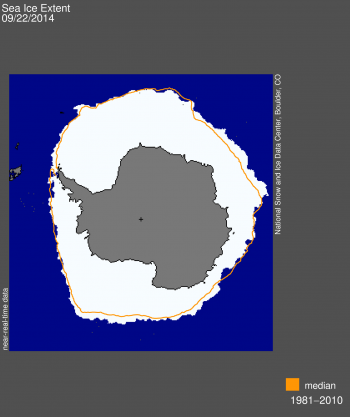
Figure 6a. Antarctic sea ice extent for September 22, 2014 was 20.11 million square kilometers (7.76 million square miles). The orange line shows the 1981 to 2010 median extent for that day. The black cross indicates the geographic South Pole. Sea Ice Index data. About the data
Credit: National Snow and Ice Data Center
High-resolution image
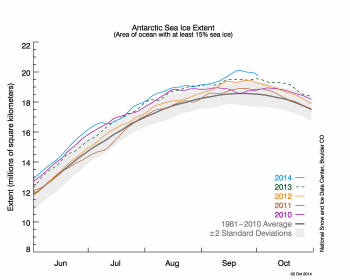
Figure 6b. The graph above shows Antarctic sea ice extent as of October 2, 2014, along with daily ice extent data for four previous years. 2014 is shown in blue, 2013 in green, 2012 in orange, 2011 in brown, and 2010 in purple. The 1981 to 2010 average is in dark gray. The gray area around the average line shows the two standard deviation range of the data. Sea Ice Index data.
Credit: National Snow and Ice Data Center
High-resolution image

Figure 6c. Monthly Antarctic September ice extent for 1979 to 2014 shows an increase of 1.3% per decade relative to the 1981 to 2010 average.
Credit: National Snow and Ice Data Center
High-resolution image
As we reported in our Arctic minimum announcement, sea ice in Antarctica has remained at satellite-era record high daily levels for most of 2014. On September 22, 2014, Antarctic ice extent increased to 20.11 million square kilometers (7.76 million square miles). This was the likely maximum extent for the year.
This year’s Antarctic sea ice maximum was 1.54 million square kilometers (595,000 square miles) above the 1981 to 2010 average maximum extent, which is nearly four standard deviations above this average. The 2014 ice extent record is 560,000 square kilometers (216,000 square miles) above the previous record ice extent set on October 1, 2013. Each of the last three years (2012, 2013, and 2014) has set new record highs for extent in the Antarctic.
The monthly average Antarctic ice extent for September 2014 is 20.03 million square kilometers (7.73 million square miles). This is 1.24 million square kilometers (479,000 square miles) above the 1981 to 2010 average for September ice extent. The Antarctic sea ice trend for September is now +1.3% per decade relative to the 1981 to 2010 average.
Monthly averaged ice extent for September is well above average in the western Pacific (northern Ross Sea) and Indian Ocean (Enderby Land) sectors.
Antarctic extent patterns
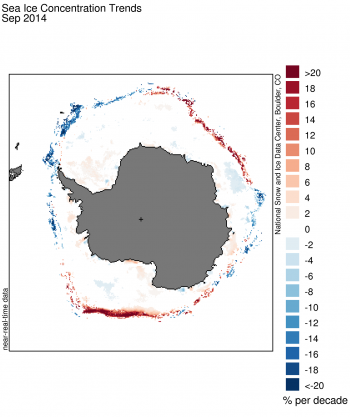
Figure 7. This image shows sea ice concentration trends for the month of September 2014. Oranges and reds indicate higher concentration trends; blues indicate lower concentration trends. Sea Ice Index data. About the data
Credit: National Snow and Ice Data Center
High-resolution image
A comparison of ice extent (Figure 6a) with ice concentration trends (Figure 7) illustrates that the areas of unusual ice growth are in the same places that have been showing ongoing trends of increased ice extent. This suggests that wind patterns play a significant role in the recent rapid growth in Antarctic ice extent. However, another possible reason is that recent ice sheet melt, caused by warmer, deep ocean water reaching the coastline and melting deeper ice, is making the surface water slightly less dense. While the change in saltiness is too small to significantly affect the freezing temperature, the increase in slightly less dense water surrounding Antarctica inhibits mixing, creating conditions that favor ice growth (as we discussed in our July 17 post).
Late season growth patterns
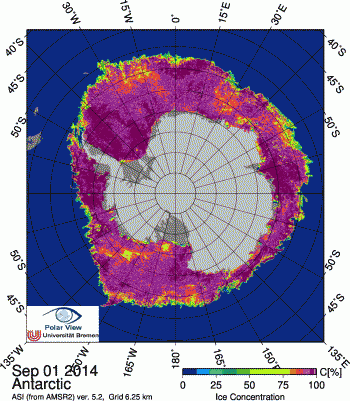
Figure 8a. This image series shows Antarctic sea ice concentration from September 1 to September 30, 2014. Click on the image to view the animated image series. Data are from the AMSR2 satellite instrument.
Credit: NSIDC/University of Bremen
View animated images
The period between September 10 and September 22 saw very rapid late-season ice growth in Antarctica, pushing the total sea ice extent upward by nearly 60,000 square kilometers per day (23,000 square miles). An animation of Antarctic sea ice concentrations from AMSR2 satellite data shows that a pulse of increased sea ice growth in several areas, but especially in the northern Weddell Sea, was the cause of the rapid rise in extent. A look at the weather for mid-September in the south indicates that a band of southerly winds swept from west to east across the northern Weddell Sea, favoring both ice growth and ice advection to the north.
For the mid-winter period, climate patterns for 2014 evolved in a similar way to 2013, as discussed in previous posts and in a paper led by our colleague, Phillip Reid. Sea ice growth in the Ross, Amundsen, and Bellingshausen seas for the austral winter of 2014 was favored by moderately strong low pressure anomalies in the Amundsen Sea, the northern Weddell Sea, and the central Indian Ocean region in mid-winter (late July and August). But at the period of the sea ice maximum, higher pressures over the continent reduced the intensity of westerly winds, and resulted in cooler southerly winds over the Weddell Sea and the Amundsen Sea. This helped to create the very large ice extent values seen in September. The Antarctic sea ice maximum period, as described above, had a further push from southerly winds over the far southern Atlantic (northernmost Weddell Sea) and Indian Ocean regions.
A related note
Last year, a vessel became trapped in ice south of Australia in an incident that highlighted the need for better local ice forecasts. The International Ice Charting Working Group will meet later this month in Punta Arenas, Chile. Members will work on improving the collective capability of ice services to provide ice information in the interests of marine safety.
Reference
Reid, P., S. Stammerjohn, R. Massom, T. Scambos, and J. Lieser. 2015, in press. The record 2013 Southern Hemisphere sea-ice extent maximum. Annals of Glaciology 56 (69), doi:10.3189/2015AoG69A892.

