Arctic sea ice reaches an uneventful maximum

Arctic sea ice appears to have reached its maximum extent on March 21, 2021, tying for seventh lowest in the 43-year satellite record. NSIDC will post a detailed analysis of the 2020 to 2021 winter sea ice conditions in our regular monthly post in early April.

Overview of conditions

Sea ice extent maximum for 2021

Figure 1. Arctic sea ice extent for March 21, 2021, was 14.77 million square kilometers (5.70 million square miles). The orange line shows the 1981 to 2010 average extent for that day. Sea Ice Index data. About the data

Credit: National Snow and Ice Data Center
High-resolution image

On March 21, 2021, Arctic sea ice likely reached its maximum extent for the year, at 14.77 million square kilometers (5.70 million square miles), tying for the seventh lowest extent in the satellite record with 2007. This year’s maximum extent is 870,000 square kilometers (336,000 square miles) below the 1981 to 2010 average maximum of 15.64 million square kilometers (6.04 million square miles) and 360,000 square kilometers (139,000 square miles) above the lowest maximum of 14.41 million square kilometers (5.56 million square miles) set on March 7, 2017. Prior to 2019, the four lowest maximum extents occurred from 2015 to 2018.

The date of the maximum this year, March 21, was nine days later than the 1981 to 2010 median date of March 12.

Table 1. Ten lowest maximum Arctic sea ice extents (satellite record, 1979 to present)

Rank Year In millions of square kilometers In millions of square miles Date
1 2017 14.41 5.56 March 7
2 2018 14.47 5.59 March 17
3 2016
2015
14.51
14.52
5.60
5.61
March 23
February 25
5 2011
2006
14.67
14.68
5.66
5.67
March 9
March 12
7 2007
2021
14.77
14.77
5.70
5.70
March 12
March 21
9 2019 14.82 5.72 March 13
10 2005 14.95 5.77 March 12

For the Arctic maximum, which typically occurs in March, the uncertainty range is ~34,000 square kilometers (13,000 square miles), meaning that extents within this range must be considered effectively equal.

Final analysis pending

Please note this is a preliminary announcement of the sea ice maximum. At the beginning of April, NSIDC scientists will release a full analysis of winter conditions in the Arctic, along with monthly data for March.

Fluctuating pressures

Sea ice extent for February 2021 tracked well below average, but at month’s end was still higher than levels recorded in several recent years. Extent grew at an average pace. For the first two weeks of the month, sea level pressure was extremely high over the central Arctic Ocean, driving a pronounced and enlarged Beaufort Gyre sea ice circulation. A strong negative phase of the Arctic Oscillation was a part of the overall Arctic pattern.

Overview of conditions

Figure 1. Arctic sea ice extent for February 2021 was 14.24 million square kilometers (5.50 million square miles). The magenta line shows the 1981 to 2010 average extent for that month. Sea Ice Index data. About the data||Credit: National Snow and Ice Data Center|High-resolution image

Figure 1. Arctic sea ice extent for February 2021 was 14.39 million square kilometers (5.56 million square miles). The magenta line shows the 1981 to 2010 average extent for that month. Sea Ice Index data. About the data

Credit: National Snow and Ice Data Center
High-resolution image

Arctic sea ice extent averaged for the month of February 2021 was 14.39 million square kilometers (5.56 million square miles), placing it seventh lowest in the satellite record for the month. This was 910,000 square kilometers (351,000 square miles) below the 1981 to 2010 February average and 420,000 square kilometers (162,000 square miles) above the record low mark for February set in 2018. For the month of February, ice extent was near average in most regions of the Arctic except most notably in the Gulf of St. Lawrence, and to a lesser extent in the Bering Sea and the Sea of Okhotsk. The ice edge was also further north than average on the northern and western side of Svalbard.

Conditions in context

Figure2a. The graph above shows Arctic sea ice extent as of March 8, 2021, along with daily ice extent data for four previous years and the record low year. 2021 is shown in blue, 2020 in green, 2019 in orange, 2018 in brown, 2015 in magenta, and 2012 in dashed brown. The 1981 to 2010 median is in dark gray. The gray areas around the median line show the interquartile and interdecile ranges of the data. Sea Ice Index data.||Credit: National Snow and Ice Data Center|High-resolution image

Figure 2a. The graph above shows Arctic sea ice extent as of March 8, 2021, along with daily ice extent data for four previous winter seasons and the record low year. 2020 to 2021 is shown in blue, 2019 to 2020 in green, 2018 to 2019 in orange, 2017 to 2018 in brown, 2016 to 2015 in magenta, and 2011 to 2012 in dashed brown. The 1981 to 2010 median is in dark gray. The gray areas around the median line show the interquartile and interdecile ranges of the data. Sea Ice Index data.

Credit: National Snow and Ice Data Center
High-resolution image

Figure 2b. This plot shows the departure from average air temperature in the Arctic at the 925 hPa level, in degrees Celsius, for February 2021. Yellows and reds indicate higher than average temperatures; blues and purples indicate lower than average temperatures. ||Credit: NSIDC courtesy NOAA Earth System Research Laboratory Physical Sciences Division |High-resolution image

Figure 2b. This plot shows the departure from average air temperature in the Arctic at the 925 hPa level, in degrees Celsius, for February 2021. Yellows and reds indicate higher than average temperatures; blues and purples indicate lower than average temperatures.

Credit: NSIDC courtesy NOAA Earth System Research Laboratory Physical Sciences Division

High-resolution image

Figure 2c. This plot shows average sea level pressure in the Arctic in millibars for February 2021. Yellows and reds indicate high air pressure; blues and purples indicate low pressure. ||Credit: NSIDC courtesy NOAA Earth System Research Laboratory Physical Sciences Division |High-resolution image

Figure 2c. This plot shows average sea level pressure in the Arctic in millibars for February 2021. Yellows and reds indicate high air pressure; blues and purples indicate low pressure.

Credit: NSIDC courtesy NOAA Earth System Research Laboratory Physical Sciences Division

High-resolution image

Throughout the month, sea ice grew by an average of 9,900 square kilometers (3,800 square miles) per day, roughly half the average rate over the period 1981 to 2010 of 20,300 square kilometers (7,800 square miles per day).

Air temperatures at the 925 hPa level (about 2,500 feet above the surface) were from 1 to 6 degrees Celsius (2 to 11 degrees Fahrenheit) above average across much of the central Arctic Ocean, East Siberian Sea, Atlantic Sector, and Canadian Arctic Archipelago. By contrast, northern Alaska, Siberia, and the Beaufort Seas saw temperatures up to 8 degrees Celsius (14 degrees Fahrenheit)  below average (Figure 2b).

The first part of the month was characterized by extremely high sea level pressure over the central Arctic Ocean, driving an exceptionally strong clockwise Beaufort Gyre sea ice circulation. This is consistent with the strongly negative phase of the Arctic Oscillation observed over this time period, which is sometimes associated with a wavy jet stream pattern and cold air outbreaks in lower latitudes, such as was experienced in Texas during the middle of the month. While this pattern broke down later in the month, the average sea level pressure pattern for February still featured a strong Beaufort High, with peak surface pressures exceeding 1,030 (Figure 2c). This atmospheric circulation pattern, driving a pronounced clockwise Beaufort Gyre circulation, led to the transport of thick multiyear ice along the Canadian Arctic Archipelago towards the Alaskan coastline.

February 2021 compared to previous years

Figure 3. Monthly February ice extent for 1979 to 2021 shows a decline of 2.9 percent per decade.||Credit: National Snow and Ice Data Center| High-resolution image

Figure 3. Monthly February ice extent for 1979 to 2021 shows a decline of 2.9 percent per decade.

Credit: National Snow and Ice Data Center
High-resolution image

Including 2021, the linear rate of decline for February ice extent is 2.9 percent per decade. This corresponds to a trend of 43,800 square kilometers (16,900 square miles) per year, which is roughly twice the size of the state of New Hampshire. Over the 43-year satellite record, the Arctic has lost about 1.84 million square kilometers (710,000 square miles) of sea ice in February, based on the difference in linear trend values in 2020 and 1979. This is an area about two and a half times the size of Texas.

The minimum in the south

Figure 4. Antarctic sea ice extent for February 2021 was 2.83 million square kilometers (1.09 million square miles). The magenta line shows the 1981 to 2010 average extent for that month. Sea Ice Index data. About the data||Credit: National Snow and Ice Data Center|High-resolution image

Figure 4. Antarctic sea ice extent for February 2021 was 2.83 million square kilometers (1.09 million square miles). The magenta line shows the 1981 to 2010 average extent for that month. Sea Ice Index data. About the data

Credit: National Snow and Ice Data Center
High-resolution image

Antarctic sea ice extent reached its minimum around February 21, during the period of missing data of which we had notified data users. After February 21, sea ice began a rapid increase in extent caused by the early rapid sea ice growth in the Amundsen and eastern Ross Seas. Advanced Microwave Scanning Radiometer 2 (AMSR-2) data, which was not impacted by the outage, confirms that the minimum was reached on or near February 21.

Sea ice extent has trended below average again after several months in mid- to late 2020 above the 1981 to 2010 average. However, the 2021 minimum extent is twelfth lowest in the satellite record and far from the record low extent, which occurred in 2017. Below-average extents were present in the northern Weddell and eastern Ross Seas, while the Bellingshausen Sea and the Wilkes Land Coast were near average (Figure 4).

Sticking with our 30-year reference climatology

Figure 5. This graph shows the daily median Arctic sea ice extent for the calendar year from the 1981 to 2010 period and the 1991 to 2020 for comparison. NSIDC plans to maintain the 1981 to 2010 period as our standard climatology. ||Credit: National Snow and Ice Data Center| High-resolution image

Figure 5. This graph shows the daily median Arctic sea ice extent for the calendar year from the 1981 to 2010 period and the 1991 to 2020 for comparison. NSIDC plans to maintain the 1981 to 2010 period as our standard climatology.

Credit: National Snow and Ice Data Center
High-resolution image

A 30-year climatology is commonly used as a reference period in weather and climate to define “normal” conditions. Thirty years is long enough to average out most natural variations in climate, like El Niño, that can affect the average in the short term. At the same time, 30 years is short enough that it provides a window into recent experience for planning purposes, such as crop rotation. Weather forecast services update their climatology with each new decade. So, the US National Weather Service will soon update the period from 1981 to 2010 to 1991 to 2020.

However, a shifting baseline makes tracking long-term climate change more complicated. As the baseline shifts, anomalies (amount above or below “normal”) and relative (percent per decade) trends will change. For climate, it is better to use a fixed period with a good data record so that as new data is collected, there is a consistent baseline for decadal or longer evaluation of change. Ideally, this baseline period would be relatively stable and without much of a trend. This is particularly a problem for Arctic sea ice where the last 10 years have had several extremely low extents. Including these recent years hardly represents “normal” in terms of the long-term climate. For this reason, we plan to maintain the 1981 to 2010 period as our standard climatology. The period comprises the earliest three full decades in the continuous satellite record. The data for this period have been well validated and consistency has been maintained through careful calibrations between different sensors used in the time series. Figure 5 shows the daily median extent for the calendar year from the 1981 to 2010 period and the 1991 to 2020 for comparison. As expected, the 1991 to 2020 median extents are lower than the 1981 to 2010 values, particularly during summer. The annual minimum of the 1991 to 2020 median extent is about 800,000 square kilometers (309,000 square miles) lower than the 1981 to 2010 median. Additionally, 1991 to 2020 sea ice extents exhibit much greater variability compared to sea ice conditions between 1981 and 2010.

We will consider adding a 1991 to 2020 median line to our Charctic interactive sea ice graph. Our Sea Ice Analysis Tool allows users to customize the baseline period for anomaly calculations. A more thorough discussion of the issue of climate “normal” can be found in a recent Yale Climate Connections article.

Addressing the mid-February data gap

As previously posted, a gap occurred in our sea ice extent estimates from February 20 to 21 due to a data loss by our source of passive microwave sensor data used to derive our concentration and extent estimates. These data unfortunately do not appear to be recoverable. However, the sensor is still healthy and another outage is not expected. The data gap resulted in temporary outages of Sea Ice Index data and various tools, such as Charctic. Values for February 20 and 21 were derived by interpolating from surrounding days.

A lopsided January

Arctic sea ice extent for January 2021 tracked below average, with the monthly average finishing sixth lowest in the satellite record. While air temperatures were well above average on the Atlantic side of the Arctic, air temperatures were strongly below average over Siberia. A warm spell hit the Canadian Arctic, and rain fell on snow over Nunavut, Canada. According to NASA and the National Oceanic and Atmospheric Administration (NOAA), 2020 tied for the highest global annual temperature with 2016.

Overview of conditions

Arctic sea ice extent Jan 2021

Figure 1. Arctic sea ice extent for January 2021 was 13.48 million square kilometers (5.20 million square miles). The magenta line shows the 1981 to 2010 average extent for that month. Sea Ice Index data. About the data

Credit: National Snow and Ice Data Center
High-resolution image

Arctic sea ice extent averaged for January 2021 was 13.48 million square kilometers (5.20 million square miles). This was 400,000 square kilometers (154,000 square miles) above the record low set in 2018 and 940,000 square kilometers (363,000 square miles) below the 1981 to 2010 average. Extent continued to track below average in the Barents Sea, Baffin Bay, Davis Strait, and the Labrador Sea. Extent was also below average on the Russian side of the Bering Sea, but elsewhere the ice edge was near its average location for this time of year. Ice extent expanded through the month on the Alaskan side of the Bering Sea and within the Sea of Okhotsk. Ice growth was also prominent in the northern Barents Sea west of Svalbard.

Conditions in context

Arctic sea ice extent compared to other years

Figure 2a. The graph above shows Arctic sea ice extent as of February 1, 2021, along with daily ice extent data for four previous years and the record low year. 2020 to 2021 is shown in blue, 2019 to 2020 in green, 2018 to 2019 in orange, 2017 to 2018 in brown, 2016 to 2017 in magenta, and 2012 to 2013 in dashed brown. The 1981 to 2010 median is in dark gray. The gray areas around the median line show the interquartile and interdecile ranges of the data. Sea Ice Index data.

Credit: National Snow and Ice Data Center
High-resolution image

Difference from average air temperature over Arctic for January 2021

Figure 2b. This plot shows the departure from average air temperature in the Arctic at the 925 hPa level, in degrees Celsius, for January 2021. Yellows and reds indicate higher than average temperatures; blues and purples indicate lower than average temperatures.

Credit: NSIDC courtesy NOAA Earth System Research Laboratory Physical Sciences Division
High-resolution image

Average Arctic sea level pressure, January 2021

Figure 2c. This plot shows average sea level pressure in the Arctic in millibars for January 2021. Yellows and reds indicate high air pressure; blues and purples indicate low pressure.

Credit: NSIDC courtesy NOAA Earth System Research Laboratory Physical Sciences Division
High-resolution image

During January, sea ice extent tracked below measured values for most years except 2017 and 2016, but by the middle of the month, extent rose above the average for the last 10 years, from 2011 to 2020. Overall, in January the Arctic gained 1.42 million square kilometers (548,000 square miles) of ice.

Air temperatures at the 925 mb level (about 2,500 feet above sea level) in January were considerably above average over the Atlantic side of the Arctic, especially in the Baffin Bay region (up to 8 degrees Celsius or 14 degrees Fahrenheit) above average. Temperatures were 2 to 6 degrees Celsius (4 to 11 degrees Fahrenheit) above average over Canada and Alaska. By sharp contrast, air temperatures were between 6 and 8 degrees Celsius (11 and 14 degrees Fahrenheit) below average over Siberia. The atmospheric circulation associated with this lopsided pattern was dominated by high pressure over Siberia and low pressure over the Northern North Atlantic and Pacific Ocean.

January 2021 compared to previous years

Graph showing decline of sea ice for January from 1979 to 2021

Figure 3. Monthly January ice extent for 1979 to 2021 shows a decline of 3.1 percent per decade.

Credit: National Snow and Ice Data Center
High-resolution image

Through 2021, the linear rate of decline for January sea ice extent is 3.1 percent per decade, which corresponds to 44,700 square kilometers (17,300 square miles) per year, about twice the size of New Jersey. The cumulative January ice loss over the 43-year satellite record is 1.88 million square kilometers (726,000 square miles), based on the difference in linear trend values in 2021 and 1979.

2020 ties for the warmest year on record

Time-series of global annual mean air temperatures from 1880 through 2020.

Figure 4a. This time-series shows global annual average air temperatures from 1880 through 2020.

Credit: NASA
High-resolution image

Figure 4b. The plot on the left shows annual air temperature departures in 2020 from the 1951 to 1980 average for the Arctic, while the plot on the right shows air temperature departures for Antarctica for the same time period. ||Credit: NASA | High-resolution image

Figure 4b. The plot on the left shows annual air temperature departures in 2020 from the 1951 to 1980 average for the Arctic, while the plot on the right shows air temperature departures for Antarctica for the same time period.

Credit: NASA
High-resolution image

According to the National Oceanic and Atmospheric Administration (NOAA) and the analysis of the NASA Goddard Institute for Space Studies (GISS), the global surface temperature for 2020 tied with 2016 as the highest in the instrumental record, at 1.02 degrees Celsius (1.84 degrees Fahrenheit) above than the baseline of 1951 to 1980 (Figure 4a). While both institutions use the same raw temperature record in their analysis, NOAA does not infer temperatures in the polar regions where observations are not as numerous. Whether travel restrictions may have opposed warming by reducing particulate air pollution and global CO2 emissions remains unclear. Year-to-year variability in global air temperatures is known to be partly tied to the phase of the El Niño-Southern Oscillation (ENSO). When ENSO is positive (El-Niño), more heat is exchanged between the ocean and the atmosphere, especially in the Pacific, leading to a higher global average temperature, such as in 1998 and 2016. While 2020 started in with modest El Niño conditions, it ended with La Niña conditions.

In the Arctic, NASA GISS analysis suggests that 2020 ranked as the warmest year on record, with extremely high temperatures relative to average over the Siberian Arctic; Temperatures were 6.4 degrees Celsius (11.5 degrees Fahrenheit) above the 1951 to 1980 average. The region around north central Siberia was especially warm (Figure 4b). The North Atlantic, east of Greenland, is an exception to the Northern Hemisphere warmth. Previous studies have linked relatively cool conditions in this area to weakening of the Atlantic Meridional Overturning Circulation (AMOC), related to an increase in freshwater input to the North Atlantic from Greenland’s melt water. A new study suggests other factors are also involved, including more low-level clouds that reduce the amount of incoming sunlight in that region.

Over the Antarctic, air temperatures were mostly above average during 2020, with particularly warm conditions over the West Antarctic Peninsula and the Bellingshausen Sea. This contrasts with below average temperatures over the Weddell Sea.

Leaky Arctic plug

Nares Strait on map

Figure 5a. This map shows the Nares Strait in relation to Greenland, Ellesmere Island (a northernmost Canadian Island). The ice arch forms at the entrance into Nares Strait from the Lincoln Sea.

Credit: Moore et al., 2021, Nature Communications
High-resolution image

collapse of north water polynya in summer 2020

Figure 5b. These two images show the collapse of the North Water Polynya between June 24 and July 4, 2020.

Credit: Moore et al., 2021, Nature Communications
High-resolution image

The amount of Arctic sea ice can be reduced through more summer melt, less winter growth, or export out of the Arctic Ocean through various passages, notably Fram Strait and the narrow passages in the Canadian Arctic Archipelago. Nares Strait, a passage between Ellesmere Island and Greenland that connects the Lincoln Sea with Baffin Bay, is one of the last refuges for old thick ice (Figure 5a). Most of the year, ice dams, or ice arches, prevent ice in the Lincoln Sea moving through Nares Strait. However, a recent study shows that the seasonal duration of the ice arch has fallen from typically 200 to 300 days annually between 1997 and 2001 to about 150 days or less since 2003. This allows some of the old and thick ice to move southwards where it melts out in Baffin Bay. An increased flow of thick, multiyear ice into northern Baffin Bay may also negatively impact the formation of the North Water Polynya, also called Pikialasorsuaq, which is an important biologically rich open water area that plays an essential role for Inuit communities (Figure 5b).

Warm winters, more rain

Climate models predict that in coming decades more Arctic precipitation will fall as rain instead of snow, both on sea ice and land. When rain falls on a snowpack in winter, it can refreeze, forming a hard icy layer. On land, caribou and muskoxen cannot break through this hard icy crust to forage. Icy layers can also form when air temperatures rise above freezing during winter and then fall below freezing. One such warm spell recently hit the Canadian Arctic in the area of Iqaluit, Nunavut, and local observers experienced rain. Unseasonably warm conditions lasted until the last week of January.

Further reading

Keil, P. et al. 2020. Multiple drivers of the North Atlantic warming hole. Nature Climate Change. doi:10.1038/s41558-020-0819-8.

Moore, G. W. K., Howell, S. E. L., Brady, M. et al. 2021. Anomalous collapses of Nares Strait ice arches leads to enhanced export of Arctic sea ice. Nature Communications 12, 1. doi:10.1038/s41467-020-20314-w.

Ho, ho, ho-hum December

The Arctic climate was extraordinary in 2020, but the year ended with a less spectacular December. Ice growth was faster than average throughout the month, but extent at month’s end remained among the lowest in the satellite record. Air temperatures for the month were higher than average in most areas, but less so than in many previous months. Overall, it was an extremely warm 2020, especially over Siberia.

Overview of conditions

Figure 1. Arctic sea ice extent for December 2020 was 11.77 million square kilometers (4.54 million square miles). The magenta line shows the 1981 to 2010 average extent for that month. Sea Ice Index data. About the data||Credit: National Snow and Ice Data Center|High-resolution image

Figure 1. Arctic sea ice extent for December 2020 was 11.77 million square kilometers (4.54 million square miles). The magenta line shows the 1981 to 2010 average extent for that month. Sea Ice Index data. About the data

Credit: National Snow and Ice Data Center
High-resolution image

Arctic sea ice extent averaged for December 2020 was the third lowest in the satellite record. The monthly average extent of 11.77 million square kilometers (4.54 million square miles) was 1.07 million square kilometers (413,000 square miles) below the 1981 to 2010 December average. Sea ice cover was below average in the Bering Sea on the Pacific side and the Barents Sea on the Atlantic side. Compared to 2016, which had the lowest December sea ice extent on record, the ice edge in 2020 is further south in the Barents and East Greenland Seas, but further north in Davis Strait and the Labrador Sea.

Conditions in context

Figure 2a. The graph above shows Arctic sea ice extent as of January 4, 2020, along with daily ice extent data for five previous years and the record low year. 2019 to 2020 is shown in blue, 2018 to 2017 in green, 2017 to 2018 in orange, 2016 to 2017 in brown, 2015 to 2016 in magenta, and 2011 to 2012 in dashed brown. The 1981 to 2010 median is in dark gray. The gray areas around the median line show the interquartile and interdecile ranges of the data. Sea Ice Index data.||Credit: National Snow and Ice Data Center|High-resolution image

Figure 2a. The graph above shows Arctic sea ice extent as of January 4, 2021, along with daily ice extent data for five previous years and the record low year. 2020 to 2021 is shown in blue, 2019 to 2020 in green, 2018 to 2019 in orange, 2017 to 2018 in brown, 2016 to 2017 in magenta, and 2012 to 2013 in dashed brown, the record low year. The 1981 to 2010 median is in dark gray. The gray areas around the median line show the interquartile and interdecile ranges of the data. Sea Ice Index data.

Credit: National Snow and Ice Data Center
High-resolution image

Figure 2b. This plot shows the departure from average air temperature in the Arctic at the 925 hPa level, in degrees Celsius, for December 2020. Yellows and reds indicate higher than average temperatures; blues and purples indicate lower than average temperatures. ||Credit: NSIDC courtesy NOAA Earth System Research Laboratory Physical Sciences Division|High-resolution image

Figure 2b. This plot shows the departure from average air temperature in the Arctic at the 925 hPa level, in degrees Celsius, for December 2020. Yellows and reds indicate higher than average temperatures; blues and purples indicate lower than average temperatures.

Credit: NSIDC courtesy NOAA Earth System Research Laboratory Physical Sciences Division
High-resolution image

Sea ice extent increased by 2.71 million square kilometers (1.05 million square miles) during the month of December. This was greater than the 1981 to 2010 average gain in December of 1.99 square kilometers (780,000 square miles). However, after a rapid early and mid-month gain, the rate of extent increase slowed considerably (Figure 2a).

December air temperatures at the 925 mb level (about 2,500 feet about sea level) continued to be relatively high for this time of year over much of the Arctic Ocean, particularly north of the Laptev and East Siberian Seas, which saw temperatures of 5 degrees Celsius (9 degrees Fahrenheit) above the 1981 to 2010 average (Figure 2b). Average and below average temperatures prevailed in the Beaufort and eastern Chukchi Seas.

The Arctic Oscillation (AO), after being in a strong positive mode for most of November, flipped to a negative mode for most of December. As a result of the AO flipping to negative, a sea level pressure pattern formed in December with high pressure over the Arctic Ocean, a fairly strong  Beaufort Sea High pressure pattern, and low pressure over the Atlantic and Pacific subarctic. Earlier research (Rigor et al., 2002) argued that during winter, a negative mode tends to retain older and thicker ice within the Arctic Ocean, which potentially portends a more moderate ice loss the following summer. Conversely, when the AO is positive, the wind pattern helps to transport ice from the Siberian coast, across the pole and out of the Arctic Ocean via the Fram Strait, leaving more thin ice along the Siberian shore that melts out readily in summer. The strong positive AO during the winter of 2019 to 2020 may have played a role in this past summer’s low sea ice extent. However, this relationship between the AO and summer ice extent has not been strong in recent years.

December 2020 compared to previous Decembers

Figure 3. Monthly December ice extent for 1979 to 2020 shows a decline of 3.62 percent per decade.||Credit: National Snow and Ice Data Center| High-resolution image

Figure 3. Monthly December ice extent for 1979 to 2020 shows a decline of 3.6 percent per decade.

Credit: National Snow and Ice Data Center
High-resolution image

Through 2020, the linear rate of decline for December sea ice extent is 3.6 percent per decade, which corresponds to 46,500 square kilometers (18,000 square miles) per year, about twice the size of New Hampshire. The cumulative December ice loss over the 43-year satellite record is 1.97 million square kilometers (761,000 square miles), based on the difference in linear trend values in 2020 and 1978. This is equivalent to about three times the size of Texas.

Check in down south

Figure 4a. Antarctic sea ice extent (left) for December 2020 was 10.4 million square kilometers (4.02 million square miles). Antarctic sea ice concentration (right) for December 2020 was 6.5 million square kilometers (2.51 million square miles). The magenta line shows the 1981 to 2010 average extent (left) and concentration (right) for that month. Sea Ice Index data. About the data||Credit: National Snow and Ice Data Center|High-resolution image

Figure 4a. Antarctic sea ice extent (left) for December 2020 was 10.4 million square kilometers (4.02 million square miles). Antarctic sea ice concentration (right) for December 2020 was 6.5 million square kilometers (2.51 million square miles). The magenta line shows the 1981 to 2010 average extent (left) and concentration (right) for that month. Sea Ice Index data. About the data

Credit: National Snow and Ice Data Center
High-resolution image

Figure 4b. This figure shows the impact of the sudden decline of Antarctic sea ice extent in August 2016 on the ice extent for the rest of the year. This was due to a phase shift of the decline pattern. ||Credit: Handcock and Raphael, 2020 | High-resolution image

Figure 4b. This figure shows the impact of the sudden decline of Antarctic sea ice extent in August 2016 on the ice extent for the rest of the year. This was due to a phase shift of the decline pattern.

Credit: Handcock and Raphael, 2020
High-resolution image

After being above average for much of the austral winter and spring, Antarctic sea ice extent dropped below average in the last week of December. Ice extent tends to see a steep decline in December as the ice begins to disintegrate all around the continent. However, the decline in sea ice extent in the Weddell and Ross Seas has been unusually rapid this year and large regions of low-concentration ice are present at year’s end (Figure 4a).

In a recent study, Handcock and Raphael (2020) note that in the Antarctic, much of the departure from average extent depends on the timing of the ice loss. For example, when extent is dropping substantially each day, a few days difference in the timing of the beginning and end of ice loss and gain can result in relatively large departure in ice extent from average. The causes of earlier or later onsets of ice loss—weather or ocean forcings on the cyclical annual trend—have long-running effects if they adjust the phase of the cycle.

After an extended period of below-average ice extent since the second half of 2016, Antarctic sea ice expanded to above-average levels in August of 2020 and remained high until the last week of this month. Once again, the Maud Rise polynya was open, but only briefly in late November and early December, as sea ice retreat in the Weddell proceeded and the ice edge swept past the polynya.

The Arctic sea ice year in review

Figure 5a. This plot shows the departure from average air temperature in the Arctic at the 925 hPa level, in degrees Celsius, for the full calendar year 2020. Yellows and reds indicate higher than average temperatures; blues and purples indicate lower than average temperatures. ||Credit: NSIDC courtesy NOAA Earth System Research Laboratory Physical Sciences Division|High-resolution image

Figure 5a. This plot shows the departure from average air temperature in the Arctic at the 925 hPa level, in degrees Celsius, for the full calendar year 2020. Yellows and reds indicate higher than average temperatures; blues and purples indicate lower than average temperatures.

Credit: NSIDC courtesy NOAA Earth System Research Laboratory Physical Sciences Division
High-resolution image

Figure 5b. This figure shows the average January, February, March Arctic Oscillation (AO) Index for 1950 to 2020. ||Credit: NSIDC courtesy, with data from the NOAA NCEP Climate Prediction Center. |High-resolution image

Figure 5b. This figure shows the average January, February, March Arctic Oscillation (AO) Index for 1950 to 2020.

Credit: NSIDC courtesy, with data from the NOAA NCEP Climate Prediction Center.
High-resolution image

The year 2020 was extreme for the Arctic, even compared to the past 20 years. Notable was the extreme heat over Siberia. The annual average temperature at the 925 mb level (about 2,500 feet above sea level) was over 3.5 degrees Celsius (6 degrees Fahrenheit) above the 1981 to 2010 annual average over a broad area of North Central Siberia extending over the Kara and Laptev Seas (Figure 5a). Temperatures were particularly high in the region through the first six months of the year, culminating in a 100-degree Fahrenheit (38-degrees Celsius) temperature reading in June in Verkhojansk, Russia. This was the first recorded temperature of over 100 degrees Fahrenheit north of the Arctic Circle.

These very warm conditions, coupled with winds from the south, led to early melt onset and ice retreat in the Laptev Sea. By mid-June, ice in the Laptev Sea had reached record low extent for that time of year. The strong positive mode of the Arctic Oscillation (AO) during the 2020 winter from January through March may have contributed to thin ice in the region that melted out easily once melt started. The average 2020 winter AO index was the most positive in the National Centers for Environmental Prediction (NCEP) record, dating back to 1950. Only 1989 and 1990 rivaled 2020 (Figure 5b).

The winter and spring conditions and early sea ice melt onset and retreat led to the second lowest September minimum extent in the satellite record, above only 2012. While Arctic air temperatures ranked as the highest recorded during both July and August, changes in the winds likely prevented extent from falling below the 2012 record low. There was a remarkably long open water shipping season along the Northern Sea Route (NSR) along the Russian coast. The relatively thin winter ice along the Russian coast (relative to the Central Arctic Ocean) allows for Russian icebreakers to maintain a channel for ships to navigate the passage throughout the year. However, as the summer ice extent has decreased, the NSR has become ice free for a longer period of time. In many recent years, the NSR was ice free for several weeks. A recent report indicates that this year’s ice-free season was the longest on record.

While the Arctic sea ice story largely centered on the Russian side of the Arctic Ocean, eyes also shifted toward the Atlantic in late summer with the retreat of the ice edge towards the pole. During late summer, the ice edge retreated to within about 500 kilometers (300 miles) of the North Pole north of the Barents and Kara Seas. Along that ice edge, the ice was not very compact. This allowed the German icebreaker, R.V. Polarstern, to easily cruise to the pole in early August as part of the Multidisciplinary drifting Observatory for the Study of Arctic Climate (MOSAiC) expedition.

Initial results from MOSAiC

Figure 6. The left side of this figure shows the agreement between snow depth derived from the Ku-Ka radar sensor (x-axis) and in situ measurements (y-axis) by a magnaprobe snow depth instrument across two transects (red and blue dots). The radar measurements have a correlation with the in situ measurements of 0.66, demonstrating the utility of the radar for estimating snow depth. The right side shows the data along a transect across the snow and ice with the radar and the magnaprobe. The colors in the plot correspond to the strength of radar signal and the lines demarcate snow/air and snow/ice boundaries. For further details on the analysis and the figures, see Stroeve et al. (2020). ||Credit: Julienne Stroeve, National Snow and Ice Data Center|High-resolution image

Figure 6. The left side of this figure shows the agreement between snow depth derived from the Ku-Ka radar sensor (x-axis) and in situ measurements (y-axis) by a magnaprobe snow depth instrument across two transects (red and blue dots). The radar measurements have a correlation with the in situ measurements of 0.66, demonstrating the utility of the radar for estimating snow depth. The right side shows the data along a transect across the snow and ice with the radar and the magnaprobe. The colors in the plot correspond to the strength of radar signal and the lines demarcate snow/air and snow/ice boundaries. For further details on the analysis and the figures, see Stroeve et al. (2020).

Credit: R. Willatt, University of College London
High-resolution image

As discussed in earlier posts, the MOSAiC expedition was the most notable scientific Arctic event of 2020. The expedition involved freezing an icebreaker into Arctic sea ice for one year beginning in September 2019. Scientists collected data on all aspects of the Arctic environment, including sea ice, atmosphere, ocean, biology, chemistry, and more. It will take years to fully assess the data, but initial analyses are already being published. This includes a new paper (Stroeve et al., 2020) analyzing data from a ground-mounted radar, an effort led by NSIDC senior research scientist and MOSAiC participant, Julienne Stroeve. This radar has the same frequencies as used on current satellite systems to monitor ice thickness and snow depth. However, satellites do not directly retrieve sea ice thickness; it is inferred based on assumptions as to where the radar return is coming from as well as assumptions on depth of the snowpack, and densities of the ice, snow and water. To better understand how snowpack properties influence radar backscatter at these frequencies, Stroeve and colleagues deployed a fully polarimetric, dual frequency radar with both Ku radar (12 to 18 gigahertz) and Ka radar (27 to 40 gigahertz). The instrument operated in a scanning mode, sweeping above the surface at different azimuth and incidence angles, as well as an altimeter mode, looking straight down while being towed with a skidoo. Observations were supported by detailed snow pit observations, snow depth and ice thickness, as well as laser scans of the surface to provide estimates of surface roughness.

Initial results based on data collected between October 2019 and January 2020 show that a combination of frequencies can provide estimates of snow depth. Further, the data illustrate the radar backscatter sensitivity to snow pack temperature and surface roughness, affecting the retrieved height of the sea ice freeboard, or sea ice thickness calculations.

Further reading

Handcock, M. S. and M. N. Raphael. 2020. Modeling the annual cycle of daily Antarctic sea ice extent. The Cryosphere. doi:10.5194/tc-14-2159-2020.

Rigor, I. G., Wallace, J. M., and R. L. Colony. 2002. Response of Sea Ice to the Arctic Oscillation. Journal of Climate. doi:10.1175/1520-0442(2002)015<2648:ROSITT>2.0.CO;2.

Stroeve, J., Nandan, V., Willatt, R., Tonboe, R., Hendricks, S., Ricker, R., Mead, J., Mallett, R., Huntemann, M., Itkin, P., Schneebeli, M., Krampe, D., Spreen, G., Wilkinson, J., Matero, I., Hoppmann, M., and M. Tsamados. 2020. Surface-based Ku- and Ka-band polarimetric radar for sea ice studies. The Cryosphere. doi:10.5194/tc-14-4405-2020.

Persistently peculiar

Entering December, which is the start of winter in the Northern Hemisphere, sea ice extent remains far below average, dominated by the lack of ice on both the Pacific and Atlantic sides of the Arctic Ocean. As was the case for October, air temperatures averaged for November were well above average over much of the Arctic Ocean, notably over open water areas. Averaged for the month, total ice extent for November 2020 was the second lowest in the satellite record.

Overview of conditions

sea ice extent for Nov 2020

Figure 1. Arctic sea ice extent for November 2020 was 8.99 million square kilometers (3.47 million square miles). The magenta line shows the 1981 to 2010 average extent for that month. Sea Ice Index data. About the data

Credit: National Snow and Ice Data Center
High-resolution image

As reported in our previous post, sea ice extent averaged for October 2020 was the lowest in the satellite record. While extent increased through November as part of the annual cycle of autumn and winter growth, the November average extent of 8.99 million square kilometers (3.47 million square miles), ended up as second lowest in the satellite record for the month, just above 2016. This was 1.71 million square kilometers (660,000 square miles) below the 1981 to 2010 average and 330,000 square kilometers (127,000 square miles) above the record low of November 2016. Entering December, extent remains especially low over both the Barents and Kara Seas on the Atlantic side and the Chukchi Sea on the Pacific side of the Arctic Ocean.

Conditions in context

Arctic sea ice extent as of December 1, 2020 and several other years for comparison

Figure 2a. The graph above shows Arctic sea ice extent as of December 1, 2020, along with daily ice extent data for five previous years and the record low year. 2020 is shown in blue, 2019 in green, 2018 in orange, 2017 in brown, 2016 in magenta, and 2012 in dashed brown. The 1981 to 2010 median is in dark gray. The gray areas around the median line show the interquartile and interdecile ranges of the data. Sea Ice Index data.

Credit: National Snow and Ice Data Center
High-resolution image

Arctic air temperatures, as a difference from average for November 2020

Figure 2b. This plot shows the departure from average air temperature in the Arctic at the 925 hPa level, in degrees Celsius, for November 2020. Yellows and reds indicate higher than average temperatures; blues and purples indicate lower than average temperatures.

Credit: NSIDC courtesy NOAA Earth System Research Laboratory Physical Sciences Division
High-resolution image

Average sea level pressure, November 2020

Figure 2c. This plot shows average sea level pressure in the Arctic in millibars for November 2020. Yellows and reds indicate high air pressure; blues and purples indicate low pressure.

Credit: NSIDC courtesy NOAA Earth System Research Laboratory Physical Sciences Division
High-resolution image

Arctic Oscillation Index from August 1 to November 30, 2020

Figure 2d. This graph shows the Arctic Oscillation (AO) index from August 1 to November 30, 2020.

Credit: National Centers for Environmental Prediction (NCEP) and National Oceanic and Atmospheric Administration (NOAA)
High-resolution image

Through the month of November 2020, sea ice grew by an average of 116,000 square kilometers (44,800 square miles) per day, which is the fastest daily average growth on record for the month, and 46,400 square kilometers (17,900 square miles) above the 1981 to 2010 average rate. However, growth rates varied greatly through the month. Continuing the pattern for late October, sea ice grew rapidly in the first week of November when the upper ocean lost its remaining summer heat back to the atmosphere and then to outer space. Thereafter, growth rates slowed, with a marked slowdown at the end of the month. Such temporary near pauses in ice growth, however, are not uncommon. As of early December, daily extents were the second lowest in the satellite record, behind 2016. Despite low extent for the Arctic as a whole, the Northern Sea Route along the Russian coast is now covered with ice.

Again continuing the pattern for October, air temperatures at the 925 hPa level (about 2,500 feet above the surface) averaged for November 2020 were above average over much of the Arctic Ocean (Figure 2b). Temperatures were 4 to 6 degrees Celsius (7 to 11 degrees Fahrenheit) above average over the Beaufort and Chukchi Seas, the northern Barents Sea, and the Laptev Sea. By contrast, temperatures at the 925 hPa level over the Canadian Arctic Archipelago were near average.

These air temperature “hot spots” correspond to areas of open water, where the ocean is still releasing large amounts of heat to the lower atmosphere; temperatures at the surface in these areas are locally more than 12 degrees Celsius (22 degrees Fahrenheit) above long-term November averages. Recall that we addressed this issue in our previous post with the aid of vertical profiles of temperature. However, the prevailing atmospheric circulation pattern for November also played a role—sea level pressure was quite low over the Atlantic side of the Arctic, which coupled with high pressure over northern Eurasia, favored the transport of warm air into the Barents, Kara, and Laptev Seas (Figure 2c).

Particularly notable about this sea level pressure pattern is that it manifests a return to a strongly positive phase of the Arctic Oscillation (AO) (Figure 2d). Recall from a previous post that much of the 2019 to 2020 winter was characterized by a positive AO phase. As of late November 2020, the AO index had regressed back to a neutral phase; whether this is temporary remains to be seen.

November 2020 compared to previous years

November rate of sea ice decline from 1978 to 2020

Figure 3. Monthly November ice extent for 1978 to 2020 shows a decline of 5.1 percent per decade.

Credit: National Snow and Ice Data Center
High-resolution image

Including 2020, the linear rate of decline for November sea ice extent is 5.1 percent per decade. This corresponds to a downward trend of 54,800 square kilometers (21,200 square miles) per year, or losing an area about the size of the state of West Virginia each year. Over the 42-year satellite record, the Arctic has lost about 2.30 million square kilometers (888,000 square miles) of ice in November, based on the difference in linear trend values in 2020 and 1978. This is comparable to about three times the size of Texas.

42 years of satellite data

Figure X. Monthly extent (thin lines) for Arctic (blue) and Antarctic (red) and 12-month trailing average (thick lines) for standardized anomalies (departure from the 1981 to 2010 average in each month divided by the 1981 to 2010 standard deviation for the month). The linear trend is overlaid in dashed lines. The trend values are provided below the plot, in # of standard deviations per decade with the +/- 95% confidence level; both trends are statistically significant. ||Credit: W. Meier, NSIDC|High-resolution image

Figure 4. This graph shows monthly extent (thin lines) for Arctic (blue) and Antarctic (red) and 12-month trailing average (thick lines) for standardized anomalies (departure from the 1981 to 2010 average in each month divided by the 1981 to 2010 standard deviation for the month). The linear trend is overlaid in dashed lines. The trend values are provided below the plot, in number of standard deviations per decade with the +/- 95 percent confidence level; both trends are statistically significant.

Credit: W. Meier, NSIDC
High-resolution image

The modern passive microwave satellite data started in late October 1978. November 2020 marks the start of 43 years of continuous and consistent observation of sea ice concentration and extent. The first 42 years of monthly extents from November 1978 through October 2020 provide a comparison of the trends and variability in the Arctic and Antarctic sea ice extent. By comparing each month’s departure from the 1981 to 2010 average for that month, the variability of sea ice extent becomes strongly evident (Figure 4). Here we remove the seasonal cycle of sea ice extent by dividing the departure from average of each month in the satellite record by the standard deviation of each month, both based on the climatological period of 1981 to 2010. The result is a time series of the number of standard deviations each month’s extent in the record is above or below the average. The plot for the Arctic reveals a clear downward trend with some monthly and annual variations. Overall, the Arctic ice extent has decreased by 0.97 standard deviations per decade. By contrast, the Antarctic ice extent is dominated by a lot of variation with a positive trend of 0.17 standard deviations per decade. The magnitude of the Arctic trend is hence roughly five times of the Antarctic trend. The large Antarctic variation is marked particularly by the dramatic reversal from record high extents in 2014 and 2015 to record low extents in 2016 and 2017. Since then, the extent has moderated to near-average conditions.

Antarctica: More ice, sparse ice, and Maud’s back

Sea ice concentration around Antarctica on Nov 30 2020

Figure 5. This map of Antarctica show sea ice concentration on November 30, 2020. The Japanese Aerospace Exploration Agency (JAXA) Advanced Microwave Scanning Radiometer-2 (AMSR2) shows a range from 0 percent (dark blue) to 100 percent (dark purple) in sea ice concentration. Several small shore polynyas, or openings in sea ice, are visible along the East Antarctic coast.

Credit: University of Bremen
High-resolution image

Antarctic sea ice extent for November 2020 continues to be well above the 1981 to 2010 average, a shift that began in August, with particularly above average extent in the Weddell Sea. However, low sea ice concentration dominates a large area of the Weddell Sea (Figure 5). Also notable is the retreat of ice along the eastern shore of the Antarctic Peninsula, a result of several warm chinook wind events off the Peninsula earlier in November. These strong winds blast warm and dry air downhill, pushing sea ice a tens of kilometers off the coast. On the western side of the Antarctic Peninsula, the reduced sea ice extent in the Bellingshausen Sea and its sharp ice edge add further evidence of strong winds from the northwest. The adjacent Amundsen Sea and Ross Sea have above average ice extent, while below average extent is the rule along the Wilkes, Adelie, and Enderby Land coasts. Numerous small shore polynyas, or openings in sea ice, typical for this time of year, are present along the East Antarctic coast.

There are also open water areas in the Maud Rise region, initiating a few degrees east of the prime meridian and around 64 degrees S latitude. This recurring polynya reopened, where sea ice concentration dropped below 15 percent, on November 26, as well as a second less common polynya several hundred kilometers to the north and west.

Ocean waves in November—in the Arctic

A vast area of the Arctic Ocean remains ice free as November begins, far later in the season than is typical. The monthly average ice extent for October is the lowest in the satellite record. On October 24, a record difference was set in daily ice extent relative to the 1981 to 2010 average. Large heat transfers from the open water to the atmosphere have manifested as above-average air temperatures near the surface of the ocean.

Overview of conditions

Figure 1. Arctic sea ice extent for October 2020 was 5.28 million square kilometers (2.04 million square miles). The magenta line shows the 1981 to 2010 average extent for that month. Sea Ice Index data. About the data||Credit: National Snow and Ice Data Center|High-resolution image

Figure 1. Arctic sea ice extent for October 2020 was 5.28 million square kilometers (2.04 million square miles). The magenta line shows the 1981 to 2010 average extent for that month. Sea Ice Index data. About the data

Credit: National Snow and Ice Data Center
High-resolution image

Sea ice extent for October 2020 was 5.28 million square kilometers (2.04 million square miles), placing it lowest in the satellite record for the month. This was 3.07 million square kilometers (1.19 million square miles) below the 1981 to 2010 October average and 450,000 square kilometers (173,700 square miles) below the record low mark for October set in 2019. October 2020 is the largest departure from average conditions seen in any month thus far in the satellite record, falling 3.69 standard deviations below the 1981 to 2010 mean. Ice extent is far below average in all of sectors of the Eurasian side of the Arctic Ocean and in Baffin Bay.

Conditions in context

Figure 2a. The graph above shows Arctic sea ice extent as of November 3, 2020, along with daily ice extent data for four previous years and the record low year. 2020 is shown in blue, 2019 in green, 2018 in orange, 2017 in brown, 2016 in purple, and 2012 in dashed brown. The 1981 to 2010 median is in dark gray. The gray areas around the median line show the interquartile and interdecile ranges of the data. Sea Ice Index data.||Credit: National Snow and Ice Data Center|High-resolution image

Figure 2a. The graph above shows Arctic sea ice extent as of November 3, 2020, along with daily ice extent data for four previous years and the 2012 record low year. 2020 is shown in blue, 2019 in green, 2018 in orange, 2017 in brown, 2016 in purple, and 2012 in dashed brown. The 1981 to 2010 median is in dark gray. The gray areas around the median line show the interquartile and interdecile ranges of the data. Sea Ice Index data.

Credit: National Snow and Ice Data Center
High-resolution image

Figure 2b. This plot shows the departure from average air temperature in the Arctic at the 925 hPa level, in degrees Celsius, for October 2020. Yellows and reds indicate higher than average temperatures; blues and purples indicate lower than average temperatures.||Credit: NSIDC courtesy NOAA Earth System Research Laboratory Physical Sciences Division| High-resolution image

Figure 2b. This plot shows the departure from average air temperature in the Arctic at the 925 hPa level, in degrees Celsius, for October 2020. Yellows and reds indicate higher than average temperatures; blues and purples indicate lower than average temperatures.

Credit: NSIDC courtesy NOAA Earth System Research Laboratory Physical Sciences Division
High-resolution image

Figure 2c. This plot shows average sea level pressure in the Arctic in millibars (hPa) for October 2020. Yellows and reds indicate high air pressure; blues and purples indicate low pressure.||Credit: NSIDC courtesy NOAA Earth System Research Laboratory Physical Sciences Division| High-resolution image

Figure 2c. This plot shows average sea level pressure in the Arctic in millibars (hPa) for October 2020. Yellows and reds indicate high air pressure; blues and purples indicate low pressure.

Credit: NSIDC courtesy NOAA Earth System Research Laboratory Physical Sciences Division
High-resolution image

Throughout the month, sea ice grew by an average of 71,200 square kilometers (27,500 square miles) per day, which is close to the average rate for 1981 to 2010. For the first three weeks of October, however, growth rates were well below average, around 51,600 square kilometers (19,900 square miles) per day. Following the pattern of recent years, growth became very rapid late in the month, averaging around 134,000 square kilometers (51,700 square miles) per day. From October 13 into early November, the daily sea ice extent was the lowest for that day in the satellite record. Sea ice growth in the last 10 days of the month was mostly along the Siberian coast, extending northward, and along the Eurasian side of the sea ice pack, extending southward. Based on passive microwave data, the Northern Sea Route remained open through nearly all of October.

Air temperatures at the 925 hPa level (about 2,500 feet above the surface) were 4 to 5 degrees Celsius (7 to 9 degrees Fahrenheit) above average for the month across much of the Central and Western Arctic Ocean and the Siberian Arctic coast, as well as over Northern Greenland. Elsewhere in the Arctic and the northernmost Atlantic regions, temperatures were near average to slightly below average. Temperatures in Central Canada were 1 to 4 degrees Celsius (2 to 7 degrees Fahrenheit) below average (Figure 2b).

The average sea level pressure pattern for October was characterized by below-average pressure over the Northern Atlantic Ocean and Laptev and Bering Seas, driving winds northward toward the Lena River region, Barents Sea, and Novaya Zemlya. Below-average pressure also occurred over the Hudson Bay (Figure 2c).

October 2020 compared to previous years

Figure 3. Monthly October ice extent for 1979 to 2020 shows a decline of 10.11 percent per decade.||Credit: National Snow and Ice Data Center| High-resolution image

Figure 3. Monthly October ice extent for 1979 to 2020 shows a decline of 10.1 percent per decade.

Credit: National Snow and Ice Data Center
High-resolution image

Including 2020, the linear rate of decline for October sea ice extent is 10.1 percent per decade. This corresponds to a downward trend of -84,400 square kilometers (32,600 square miles) per year, or losing an area about the size of South Carolina each year. Over the 42-year satellite record, the Arctic has lost about 3.45 million square kilometers (1.33 million square miles) of ice in October, based on the difference in linear trend values in 2019 and 1979. This is comparable to twice the size of the state of Alaska.

Increasing departures from average in autumn

Figure 4a. With longer periods of open water during spring and summer, more solar energy is absorbed within the upper part of the ocean. This delays sea ice formation because before ice can form, the ocean must lose this heat to the atmosphere and then to space. This excess heat transferred to the atmosphere can be seen in a vertical profile of temperature by latitude along longitude 140 to 170 degrees E, which is shown in this plot.||Credit: NCEP/NCAR Reanalysis| High-resolution image

Figure 4a. This figure shows a profile of temperature (in color) for the lower half of the atmosphere (500 to 1,000 millibars, or about 18,000 feet to the surface) versus latitude, averaged along a swath of longitudes from 140 to 170 degrees E. With longer periods of open water during spring and summer, more solar energy is absorbed within the upper part of the ocean. This delays sea ice formation because before ice can form, the ocean must lose this heat to the atmosphere and then to space. This excess heat transferred to the atmosphere can be seen as the warm (red) layer over the open water region.

Credit: NCEP/NCAR Reanalysis
High-resolution image

Figure 4b. A delay in Arctic sea ice growth in autumn tends to lead to large departures from average in sea ice extent after the summer minimum and particularly in the month of October. The five lowest September extent minima (2007, 2012, 2016, 2019, and 2020) all show large departures in October extent compared to the reference period. This plot shows Arctic sea ice extent anomalies for those five years from June to December compared with the 1981 to 1990 average, 1991 to 2000 average, and the 2001 to 2010 average.||Credit: NSIDC| High-resolution image

Figure 4b. A delay in Arctic sea ice growth in autumn tends to lead to large departures from average in sea ice extent after the summer minimum and particularly in the month of October. The five lowest September extent minima (2007, 2012, 2016, 2019, and 2020) all show large departures in October extent compared to the reference period. This plot shows Arctic sea ice extent anomalies for those five years from June to December compared with the 1981 to 1990 average, 1991 to 2000 average, and the 2001 to 2010 average.

Credit: National Snow and Ice Data Center
High-resolution image

Figure 4c. This chart shows monthly sea ice extent anomaly (difference from the 1981 to 2010 average) for 1979 to October 2020. Low sea ice extent in autumn is shown as deep blue periods in several years beginning in 2007.||Credit: NSIDC| High-resolution image

Figure 4c. This chart shows monthly sea ice extent anomaly (difference from the 1981 to 2010 average) for 1979 to October 2020. Deep blue colors depict low autumn sea ice extent over the past 15 years.

Credit: National Snow and Ice Data Center
High-resolution image

On October 24, Arctic sea ice extent had its largest departure from the 1981 to 2010 average of daily sea ice extent in the 42-year continuous satellite record, at 3.4 million square kilometers (1.31 million square miles). With longer periods of open water during spring and summer, more solar energy is absorbed within the upper few tens of meters of the ocean. This has the effect of delaying sea ice formation—before ice can form, the ocean must lose this heat to the atmosphere and then to space (Figure 4a).

The delay in ice regrowth leads to large departures from average in sea ice extent in the time after the summer minimum and particularly in the month of October. The five lowest September extent minima (2007, 2012, 2016, 2019, and 2020) all show large departures in October extent compared to the reference period (Figure 4b).

This excess heat transferred to the atmosphere can be seen in a vertical profile of temperature by latitude along longitude 140 to 170 degrees E, which cuts though the open water area along the Eurasian coast (Figure 4a). In the past two decades, high autumn temperatures over the open water here have strongly contributed to Arctic Amplification—the larger rise in air temperatures over the Arctic compared to the rest of the globe. However, the anomalous warmth is largely limited to near the surface of the ocean.

Northern Sea Route shipping rises as sea ice falls

Figure 5. This chart shows Northern Sea Route (NSR) shipping traffic for August 2020 and other shipping information for that region. Track color legend is shown in the lower right. Transits through the NSR are shown in red, departing or arriving at the Arctic coastal ports in blue and green, and port-to-port within the Arctic is shown in yellow. The increase in August activity between 2018, 2019, and 2020 is shown in the bar chart at upper left. ||Credit: CHNL Information Office at Nord University| High-resolution image

Figure 5. This chart shows Northern Sea Route (NSR) shipping traffic for August 2020 and other shipping information for that region. Track color legend is shown in the lower right. Transits through the NSR are shown in red, departing or arriving at the Arctic coastal ports in blue and green, and port-to-port within the Arctic is shown in yellow. The increase in August activity between 2018, 2019, and 2020 is shown in the bar chart at upper left.

Credit: Center for High North Logistics Information Office at Nord University
High-resolution image

Commercial shipping along the Northern Sea Route of the Russian north coast is increasing. This includes complete transits from Europe to East Asia, local shipping within the Arctic Ocean, and deliveries of liquefied natural gas from gas fields in the Yamal Peninsula to ports in both Europe and East Asia. The years 2019 and 2020 saw significantly increased shipping activity compared with 2018. 2020 had slightly more shipping than 2019 when comparing August shipping from both years. The shipping traffic map shows the importance of passages just north of the Taymyr Peninsula and near the New Siberian Islands on either side of the Laptev Sea; these are generally the last areas to clear of ice, and only in the warmest years. However, in 2020, the Northern Sea Route was essentially ice free from mid-July through about October 25. Icebreaker and ice-hardened tankers made several voyages within the route as early as June.

Looking to the south

Figure 6. This figure shows the Japanese Aerospace Exploration Agency (JAXA) Advanced Microwave Scanning Radiometer 2 (AMSR2) sea ice concentration for Antarctic sea ice on October 31, 2020. Antarctic sea ice extent reached its seasonal sea ice extent maximum of 18.95 million square kilometers (7.32 million square miles) on September 28, 2020. Sea Ice Index data. About the data||Credit: University of Bremen|High-resolution image

Figure 6. This figure shows the Japanese Aerospace Exploration Agency (JAXA) Advanced Microwave Scanning Radiometer 2 (AMSR2) sea ice concentration for Antarctic sea ice on October 31, 2020. Antarctic sea ice extent reached its seasonal sea ice extent maximum of 18.95 million square kilometers (7.32 million square miles) on September 28, 2020. Sea Ice Index data. About the data

Credit: University of Bremen
High-resolution image

Antarctic sea ice extent reached its seasonal maximum of 18.95 million square kilometers (7.32 million square miles) on September 28, as was tentatively reported in the October post. The maximum extent was the eleventh highest in the satellite record. Since then, Antarctic sea ice has declined by 1.30 million square kilometers (502,000 million square miles), but at a rate slightly slower than the average, resulting in a slight increase in the difference between the daily sea ice extent and the 1981 to 2010 average. Sea ice extent is above average along a wide area of the Ross Sea and Wilkes Land coast, and in the Eastern Weddell Sea. It is slightly below average in the Bellingshausen and Amundsen Seas. Notably, in the last few days of the month, sea ice concentration dropped in the area of the Maud Rise and in an area near the front of the Amery Ice Shelf.

Lingering seashore days

Following the sea ice extent minimum on September 15, 2020, expansion of the ice edge has been most notable in the northern Chukchi and Beaufort Seas. The ice edge along the Laptev Sea continued to retreat farther. Antarctic sea ice has climbed to its highest extent since 2014; it may have reached its maximum on September 28, but it is too soon to say for sure.

Overview of conditions

September average sea ice extent in Arctic

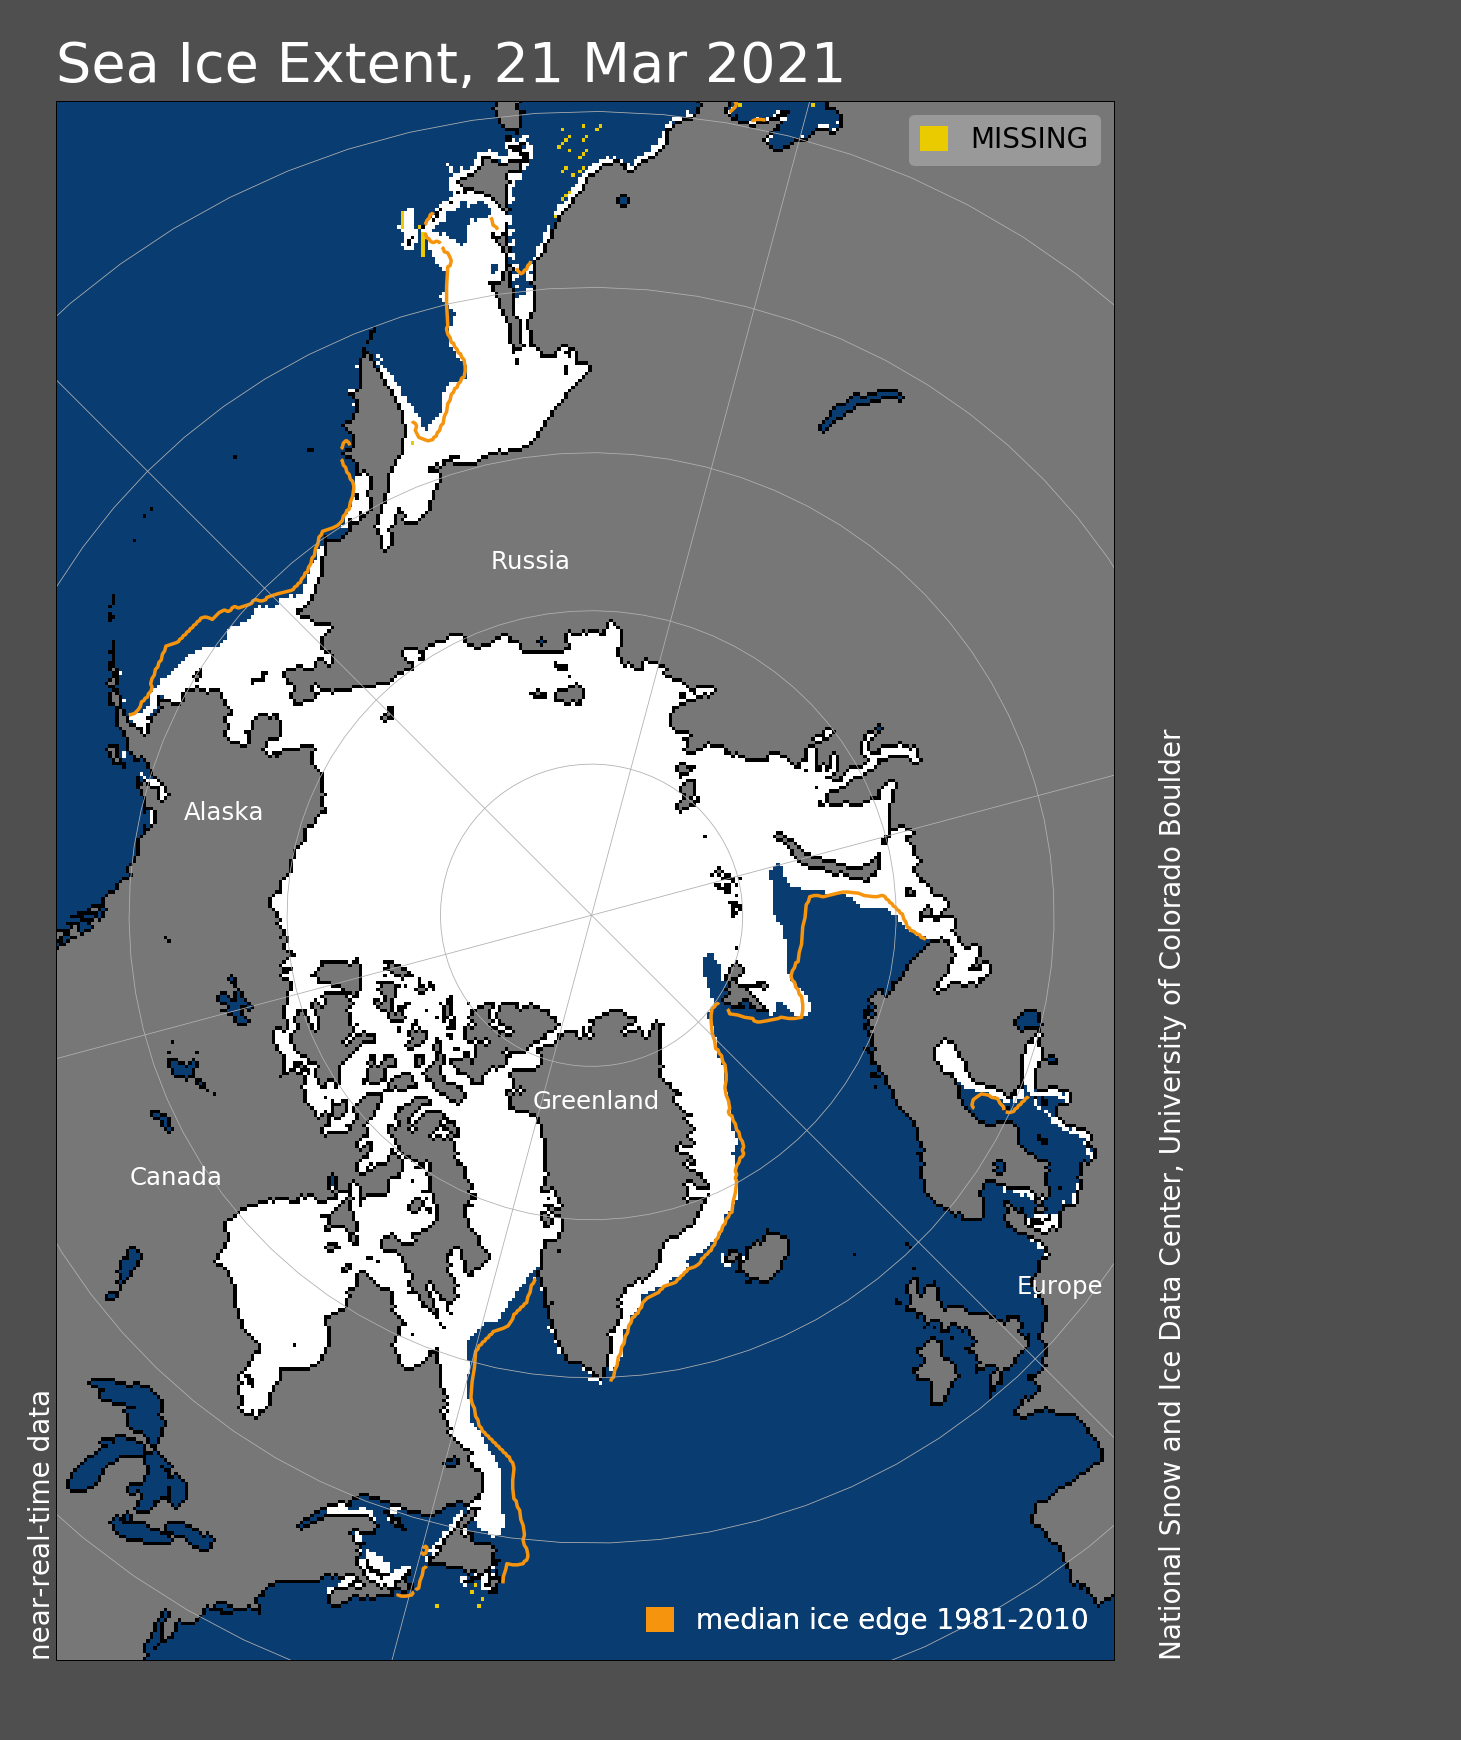
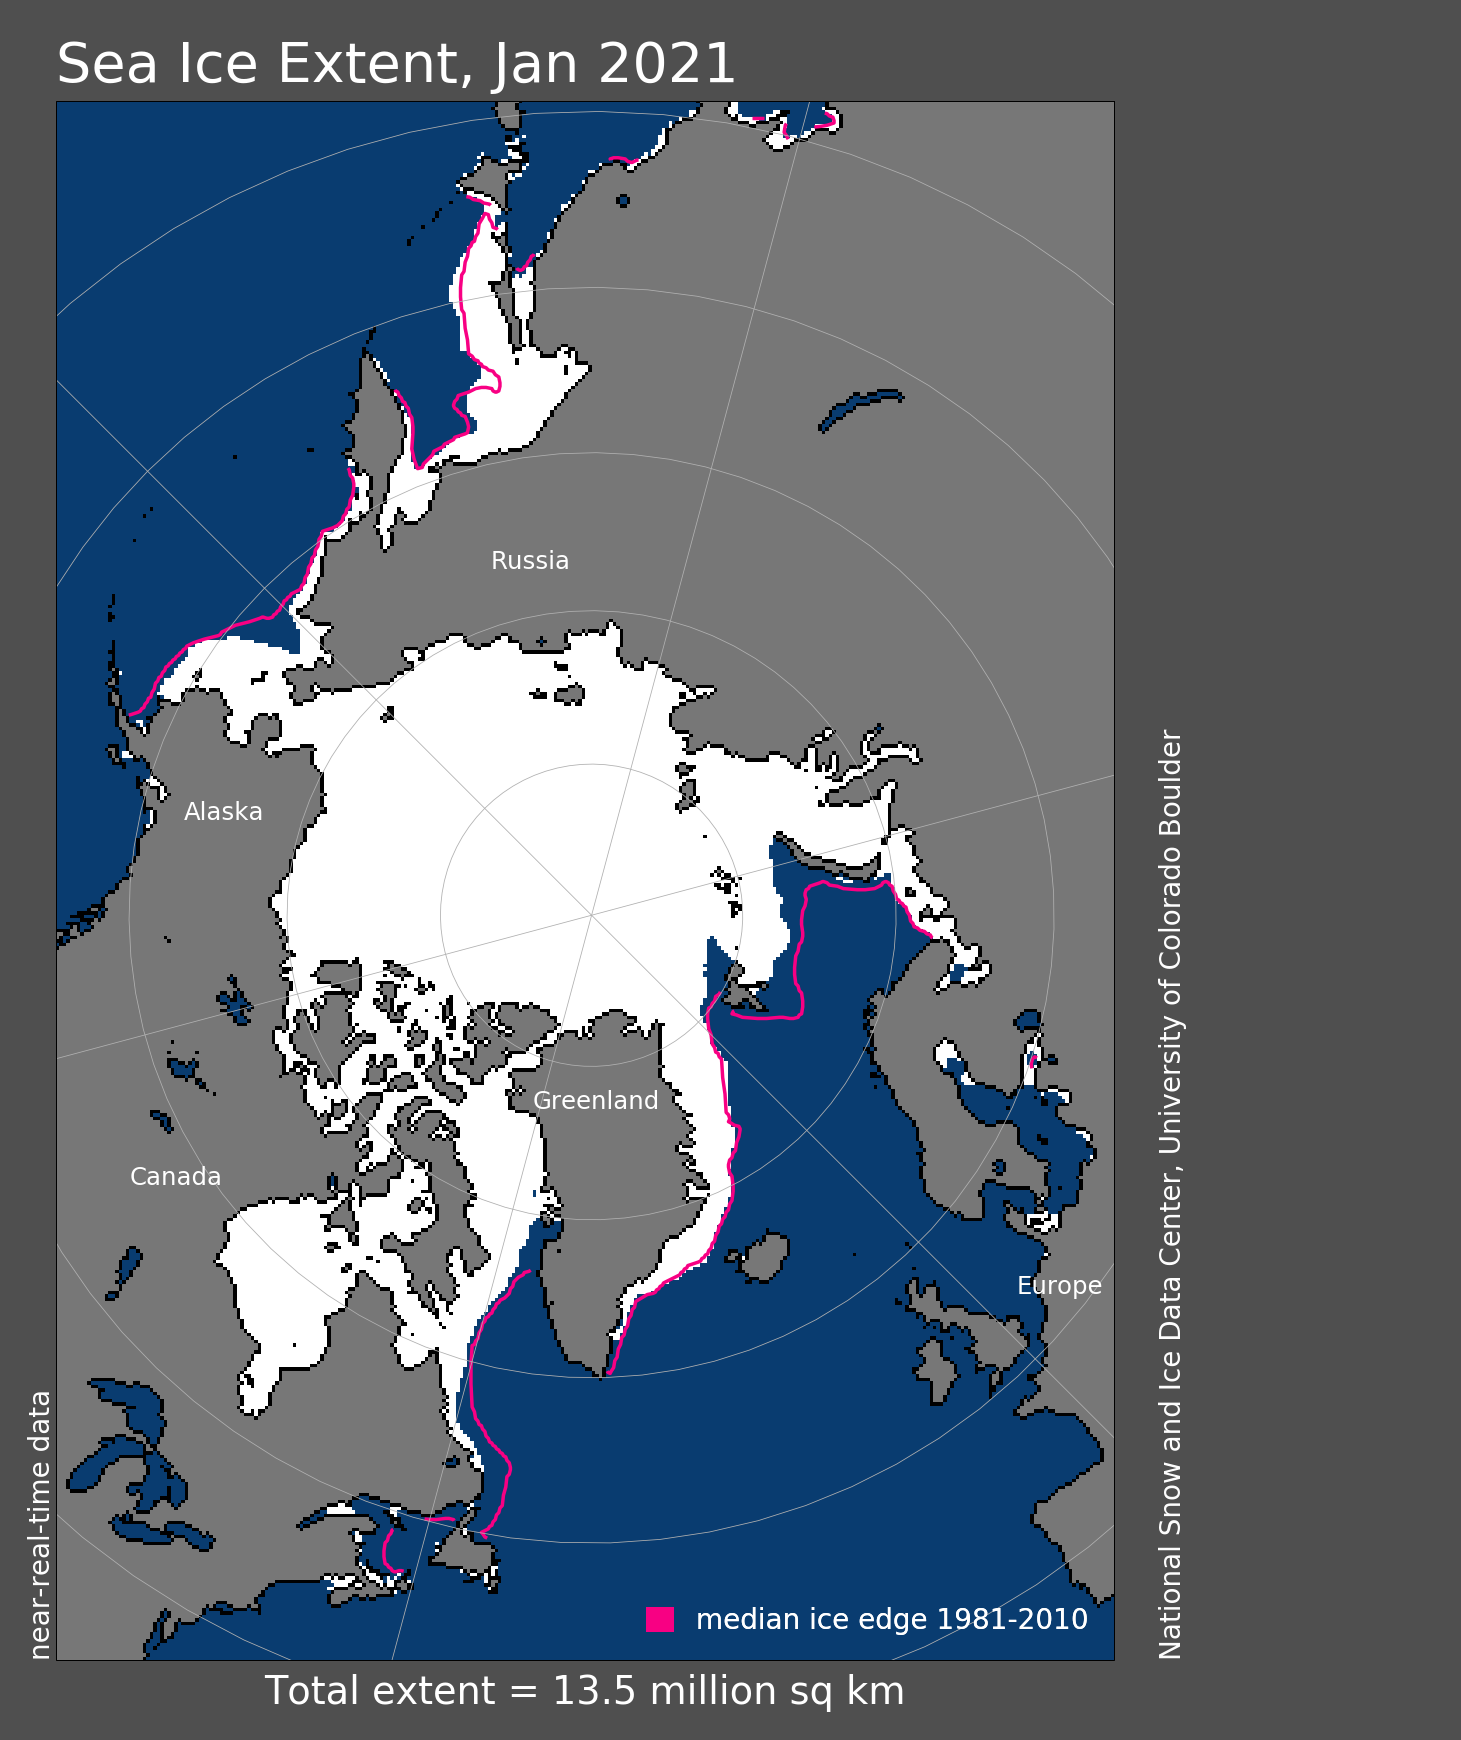
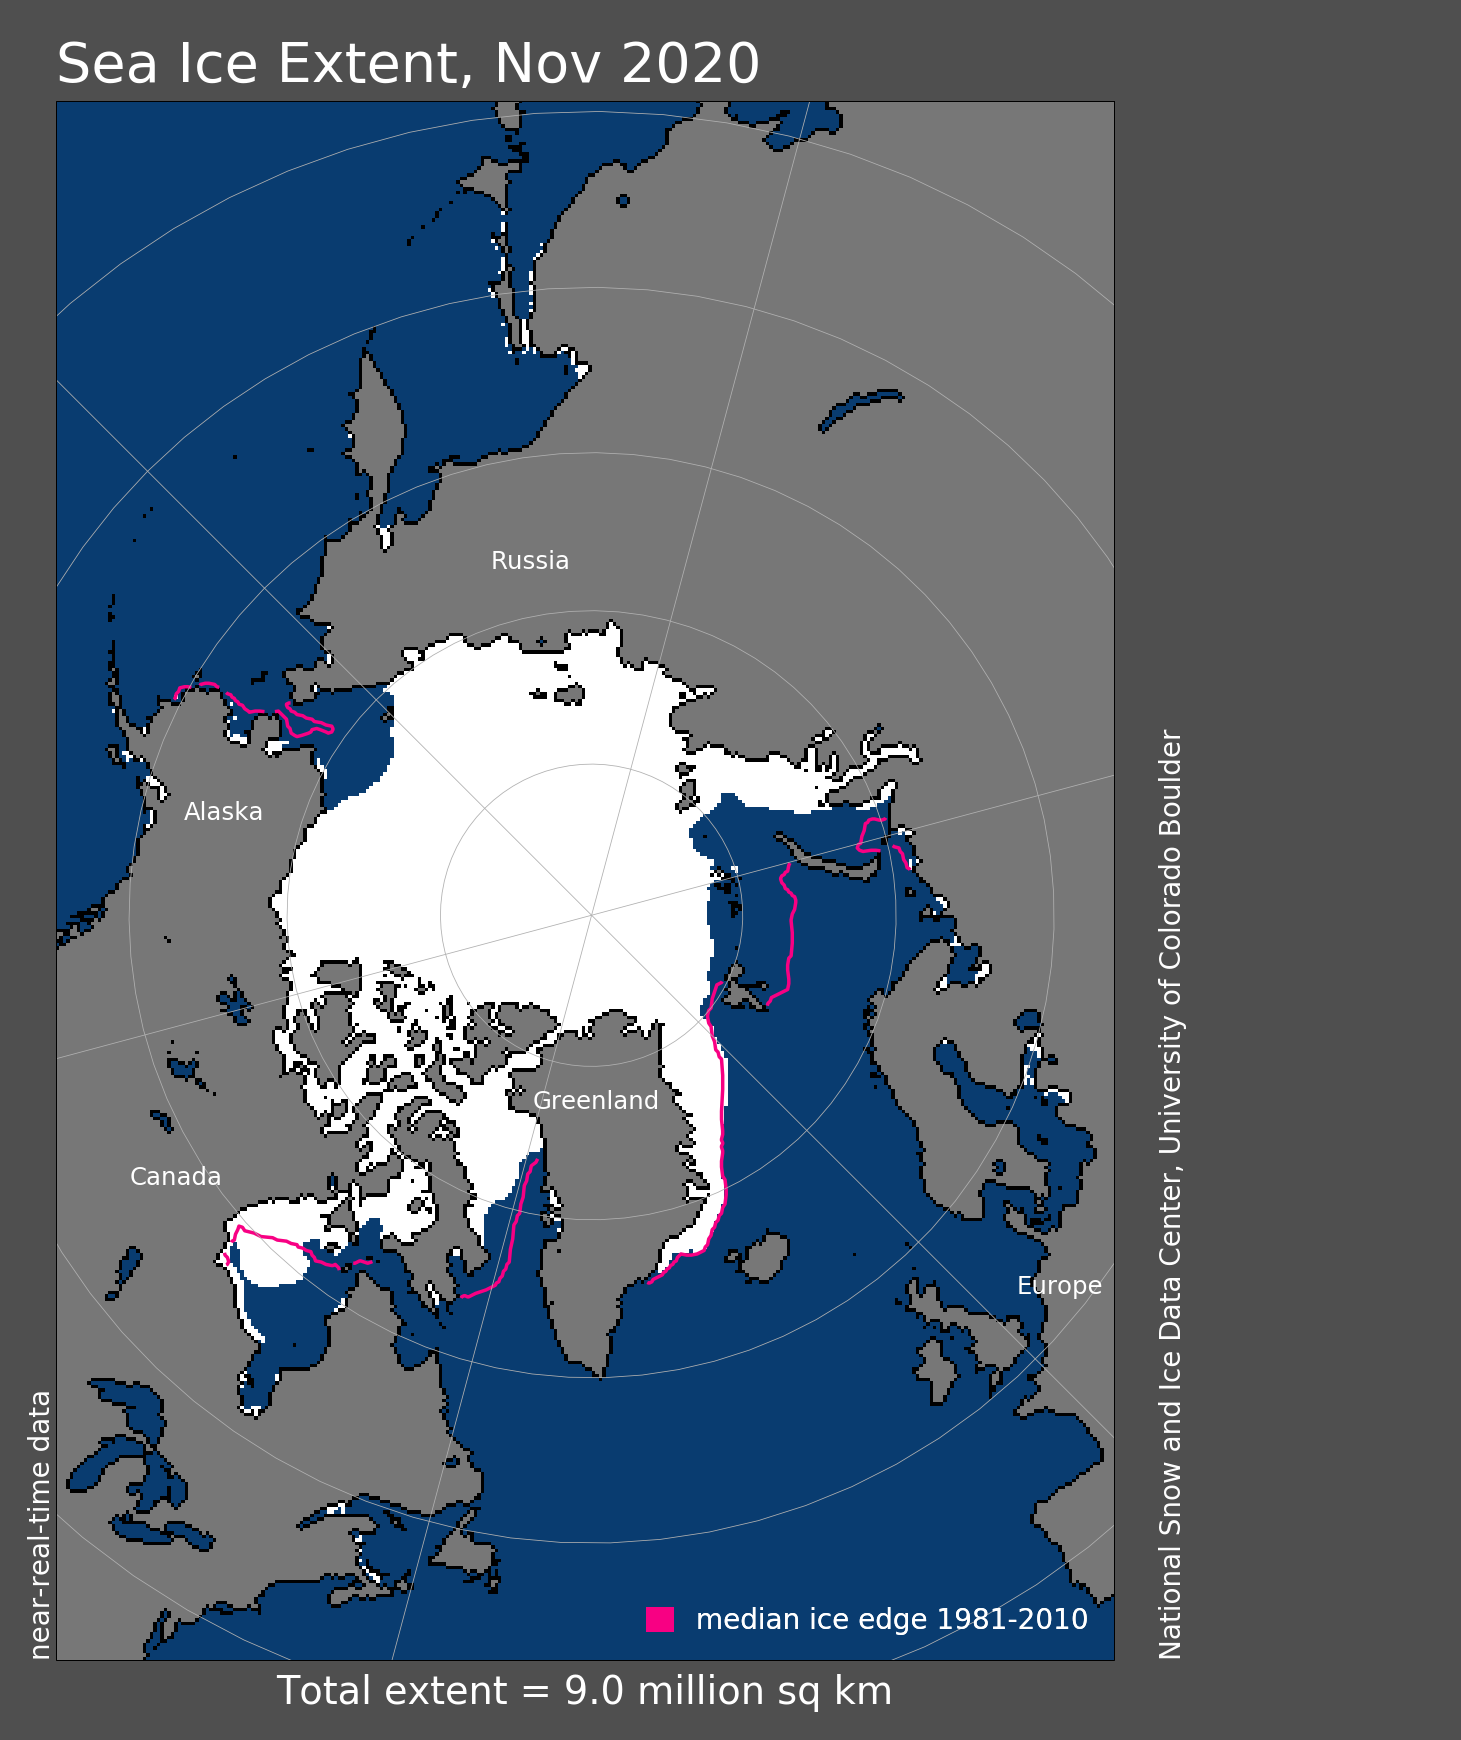
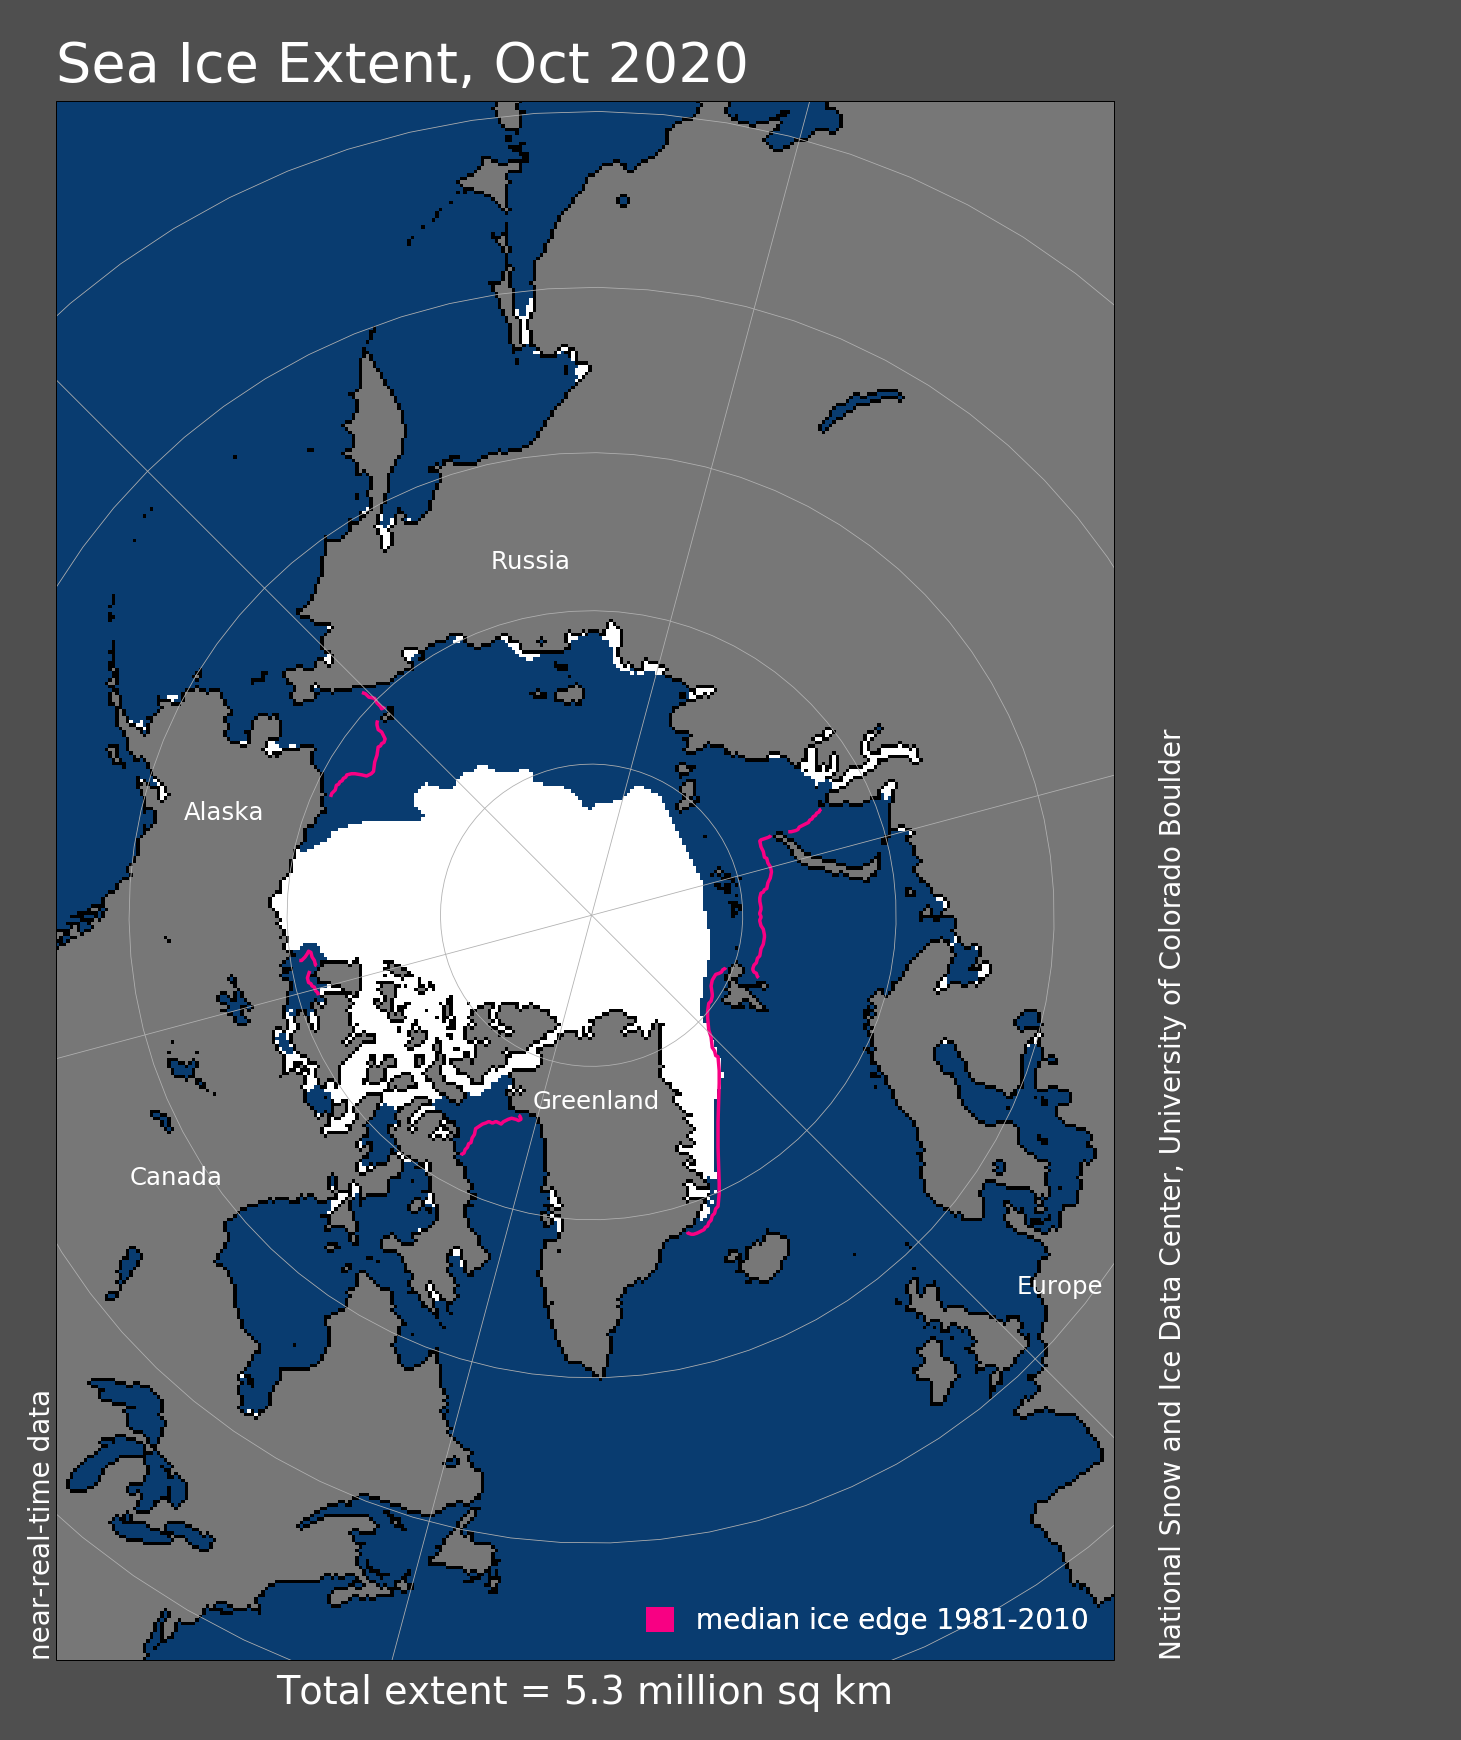
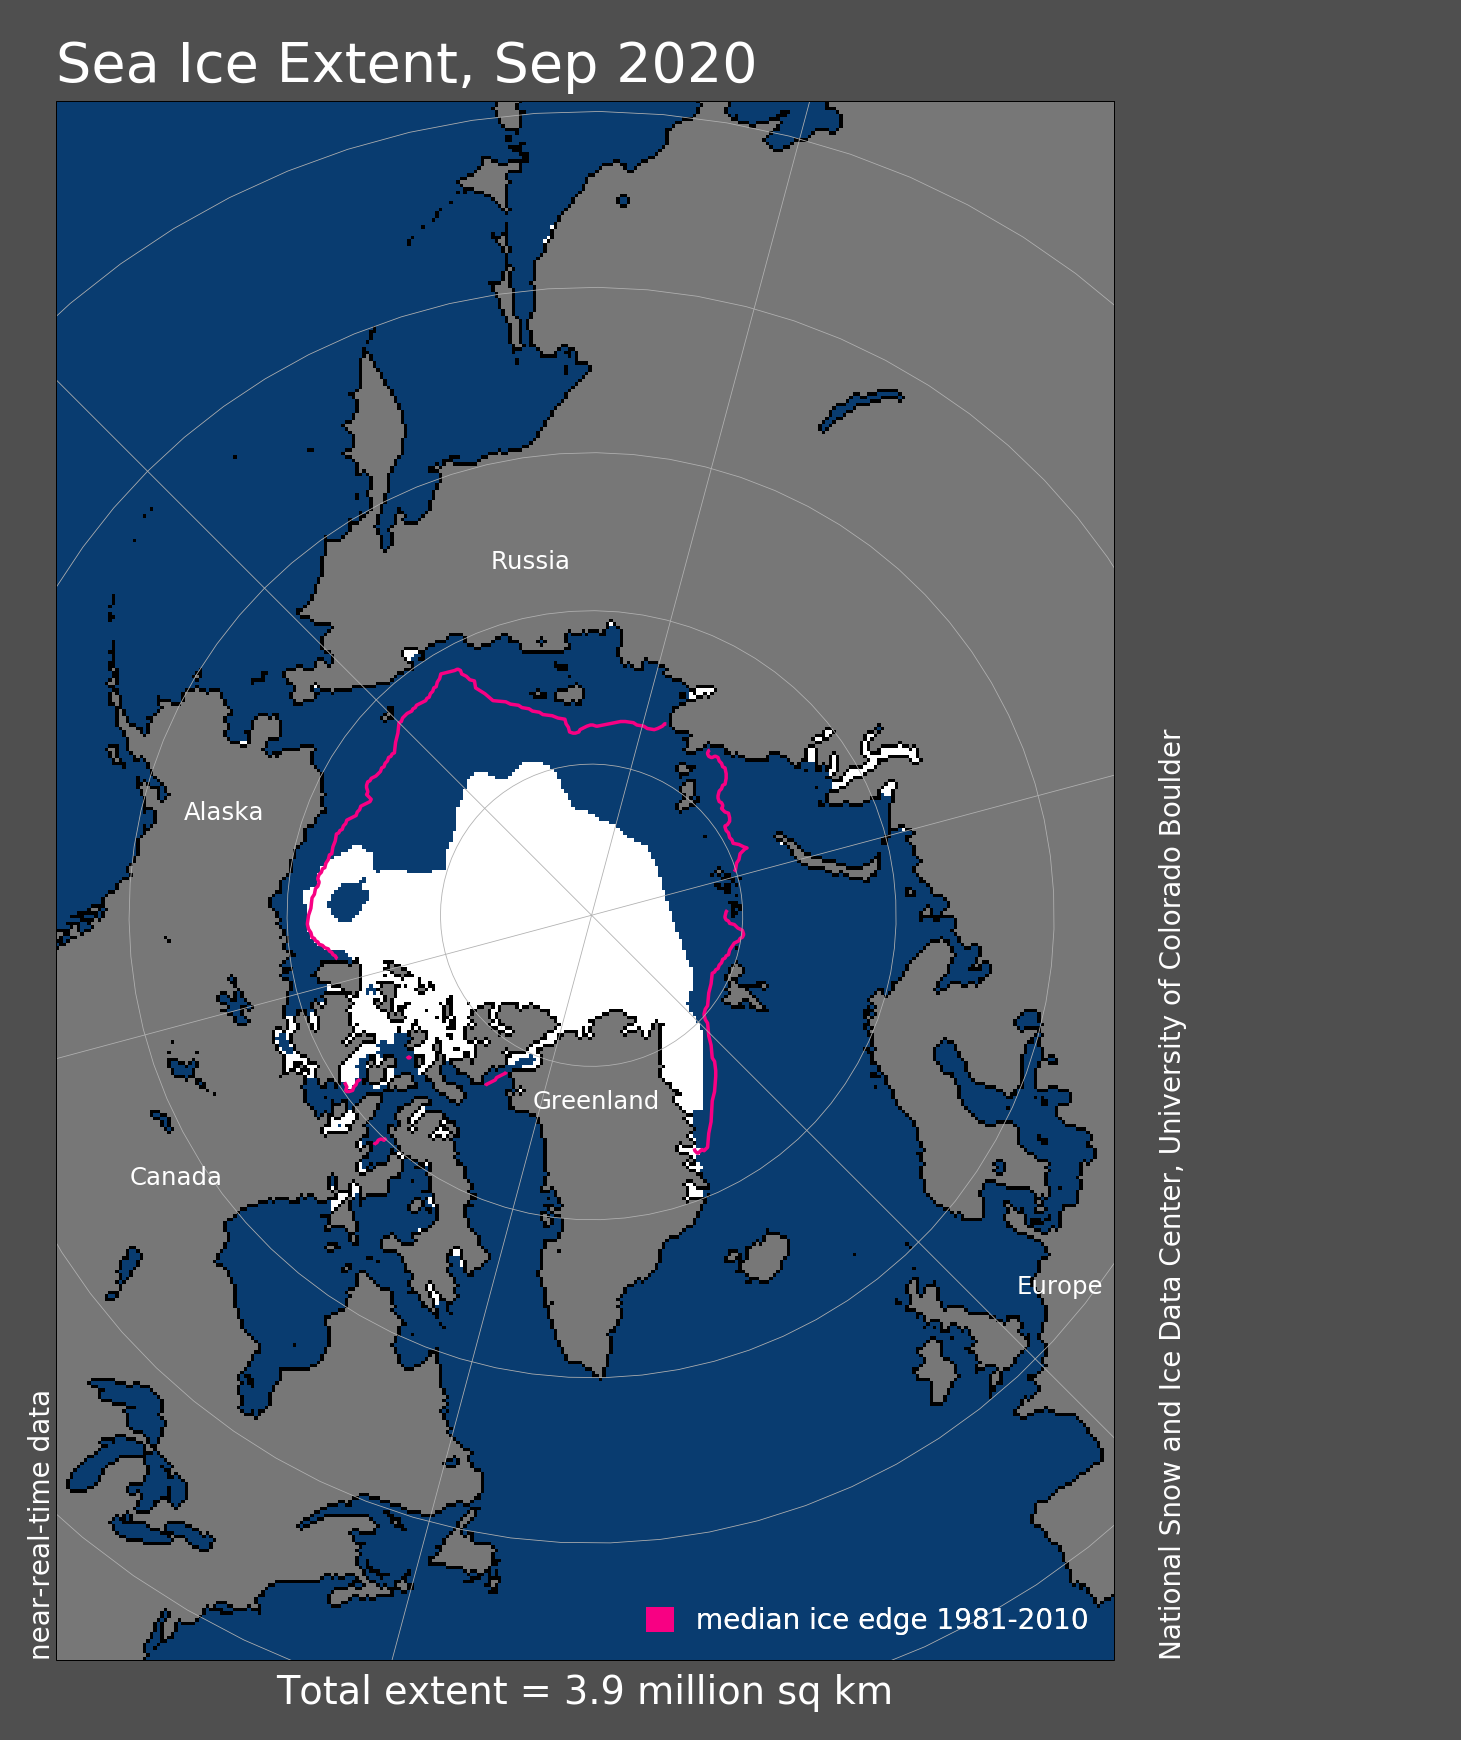
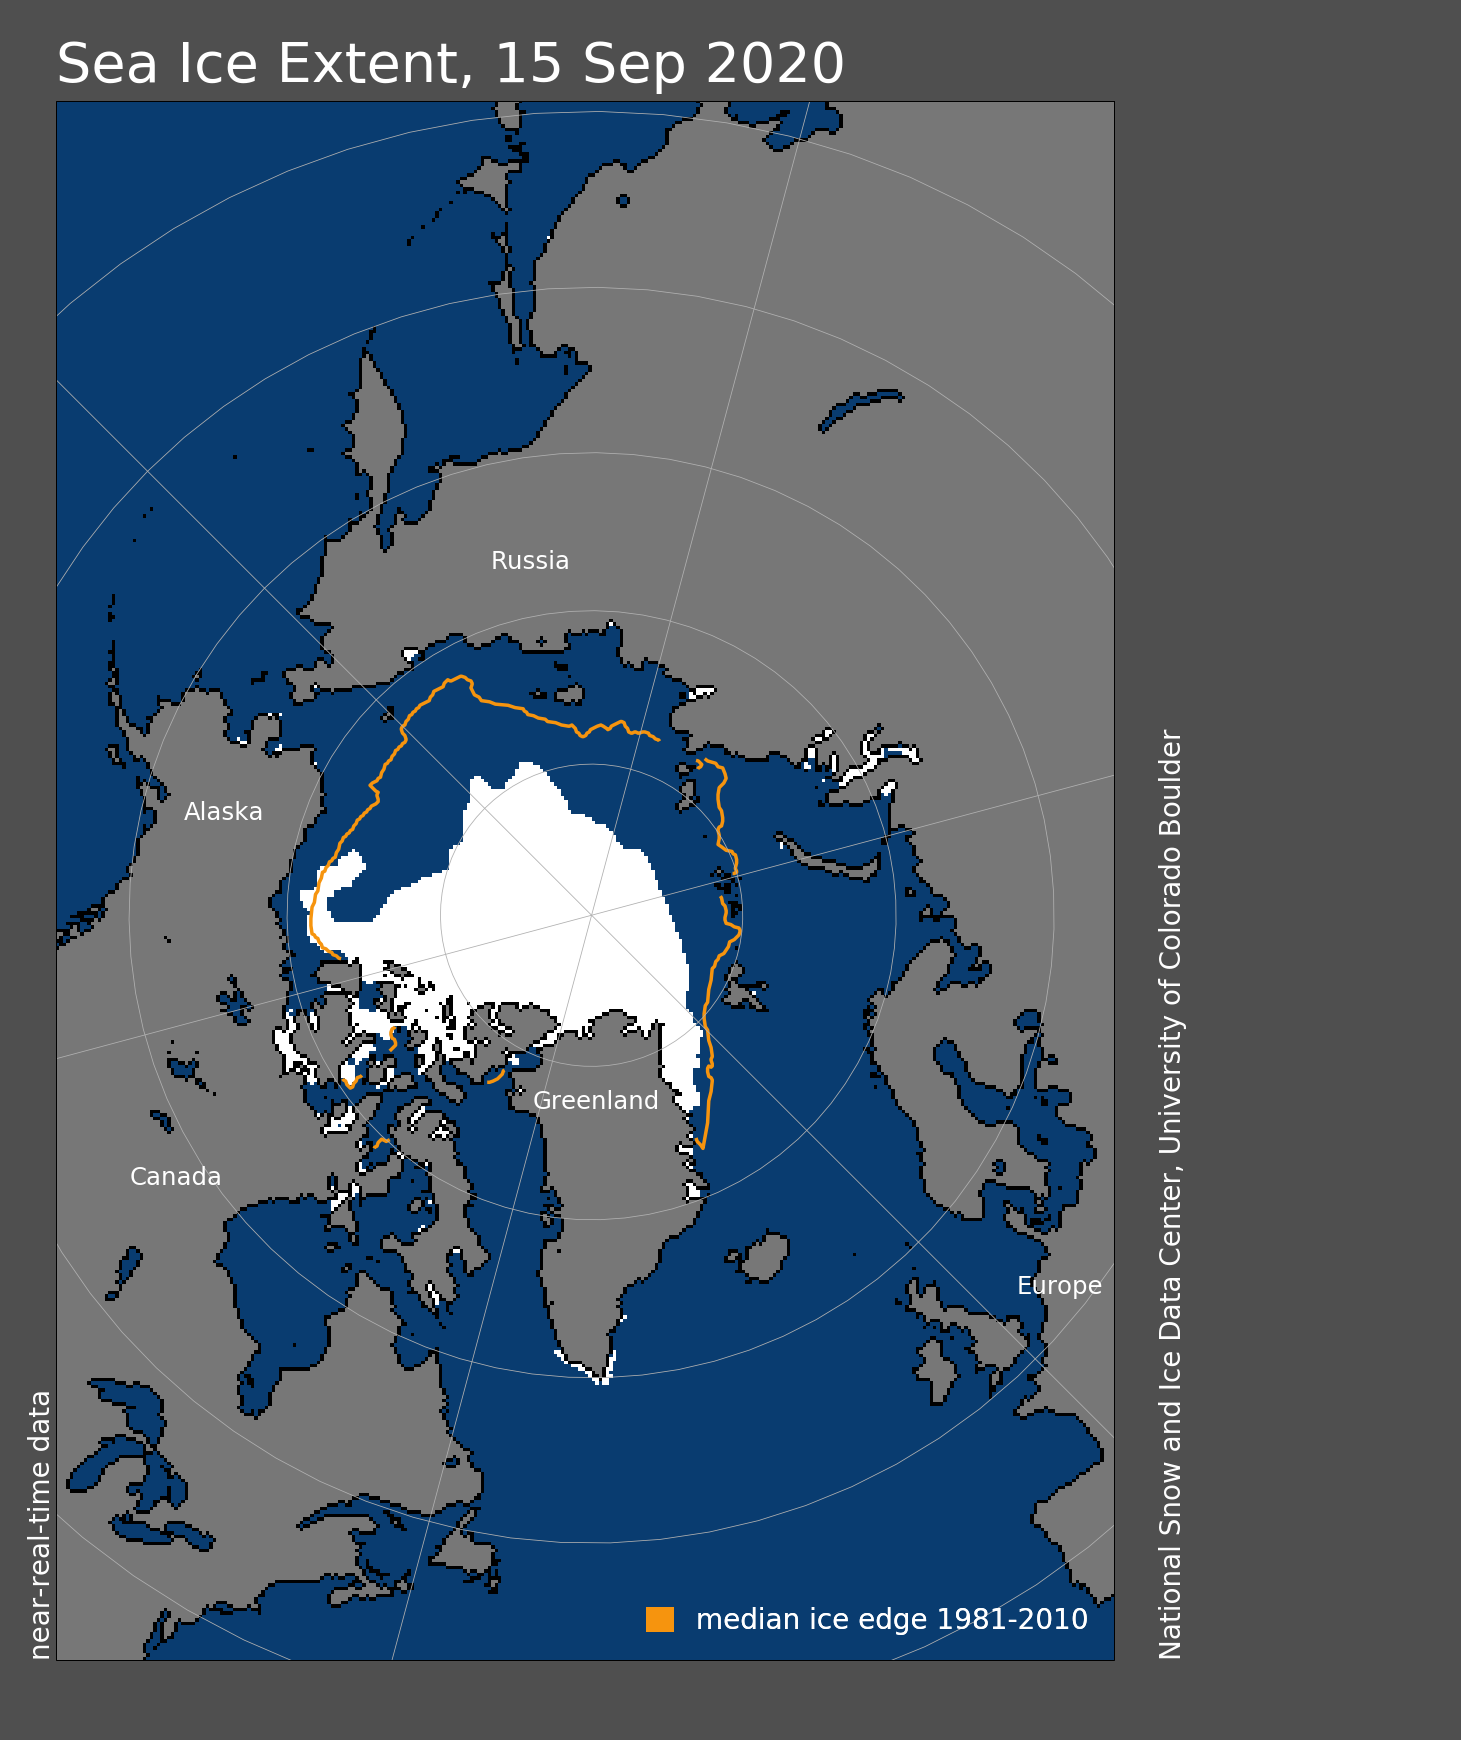
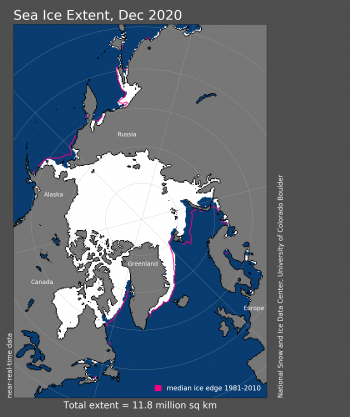
Figure 1. Arctic sea ice extent for September 2020 was 3.92 million square kilometers (1.51 million square miles). The magenta line shows the 1981 to 2010 average extent for that month. Sea Ice Index data. About the data

Credit: National Snow and Ice Data Center
High-resolution image

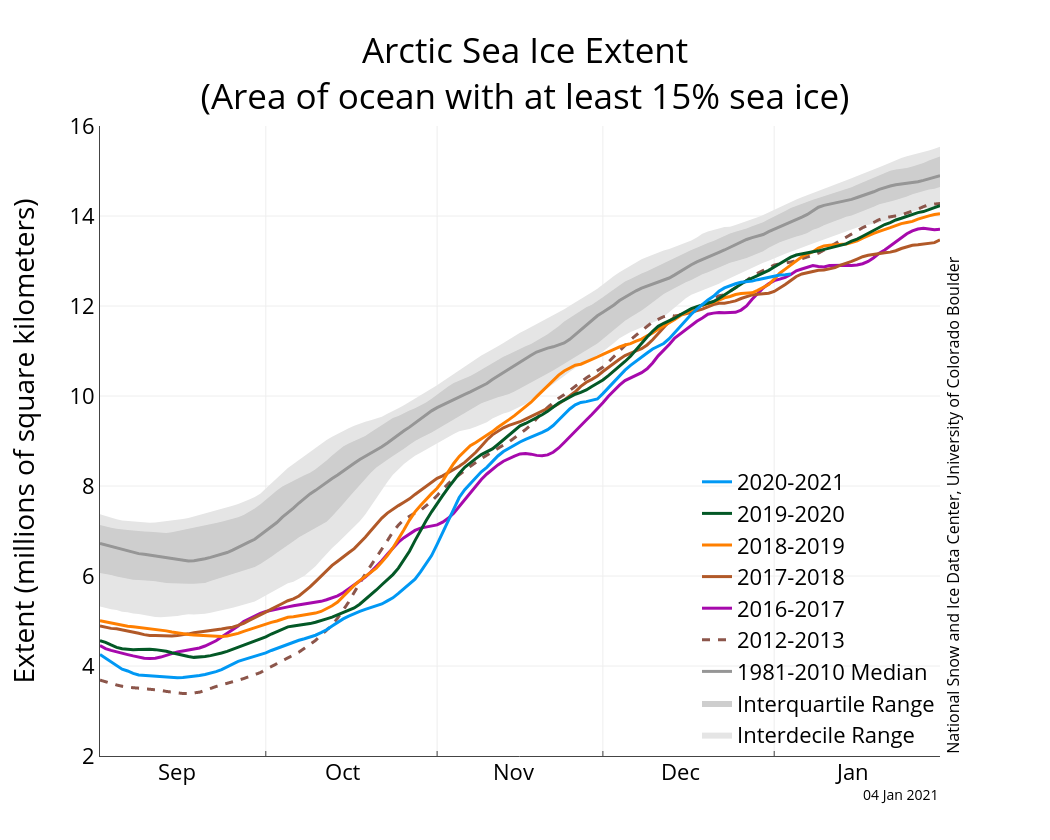
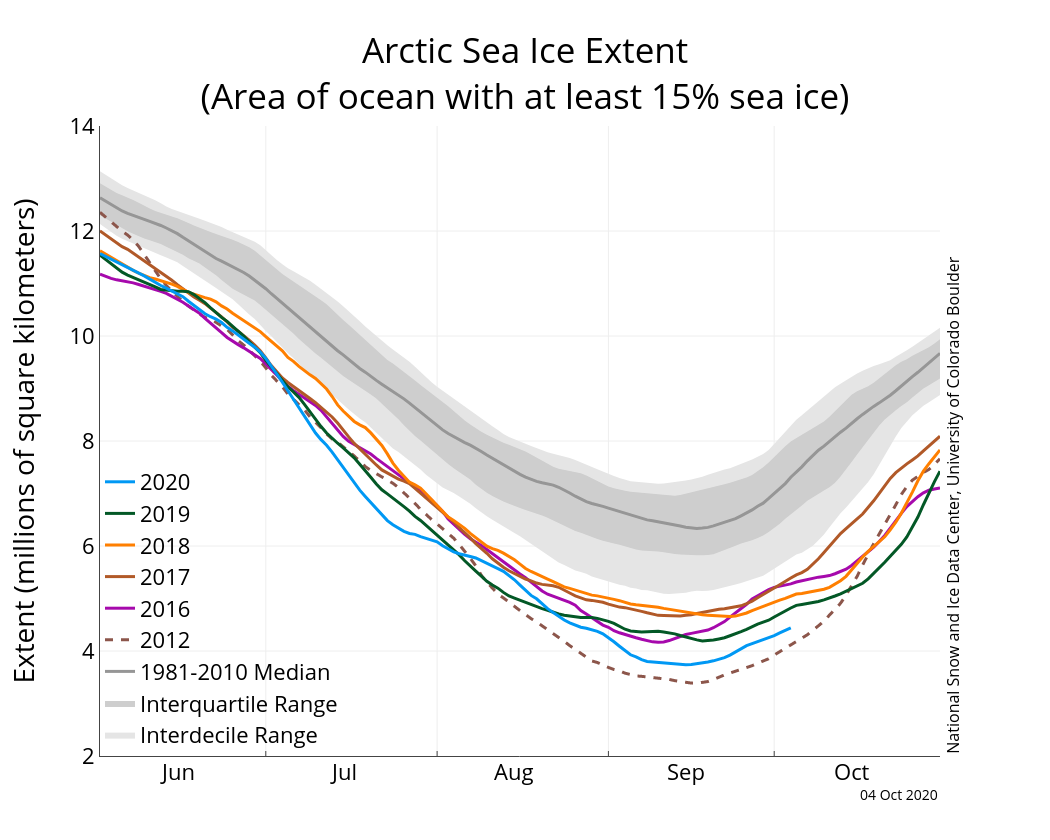
Arctic sea ice extent averaged for September 2020 was 3.92 million square kilometers (1.51 million square miles), the second lowest in the 42-year satellite record, behind only September 2012. This is 350,000 square kilometers (135,000 square miles) above that record low, and 2.49 million square kilometers (961,000 square miles) below the 1981 to 2010 average. Following the minimum seasonal extent, which occurred on September 15, ice growth quickly began along in the northern Beaufort, Chukchi, and East Siberian Seas (Figure 1). Expansion of the ice edge was also notable within the East Greenland Sea and within Canadian Arctic Archipelago. By contrast, the ice edge in the Kara and Barents Seas remained relatively stable until the end of the month when it started to expand, and within the Laptev Sea the ice edge retreated slightly. The Northern Sea Route remained open at the end of September whereas the Northwest Passage southerly route (Amundsen’s route) is now blocked by ice. Ten days after the minimum extent was reached, the total extent climbed above 4 million square kilometers (1.54 million square miles) and by the end of the month the ice extent was tracking at 4.25 million square kilometers (1.64 million square miles), still second lowest in terms of daily extent.

Conditions in context

Arctic sea ice extent as of October 4, 2020

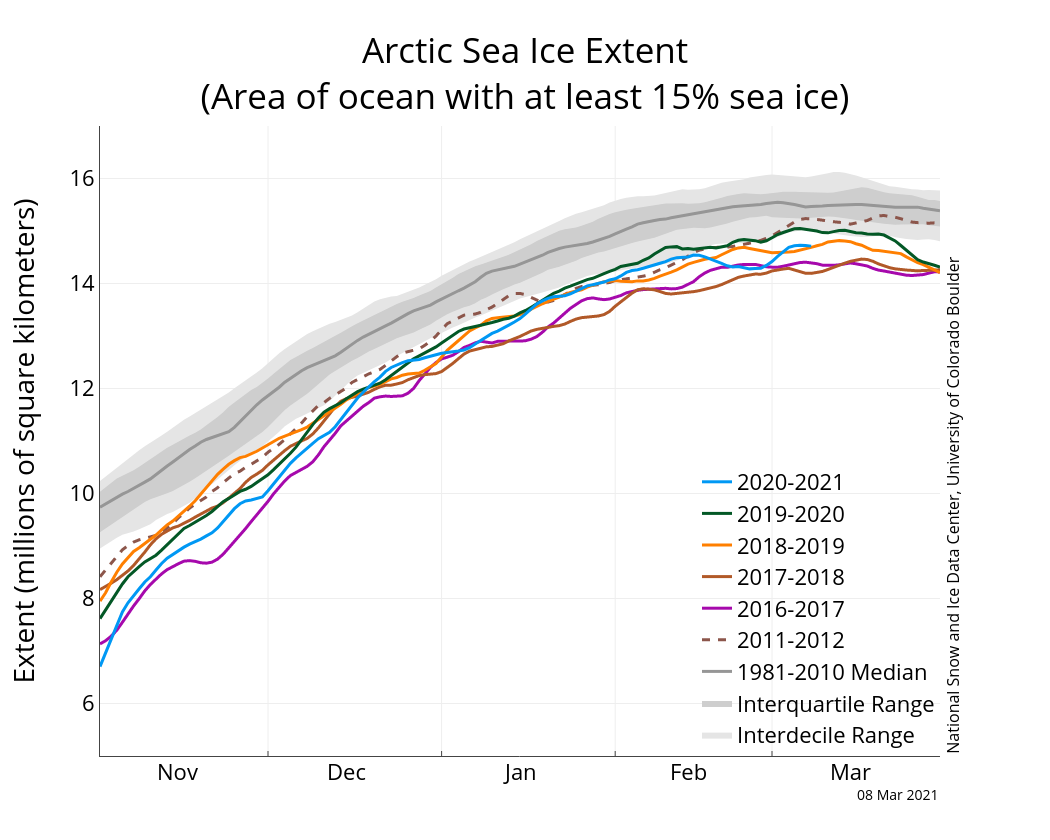
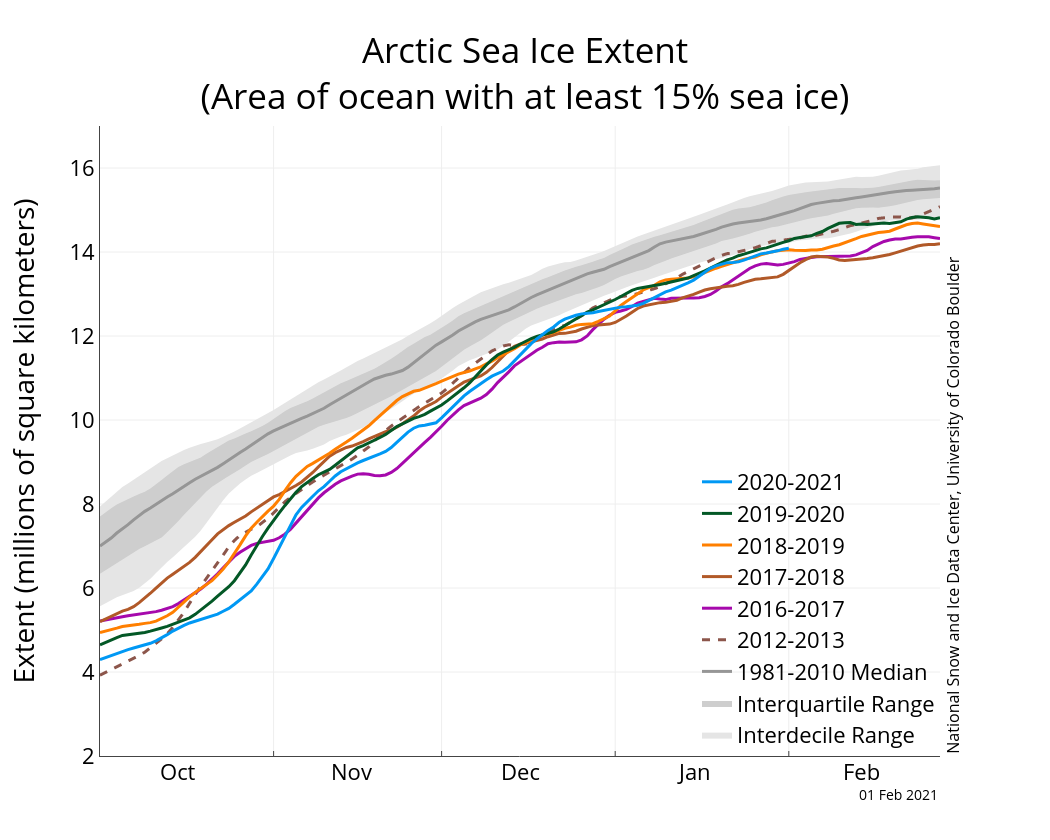
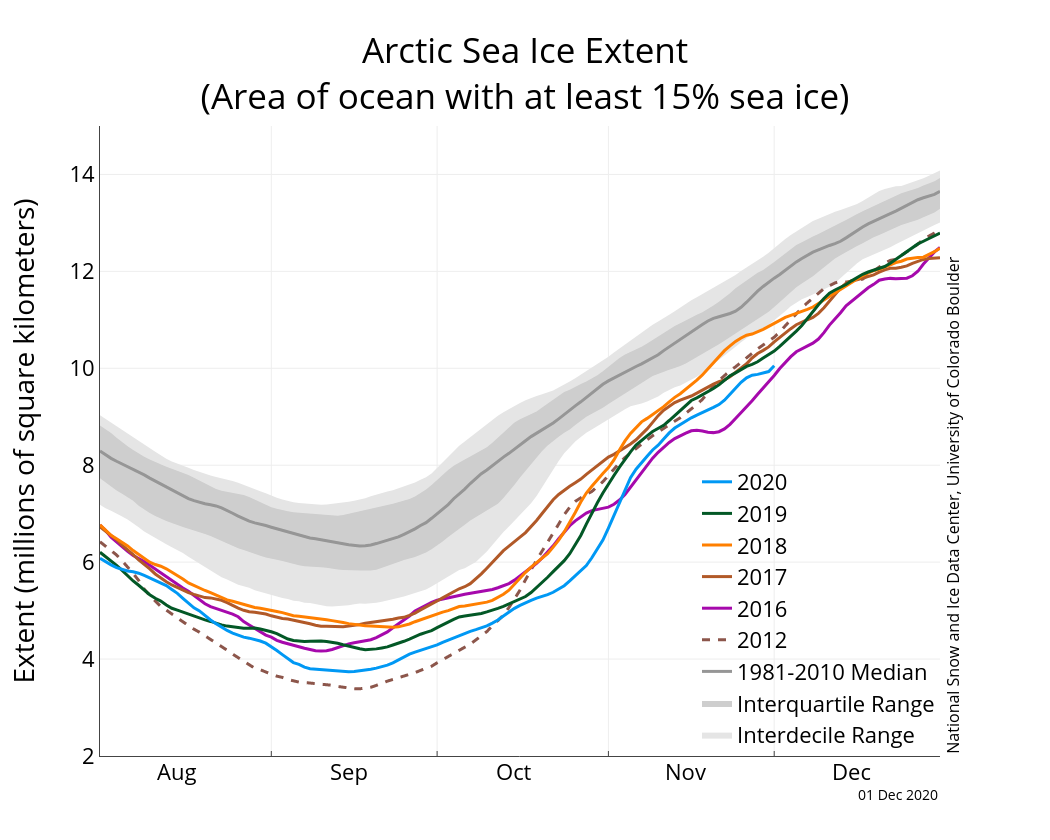
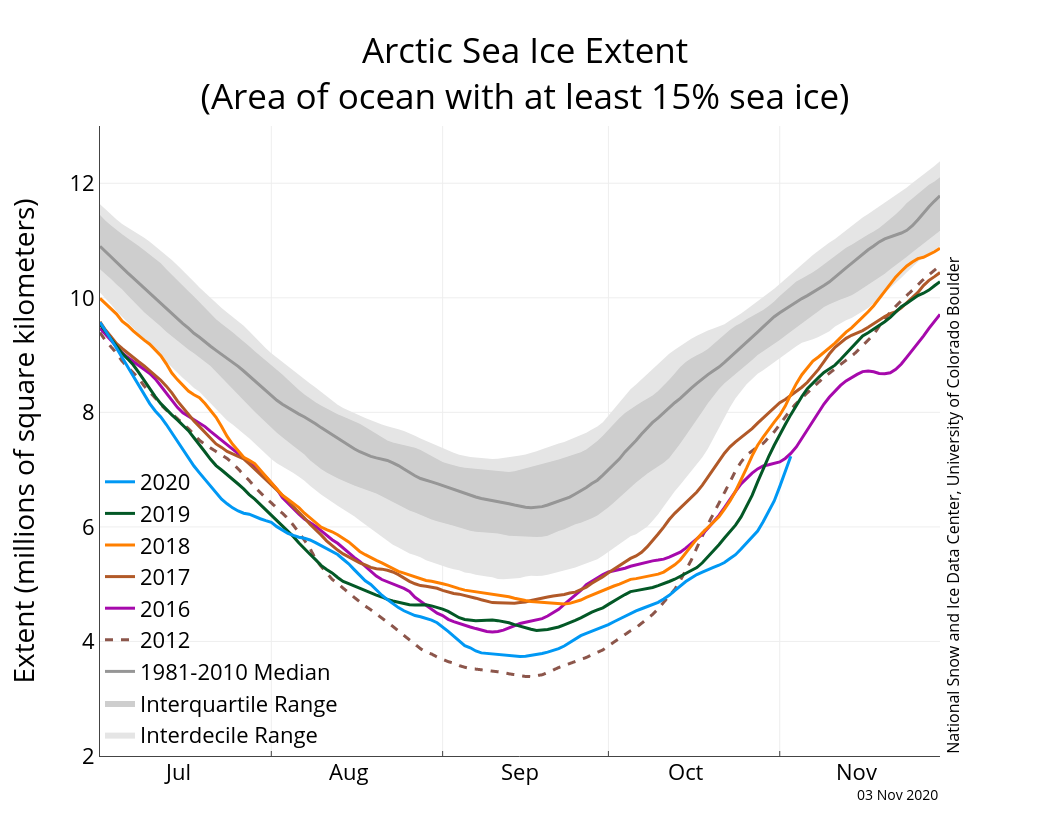
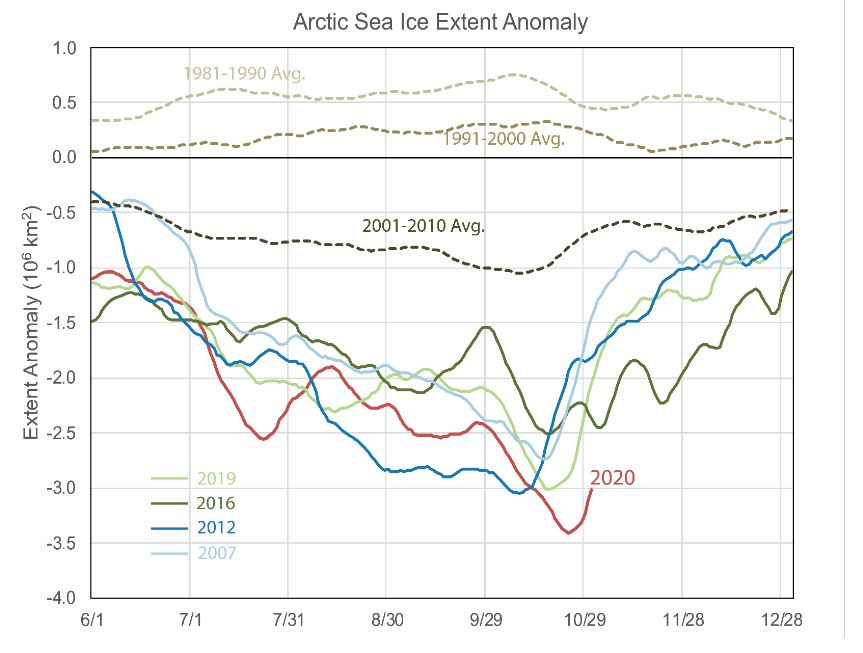
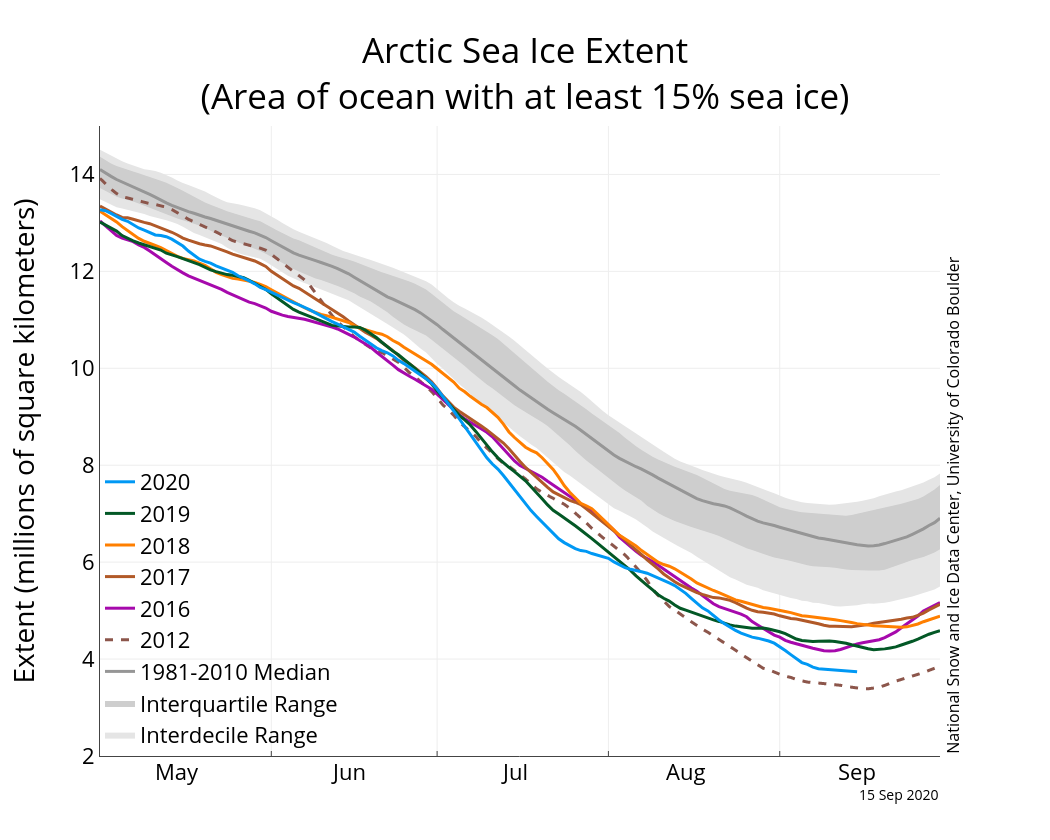
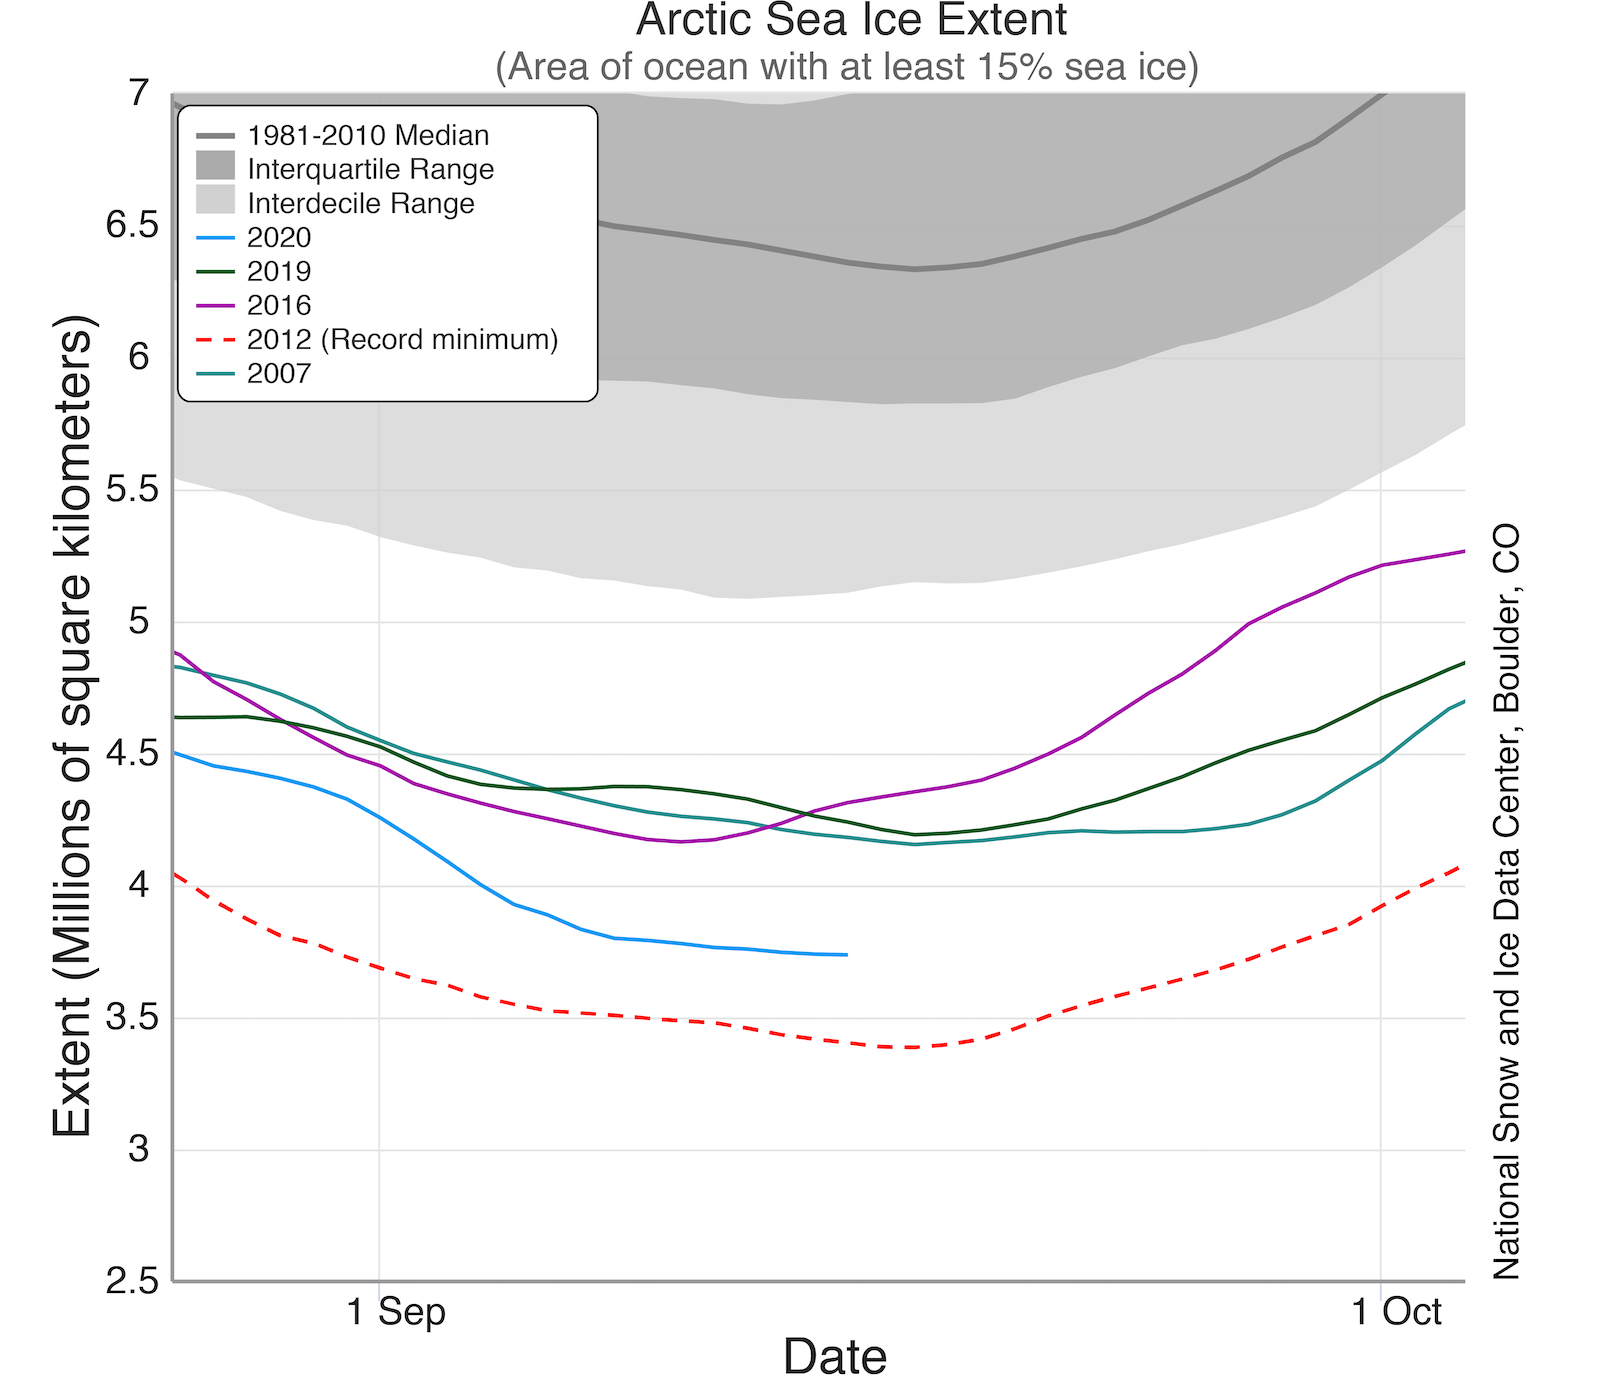
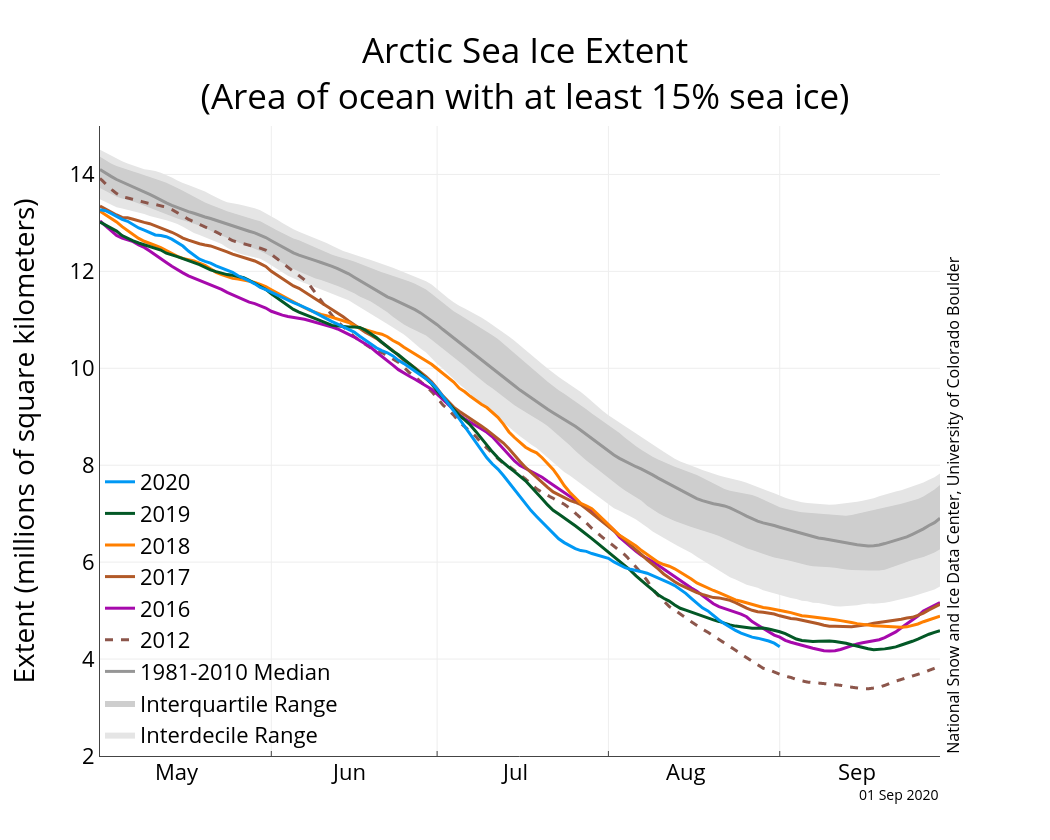
Figure 2a. The graph above shows Arctic sea ice extent as of October 4, 2020, along with daily ice extent data for four previous years and the record low year. 2020 is shown in blue, 2019 in green, 2018 in orange, 2017 in brown, 2016 in purple, and 2012 in dashed brown. The 1981 to 2010 median is in dark gray. The gray areas around the median line show the interquartile and interdecile ranges of the data. Sea Ice Index data.

Credit: National Snow and Ice Data Center
High-resolution image

September 2020 Arctic air temperature, as difference from average (left) Average sea level pressure (right)

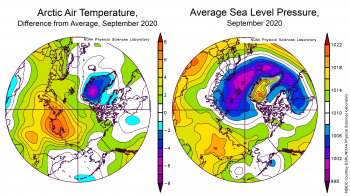
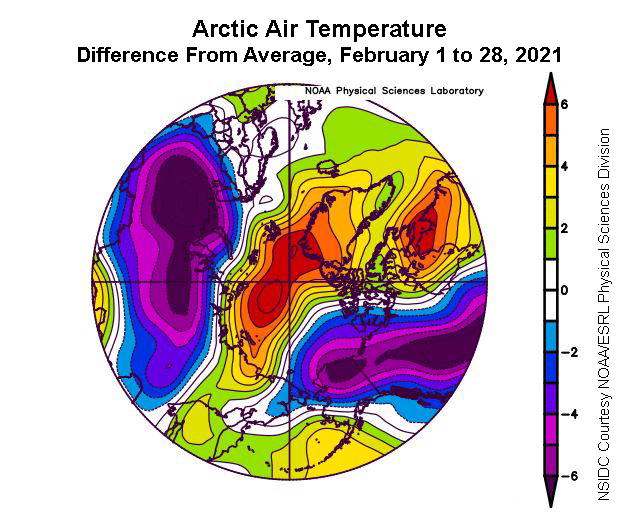
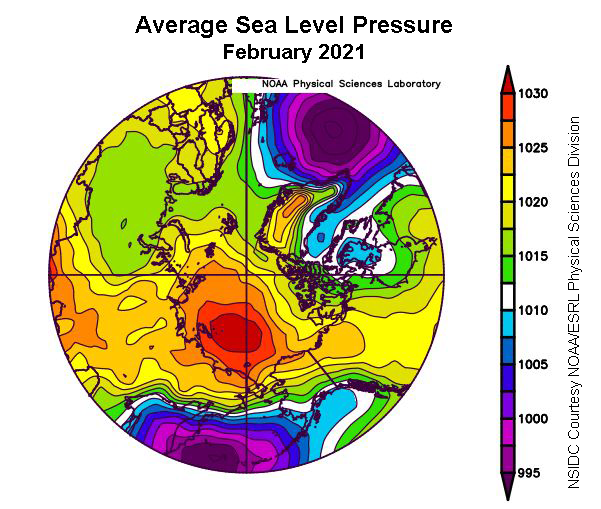
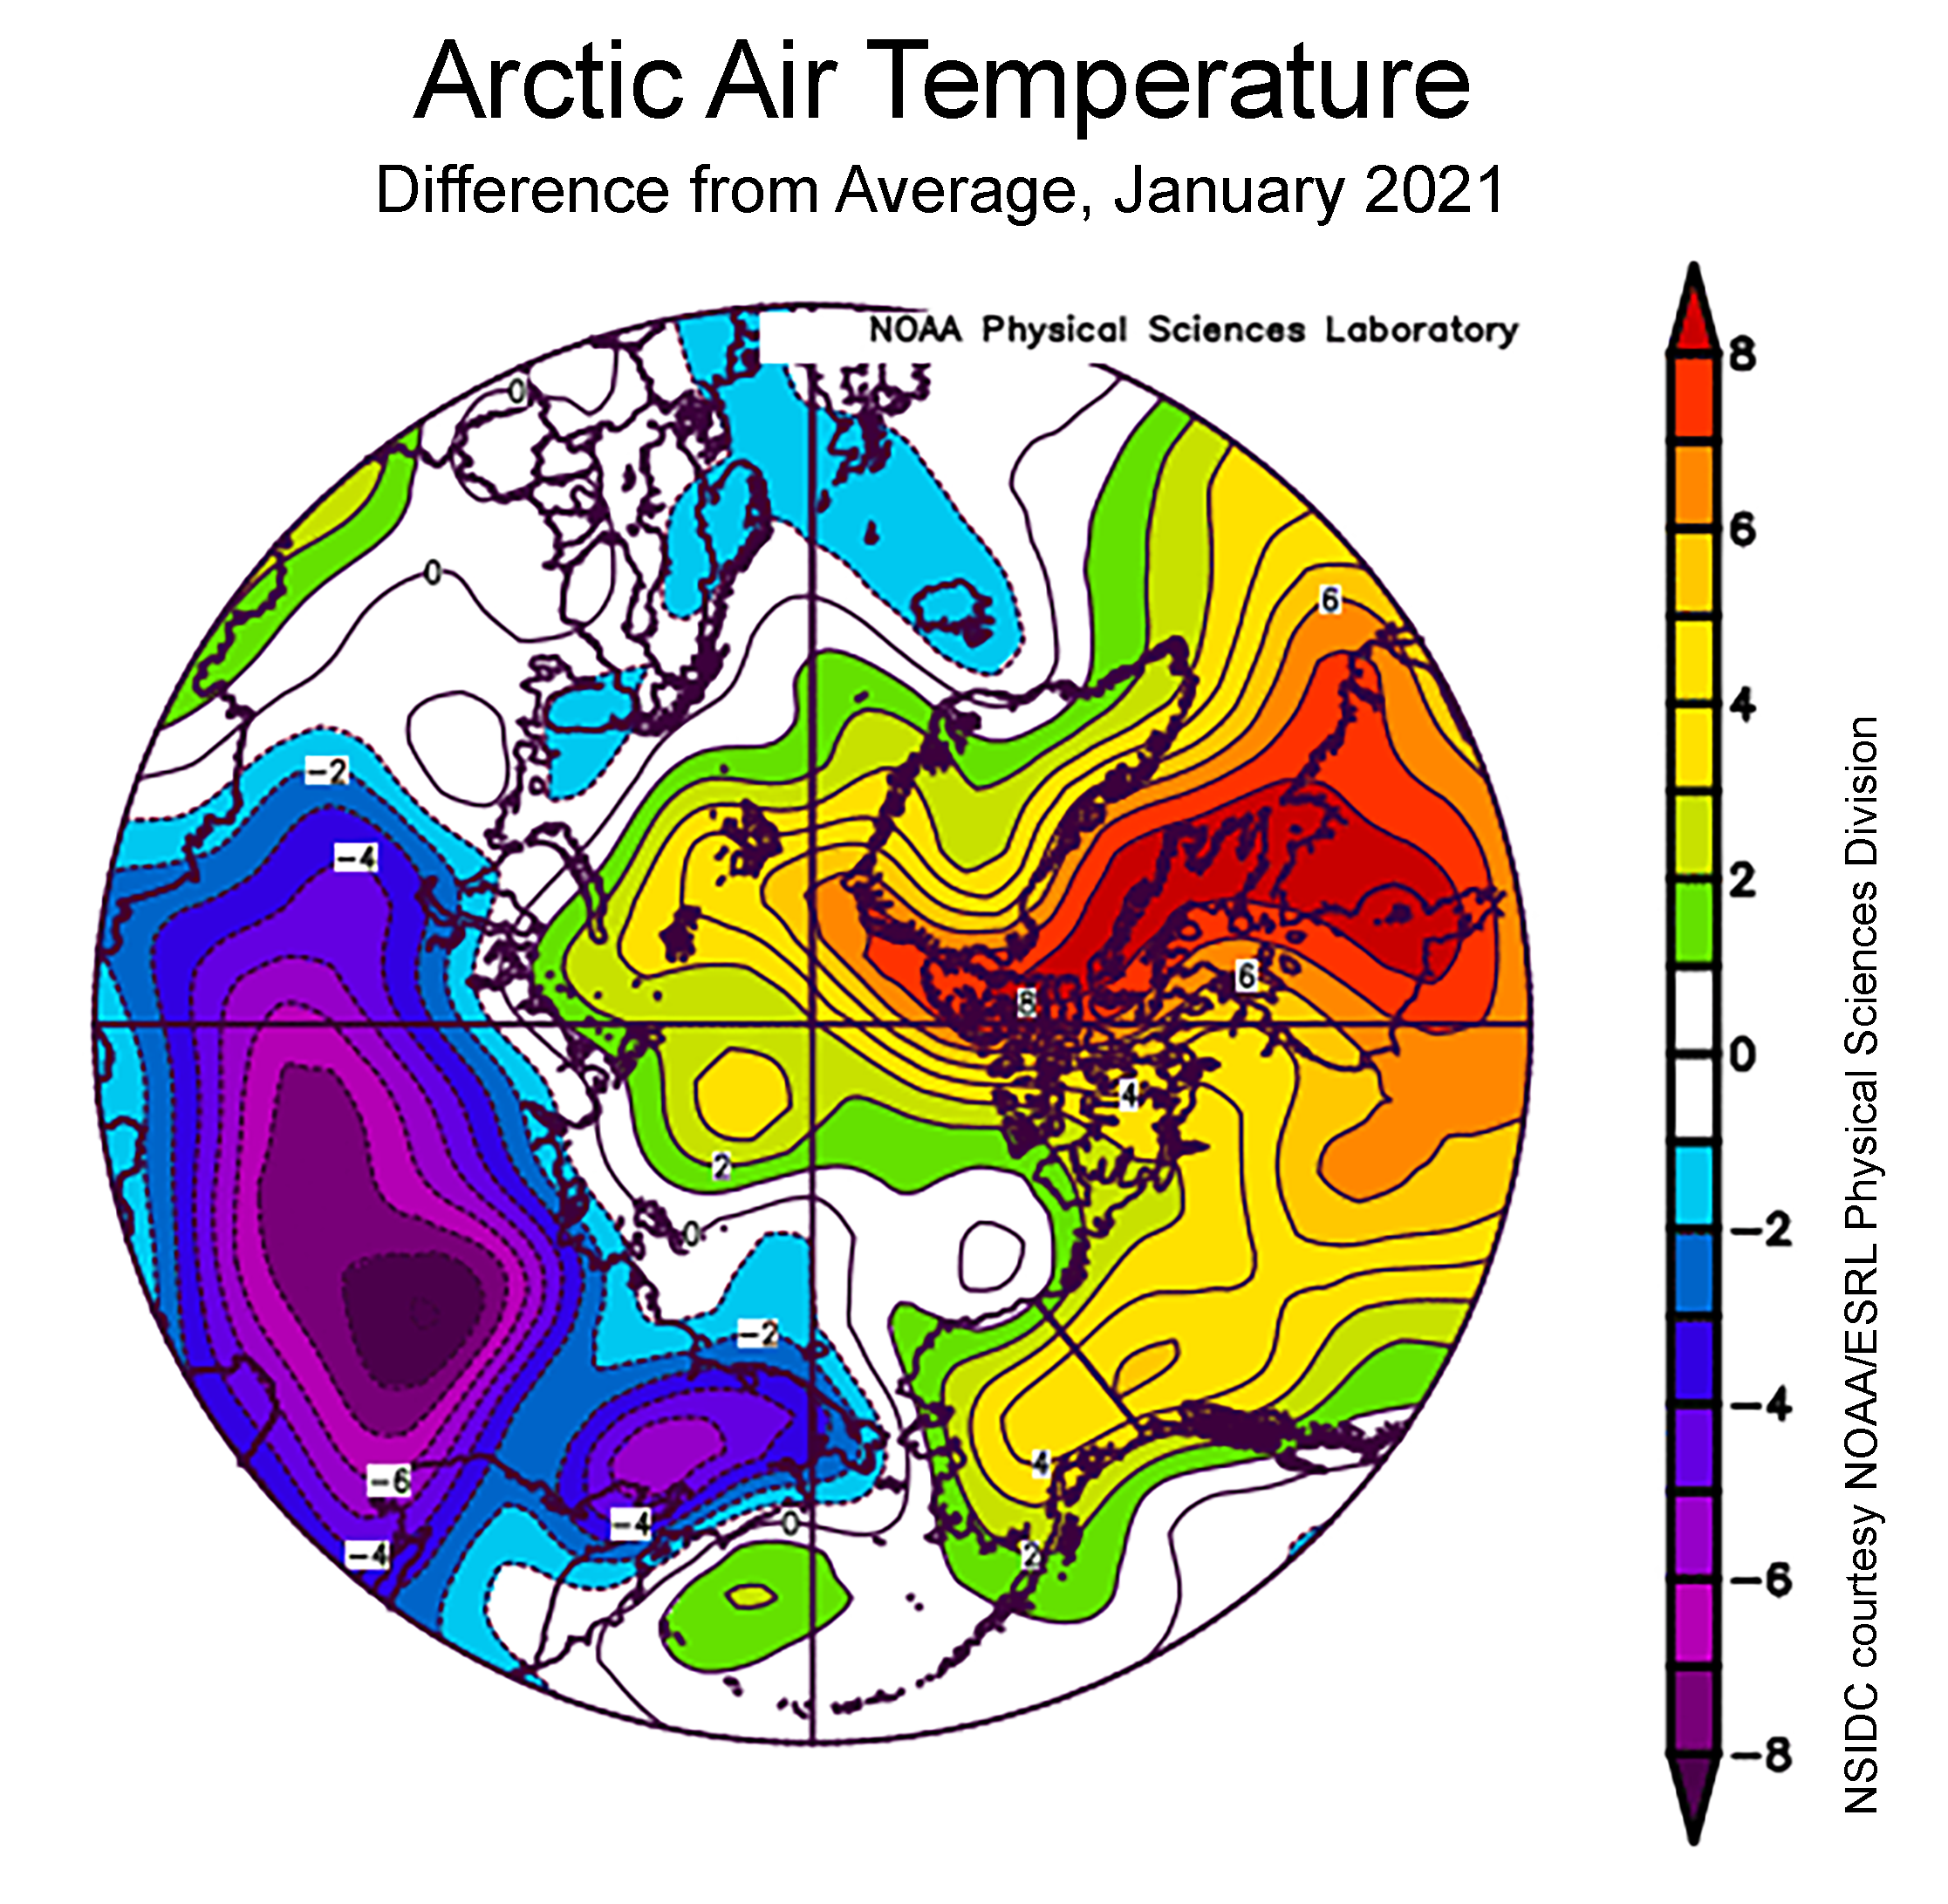
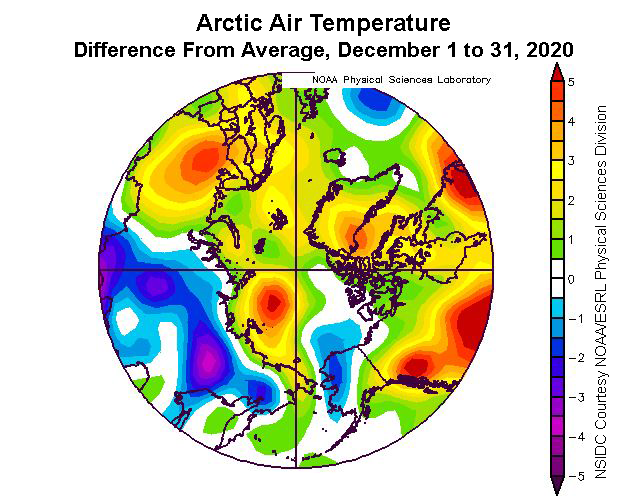
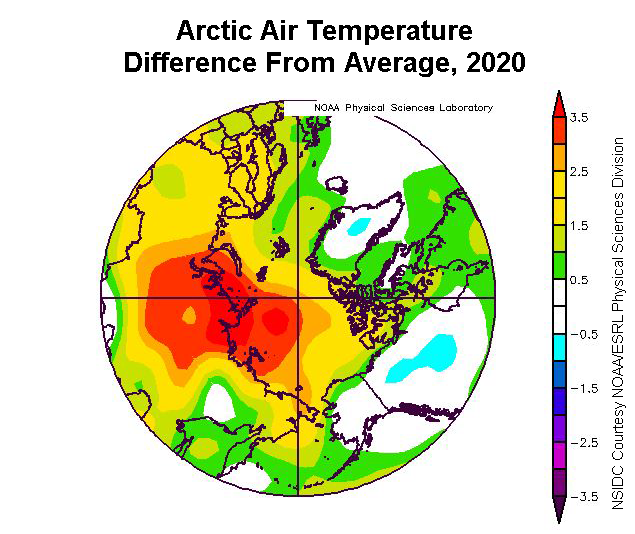
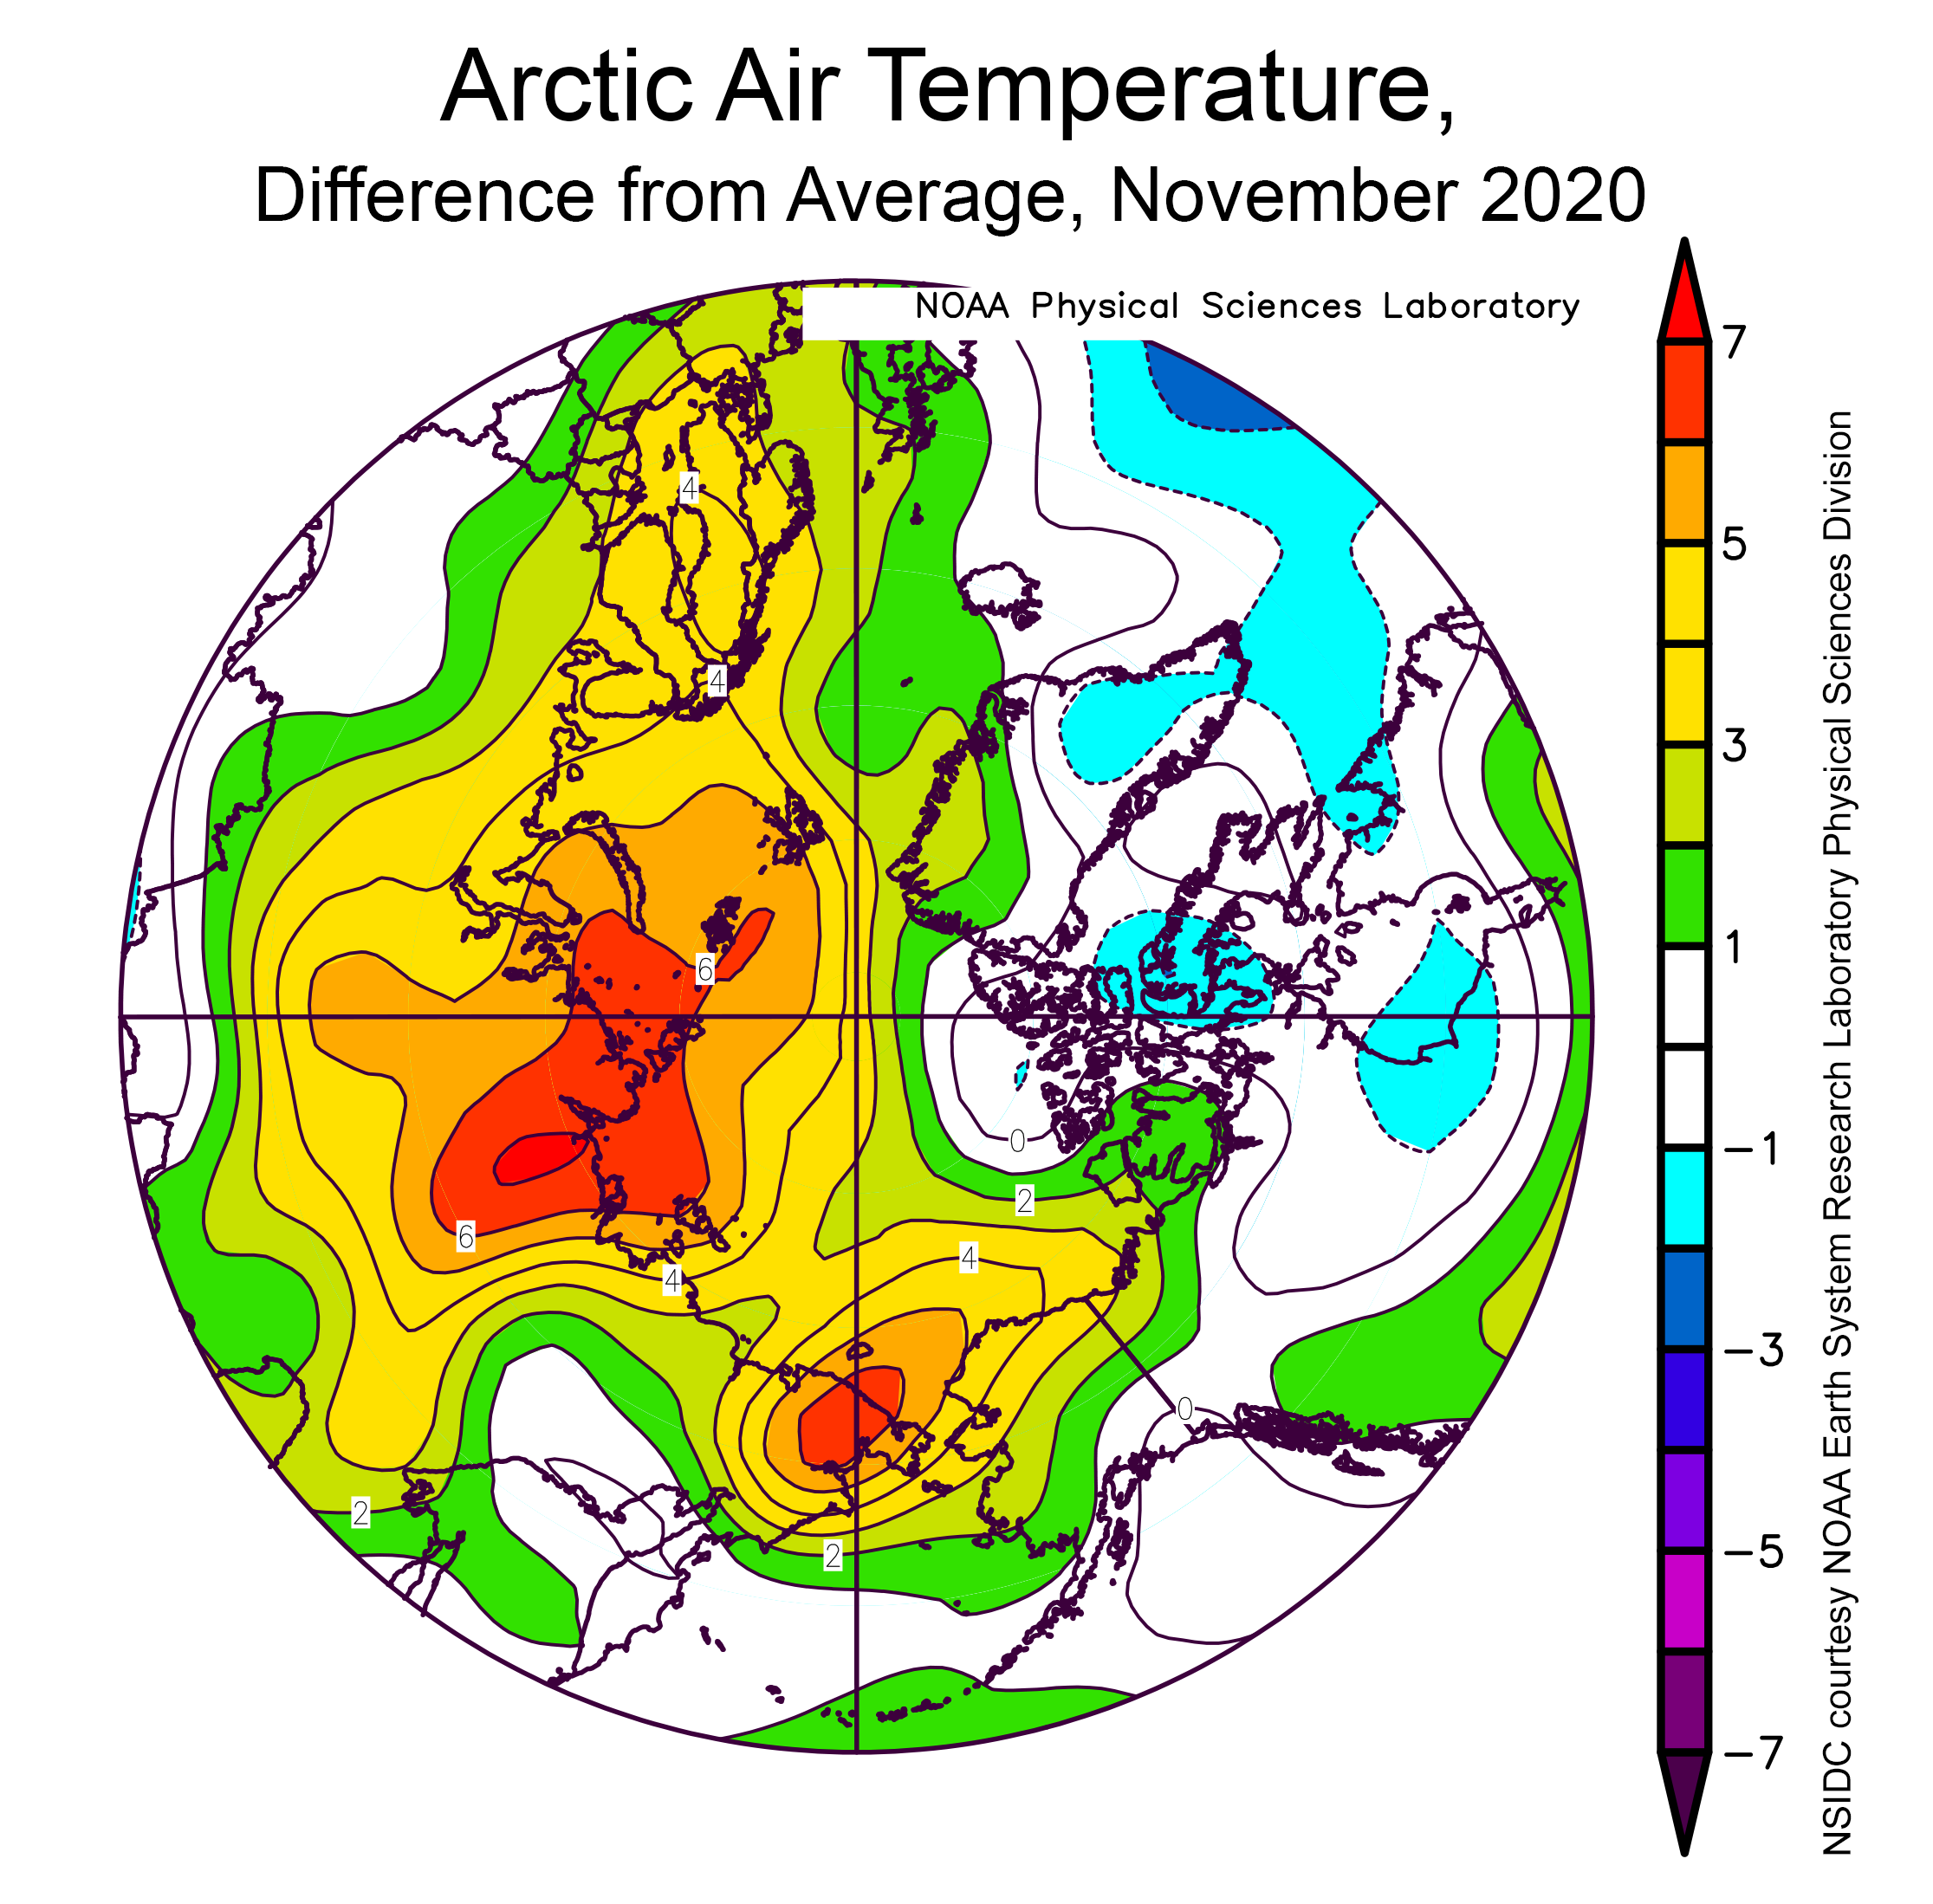
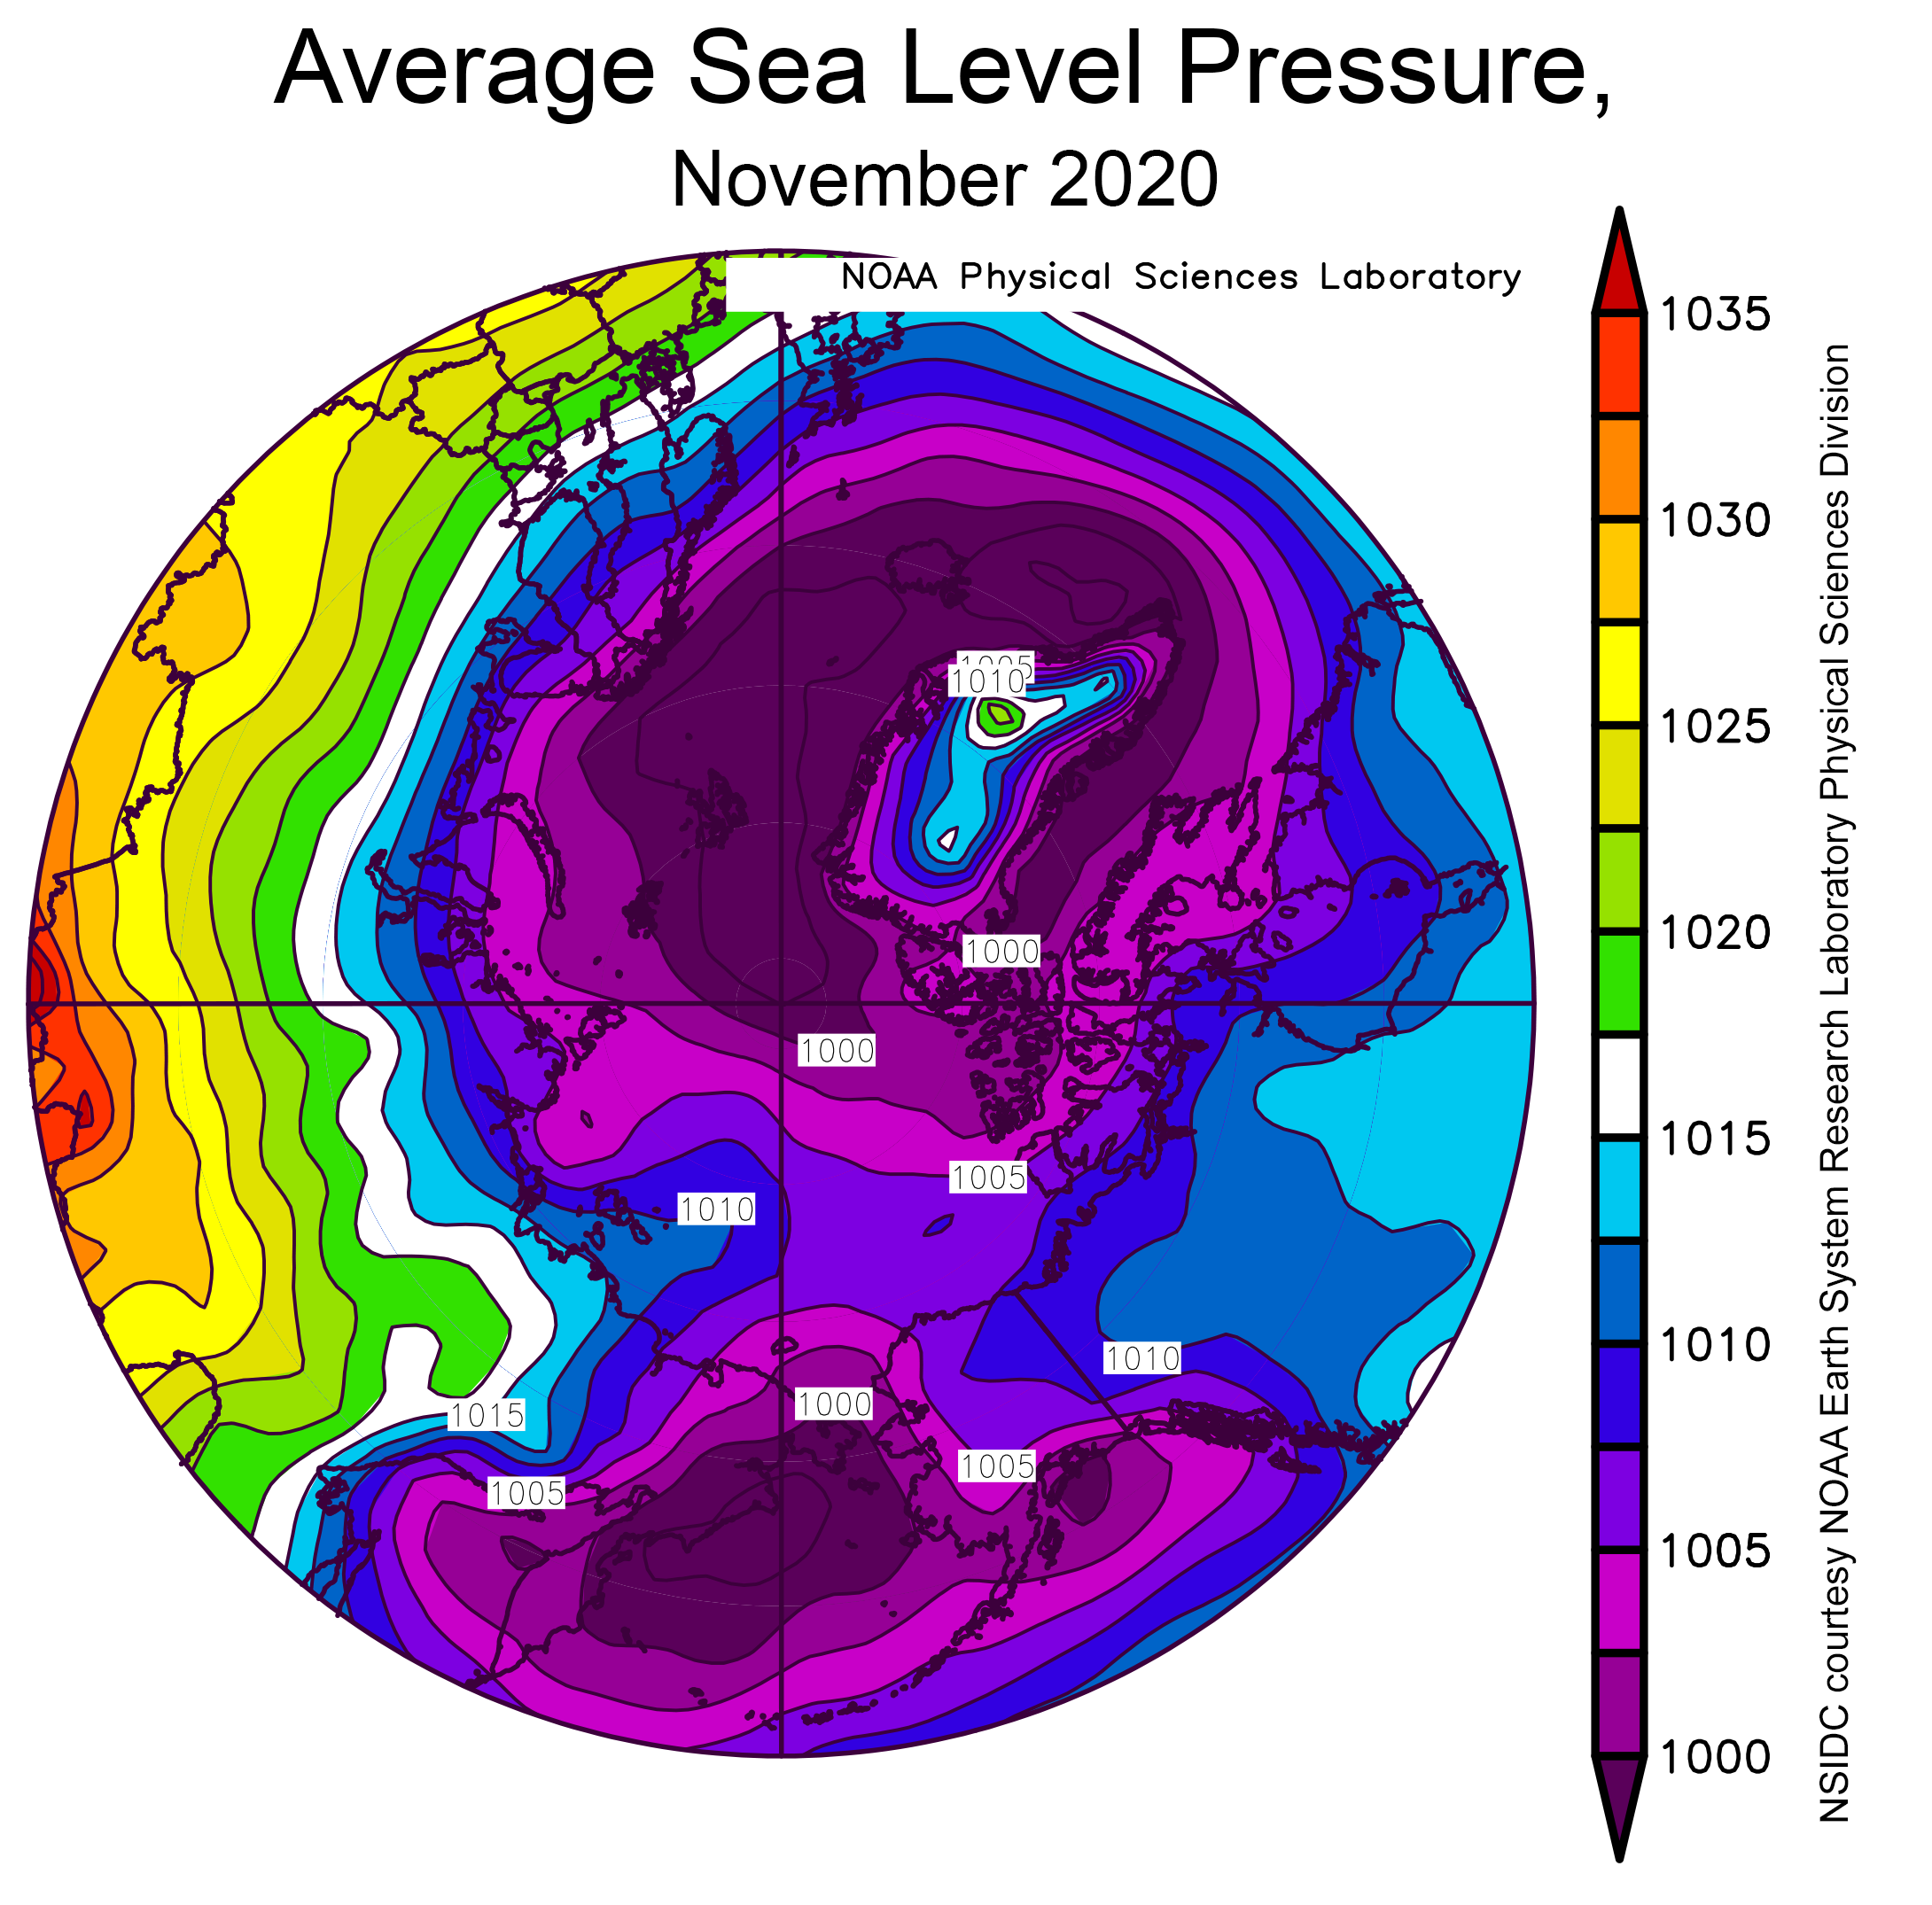
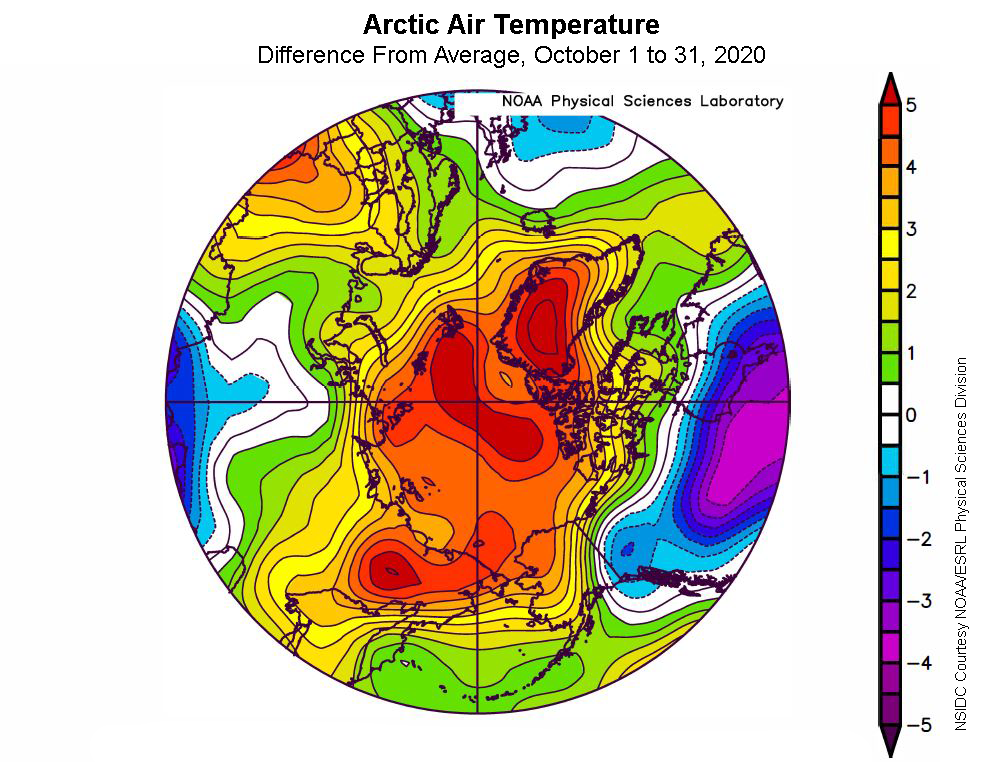
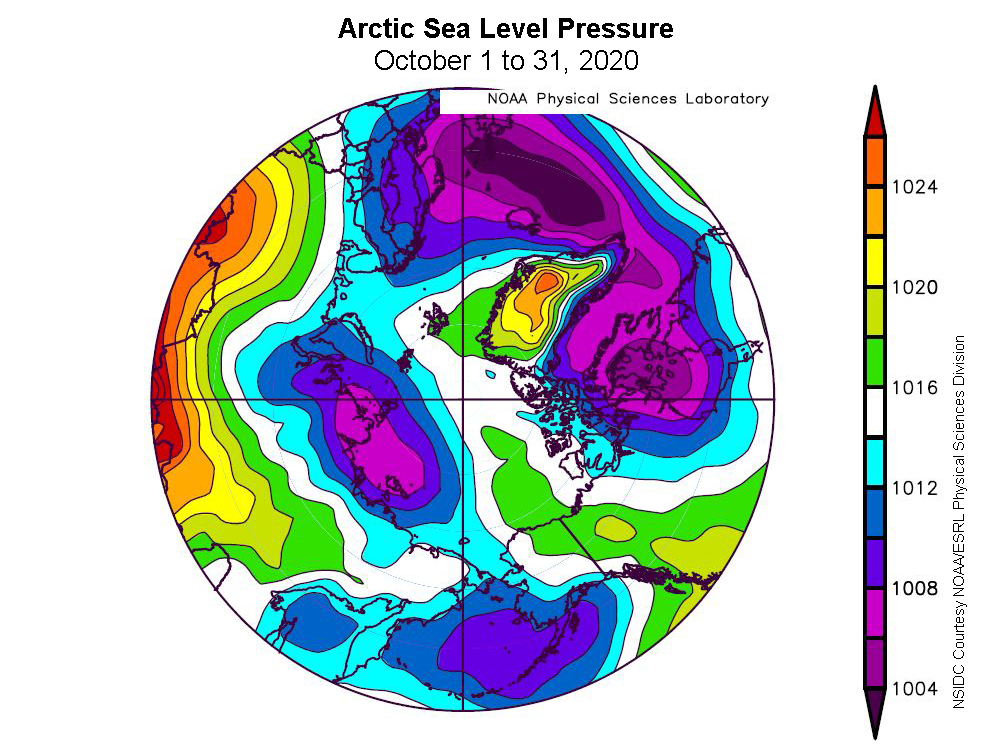
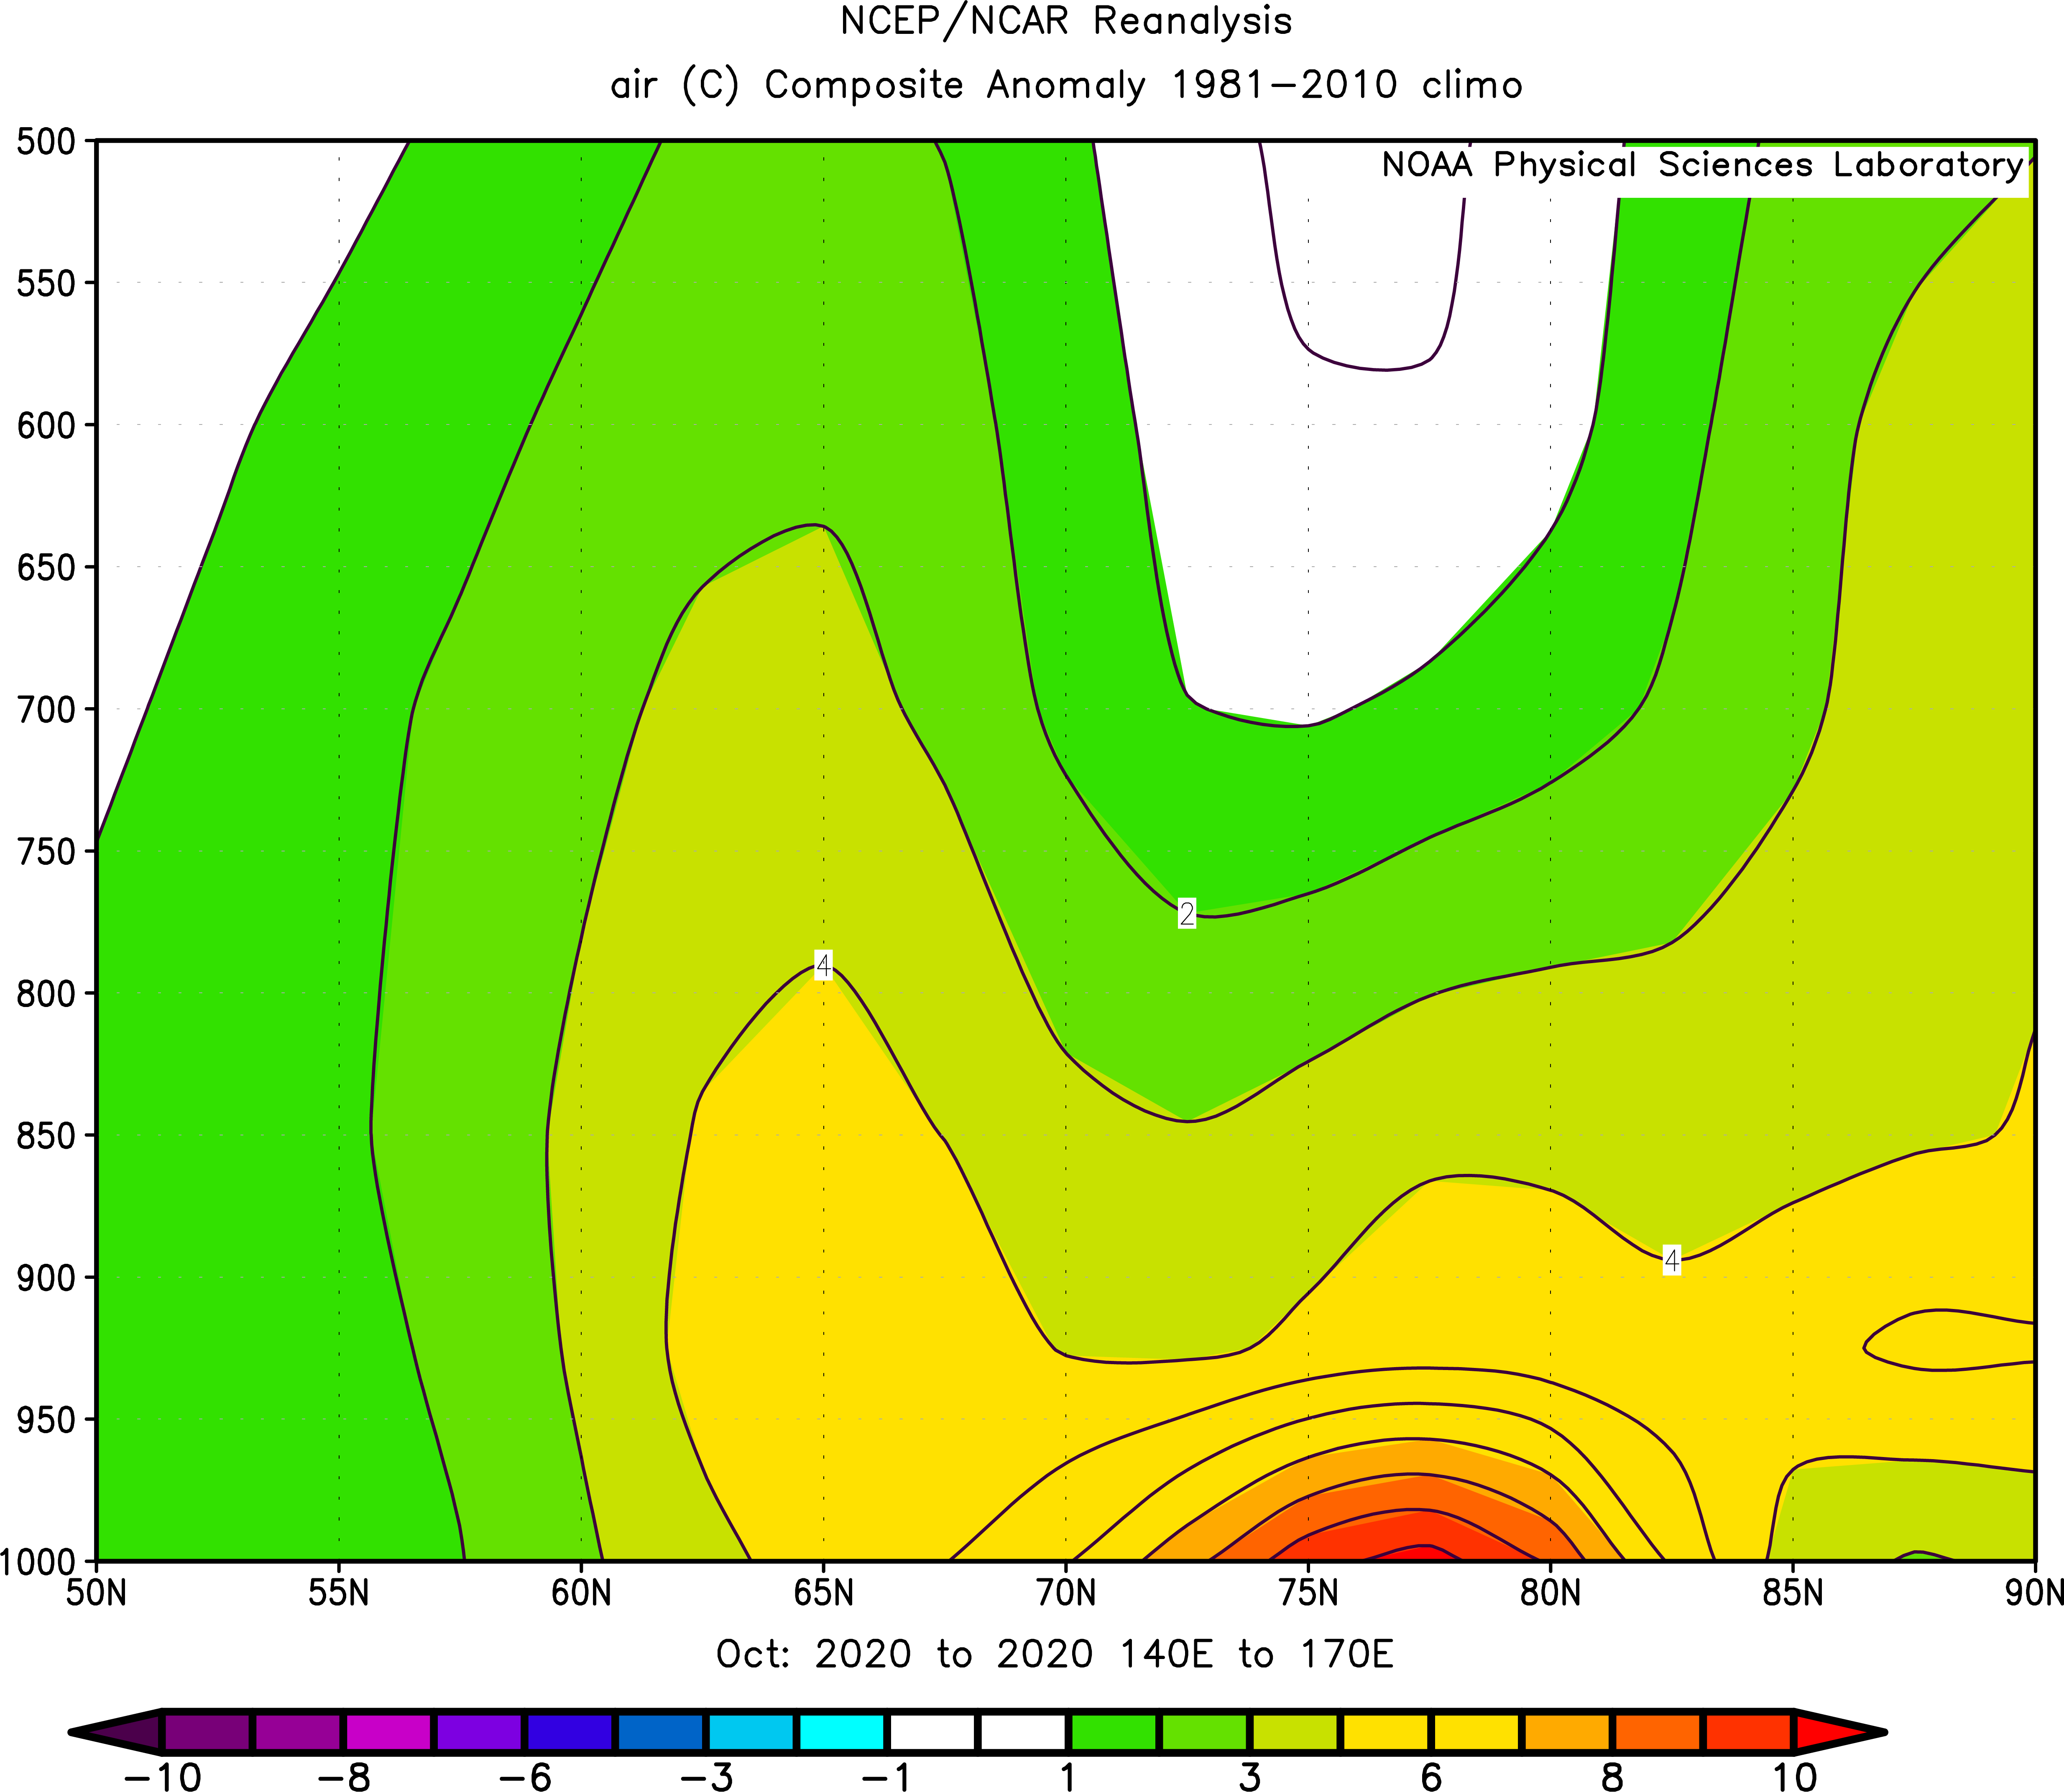
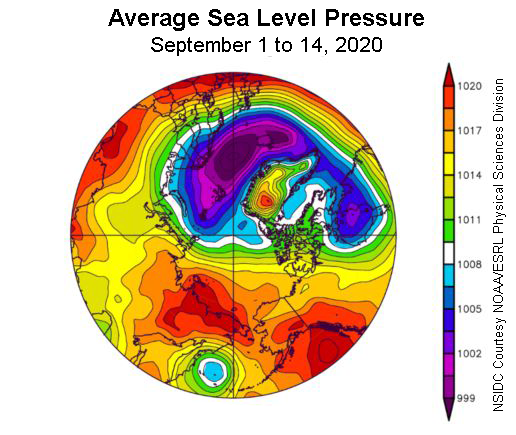
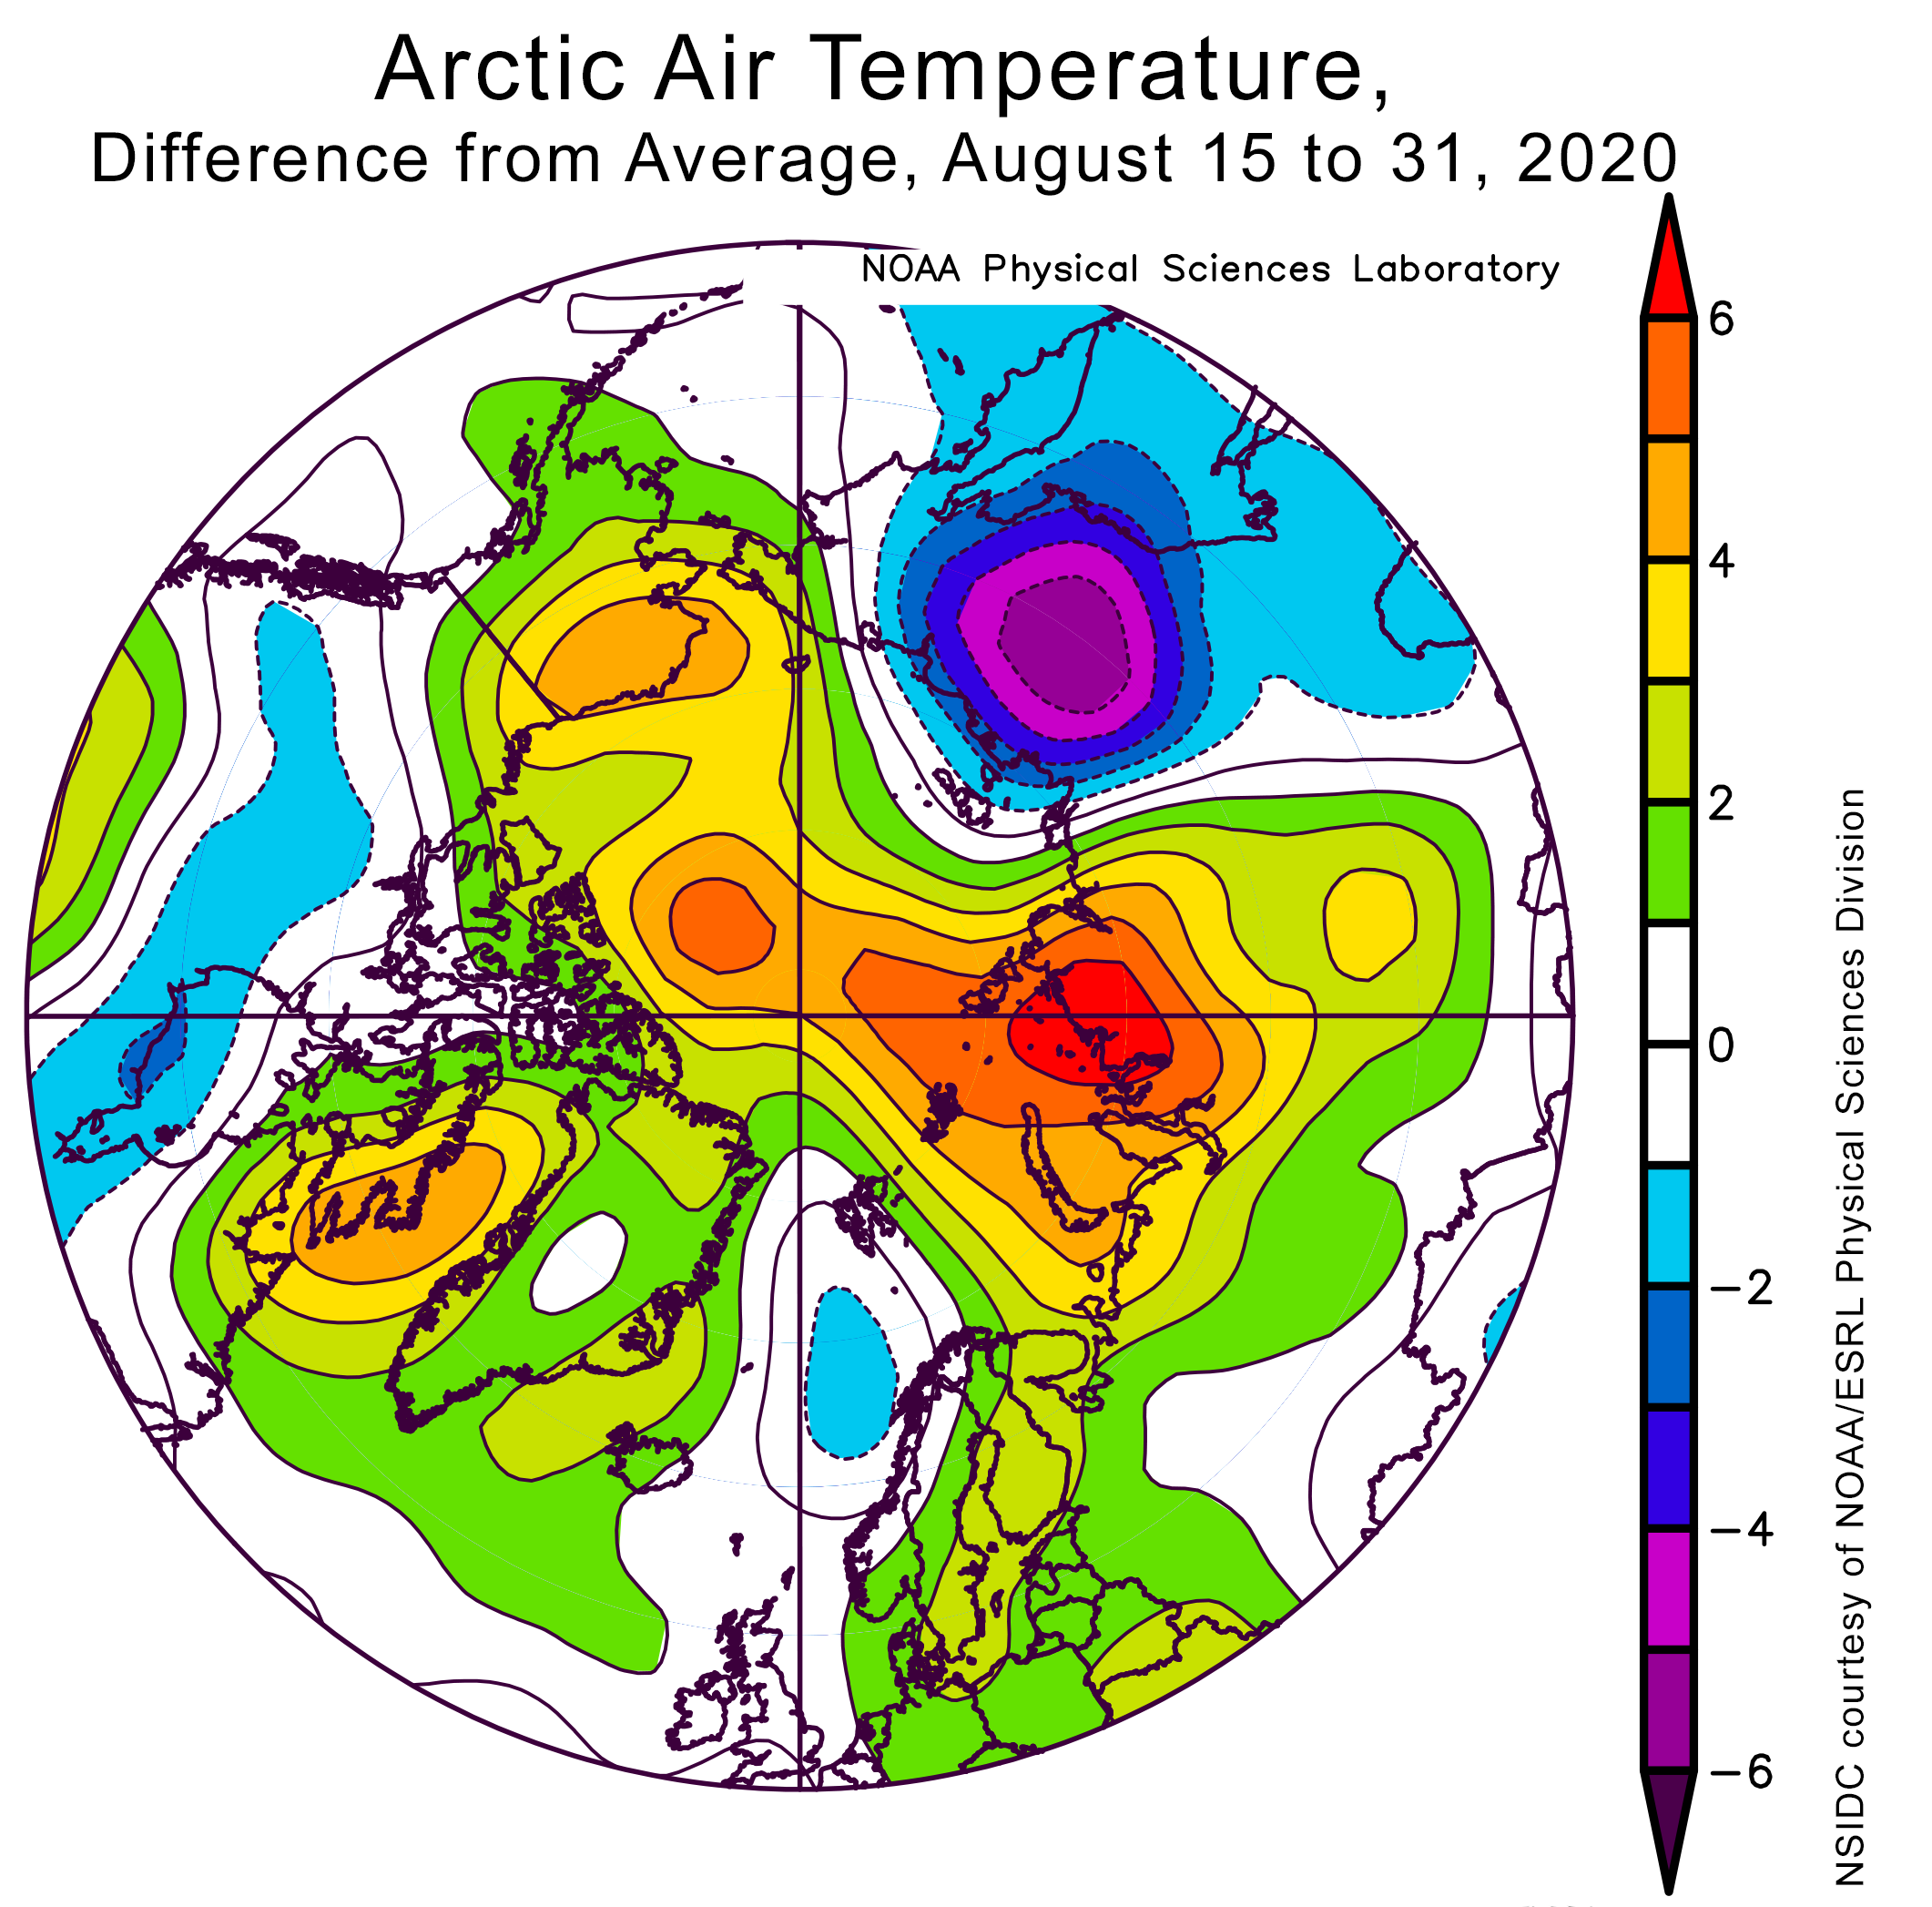
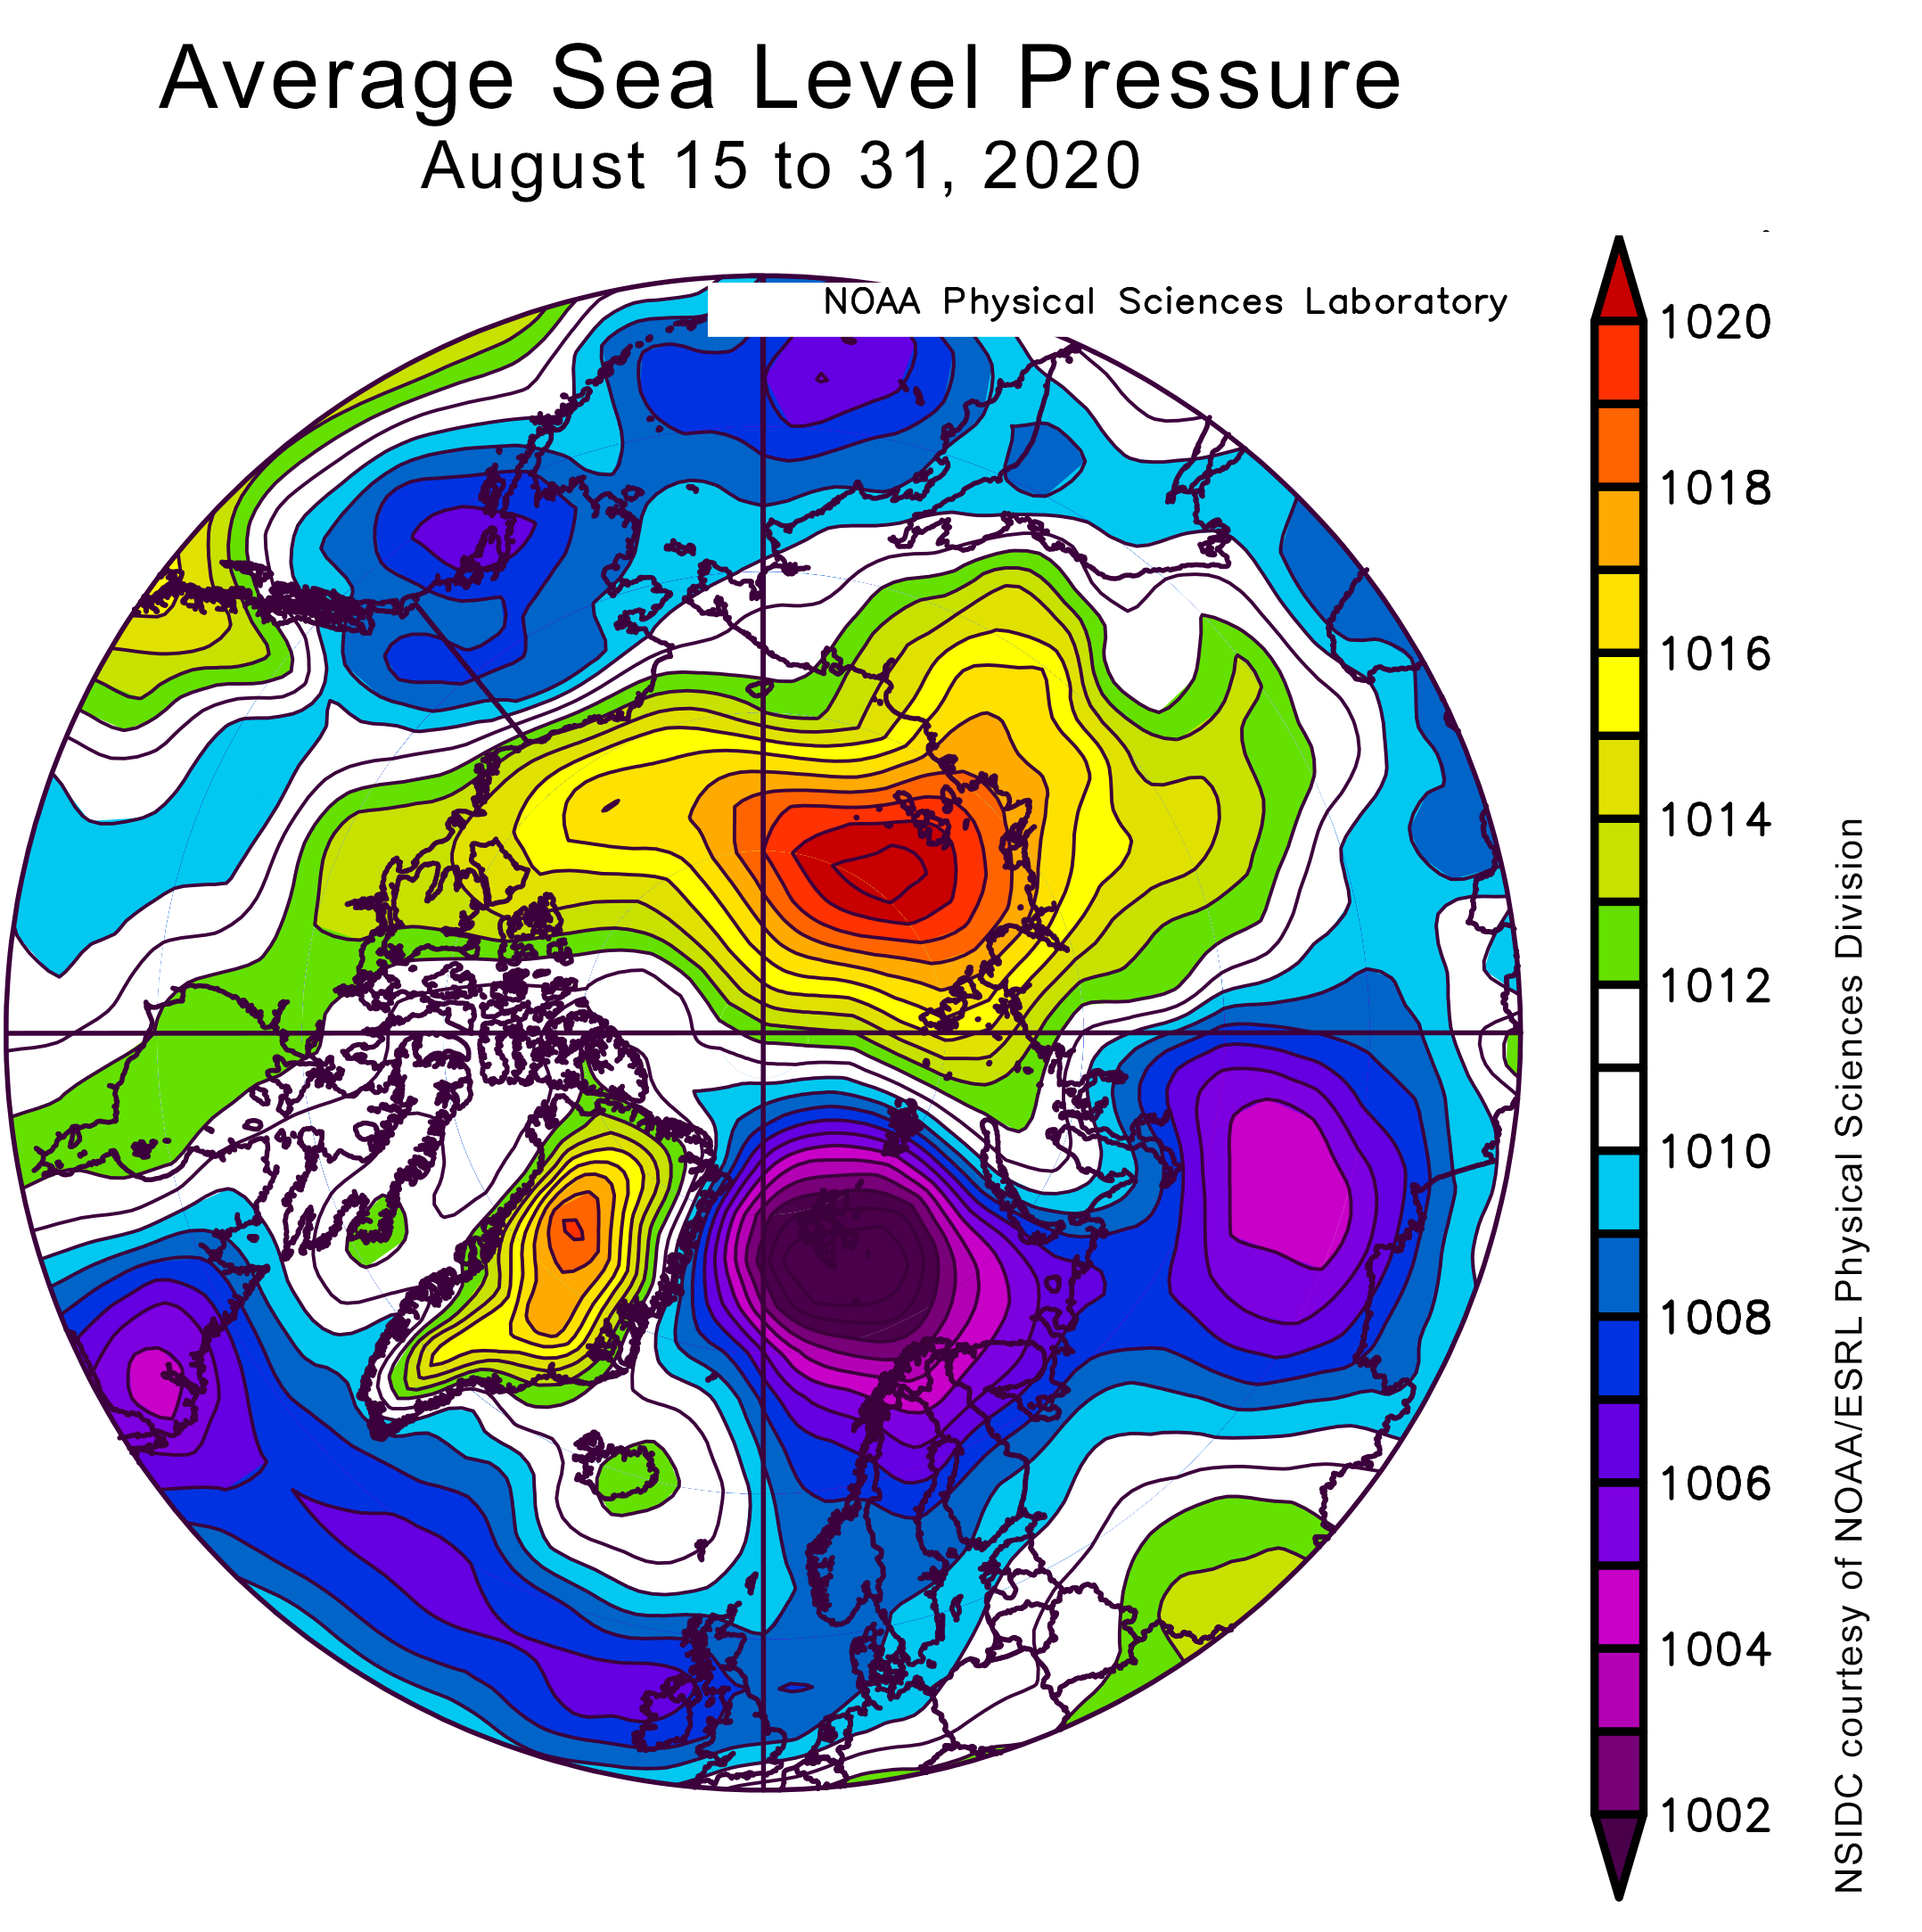
Figure 2b. The plot on the left shows the departure from average air temperature in the Arctic at the 925 hPa level, in degrees Celsius, for September 2020. Yellows and reds indicate higher than average temperatures; blues and purples indicate lower than average temperatures. The plot on the right shows average sea level pressure in the Arctic in millibars (hPa) for September 2020. Yellows and reds indicate high air pressure; blues and purples indicate low pressure. The apparent high pressure over Greenland is an artifact of the high elevation there; errors are incurred in extrapolating from the surface of the ice to sea level.

Credit: NSIDC courtesy NOAA Earth System Research Laboratory Physical Sciences Division
High-resolution image

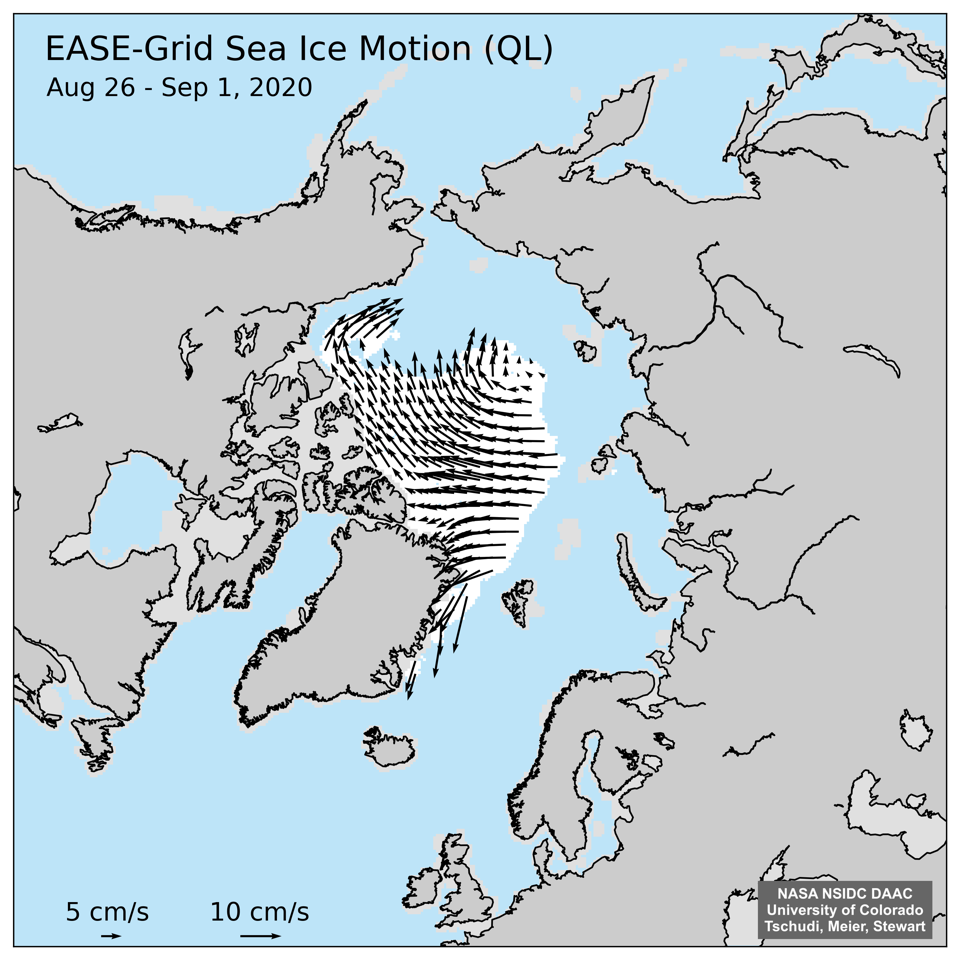
Arctic air temperatures at the 925 hPa level (about 2,500 feet above the surface) remained overall above the 1981 to 2010 average during September. This warmth was primarily observed on the Eurasian side of the Arctic, where air temperatures along the coastal regions of the Laptev Sea reached up to 8 degrees Celsius (14 degrees Fahrenheit) above average. Below average temperatures prevailed over Greenland. Warm conditions over the Siberian side of the Arctic were driven by a strong high pressure ridge over Siberia coupled with a strong low-pressure trough centered over Svalbard. This is also manifested as a positive phase of the Arctic Oscillation (AO). A cyclonic (counterclockwise) circulation pattern set up over the Laptev Sea, bringing in warmer air from the south. At the same time, this circulation pattern enhanced ice drift out through Fram Strait and out of the Arctic Ocean. Winds from the south in the Kara and Barents Seas also kept the ice edge from expanding in that region, and led to retreat of the ice edge within the Laptev Sea.

September 2020 compared to previous years

Ice extent decline from 1979 to 2020 for September

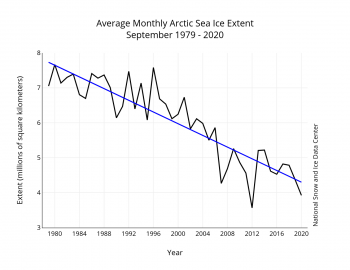
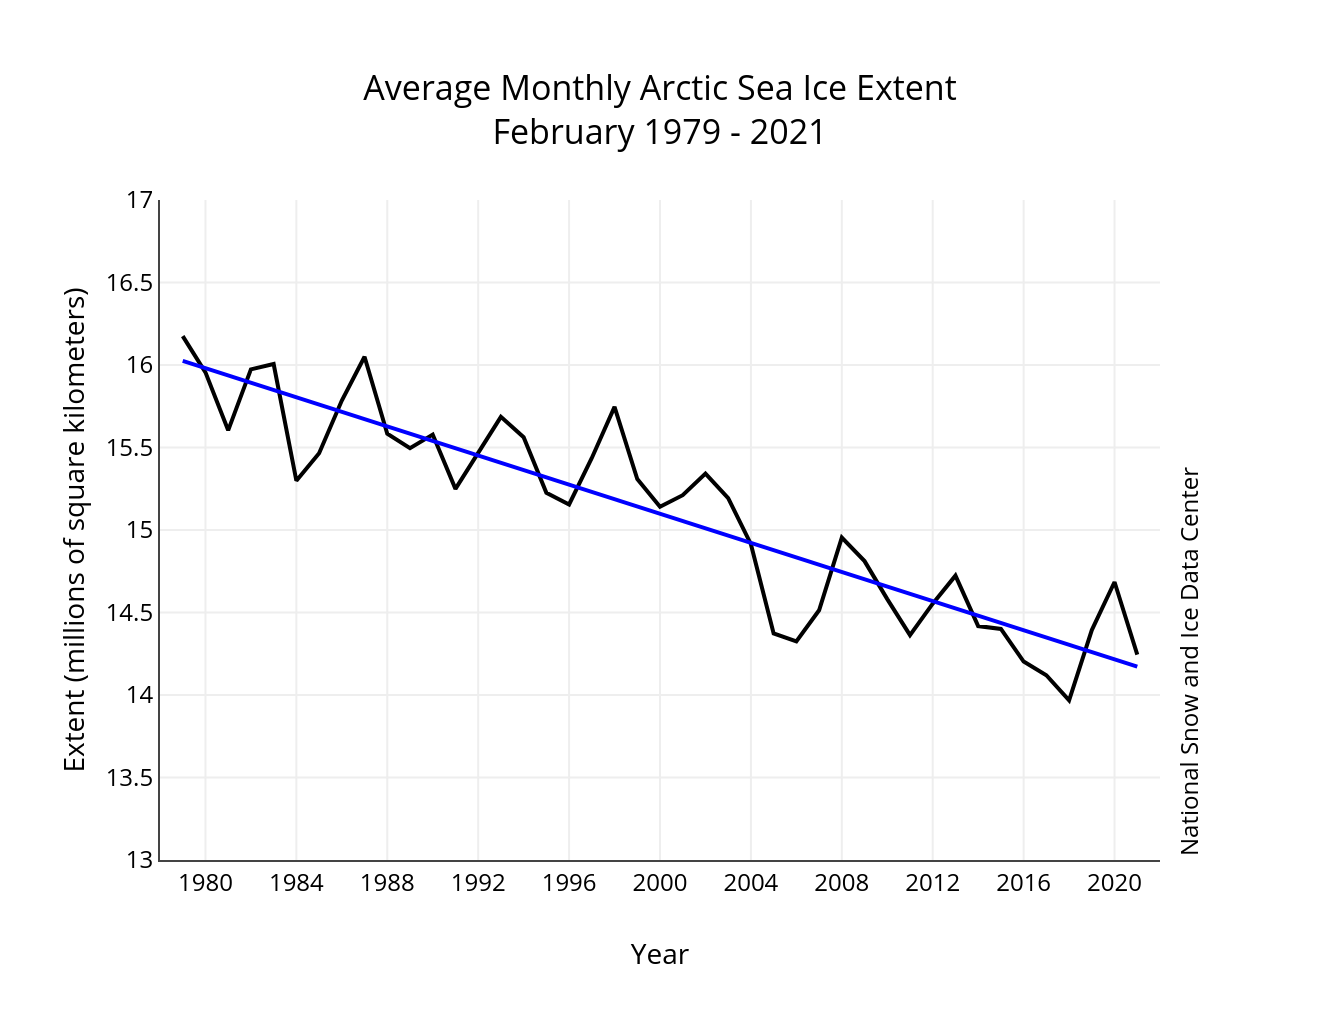
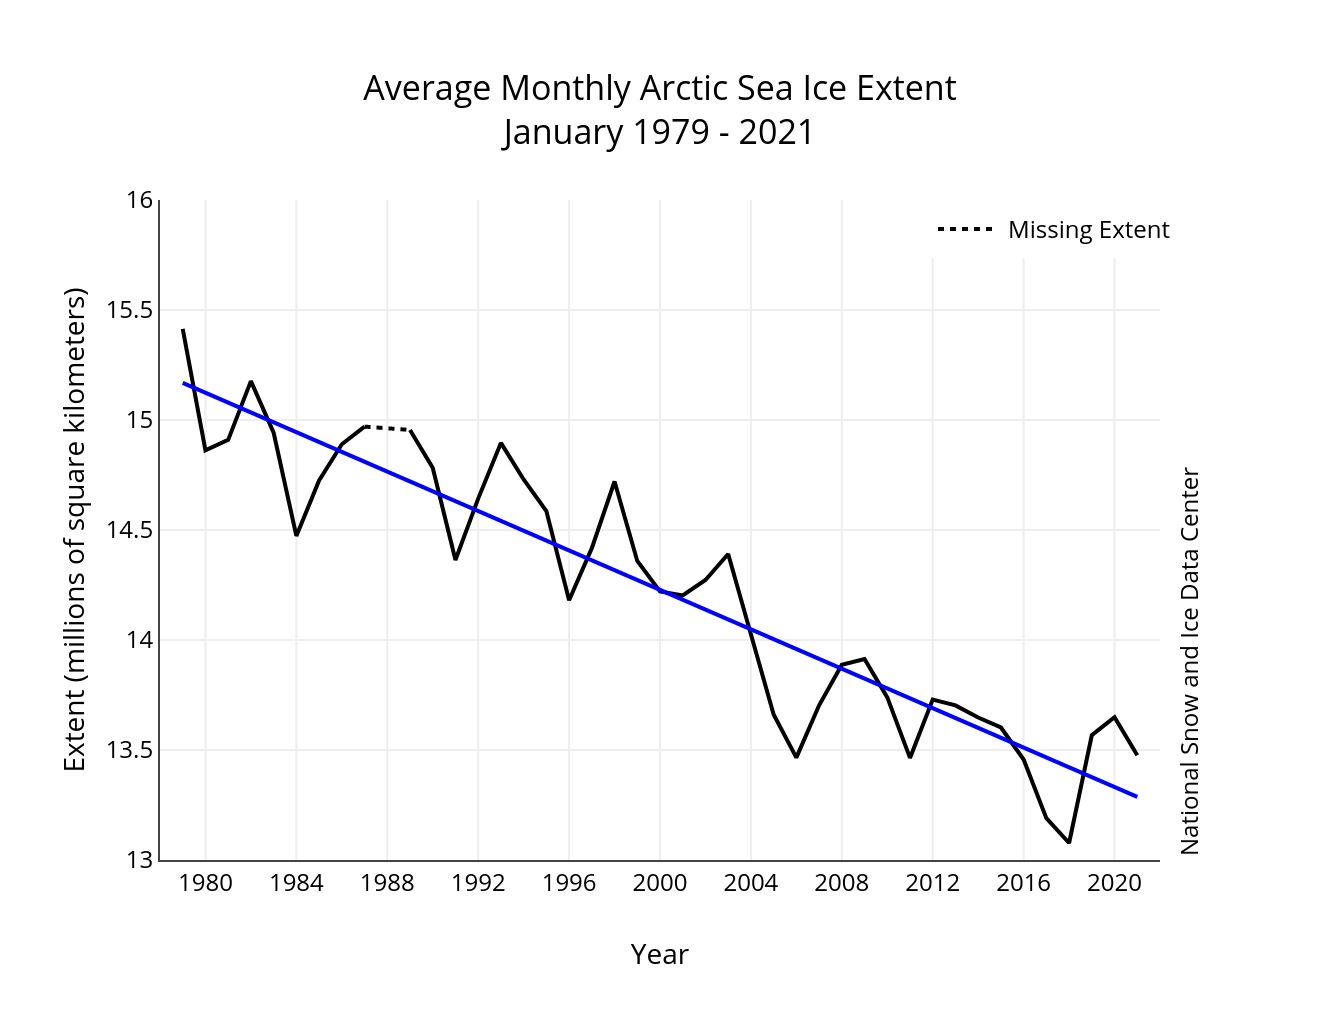
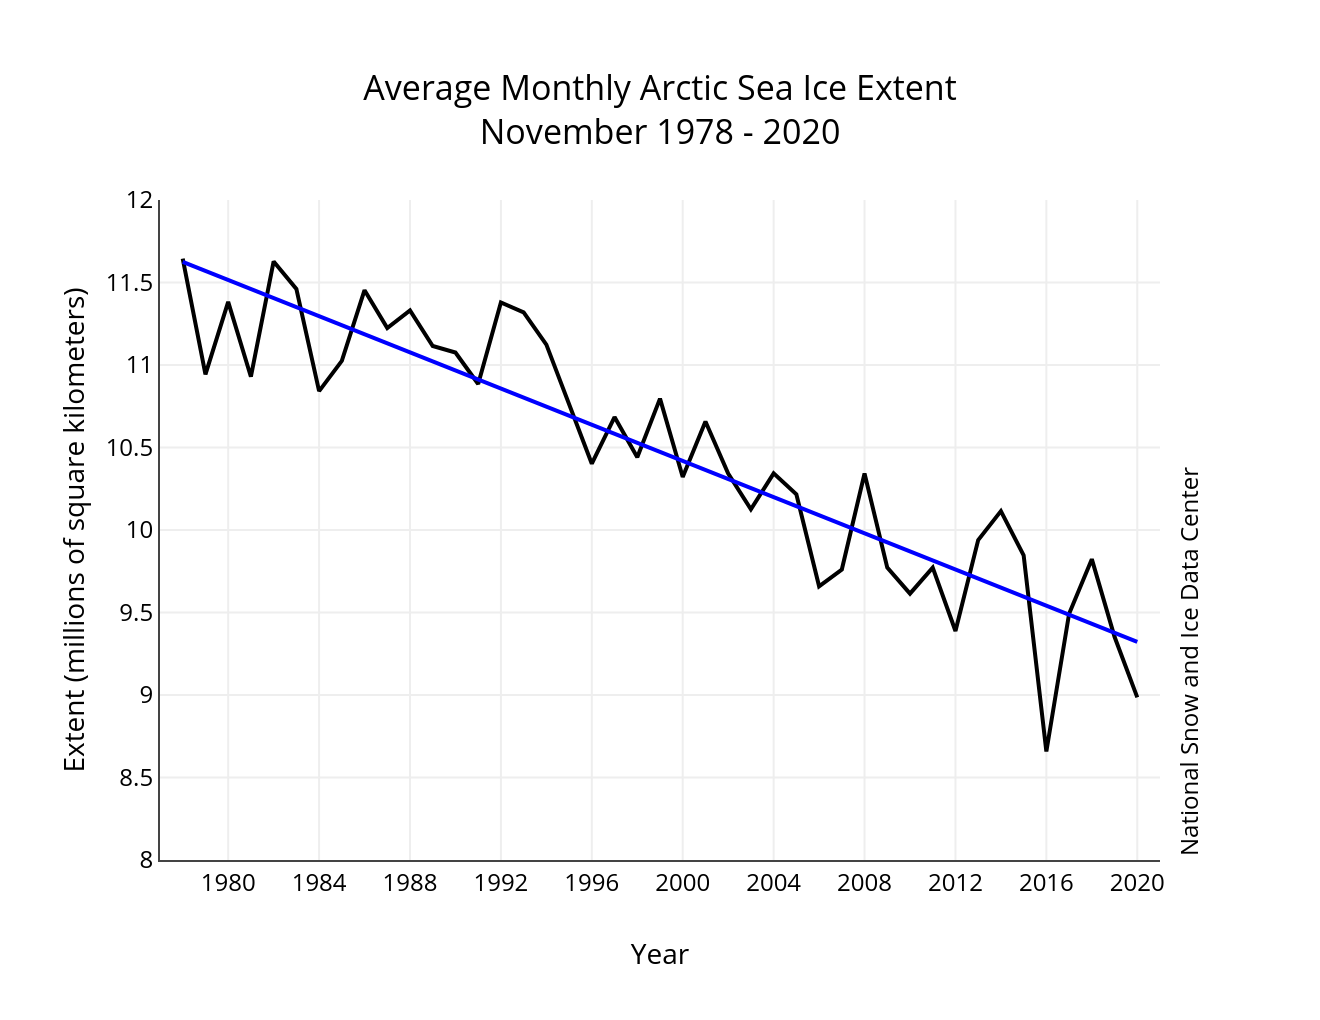
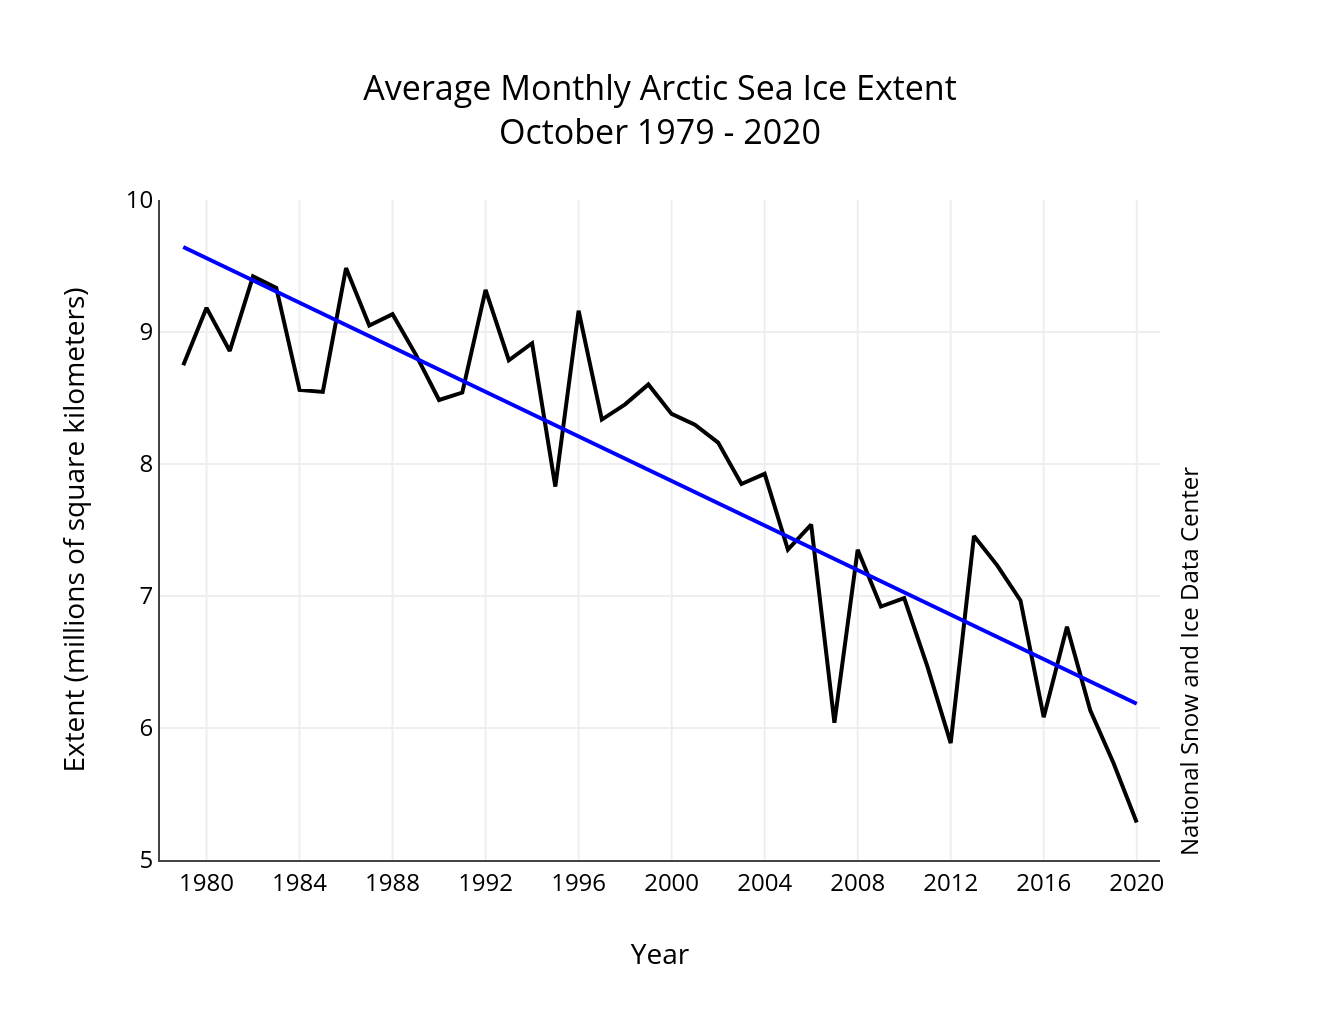
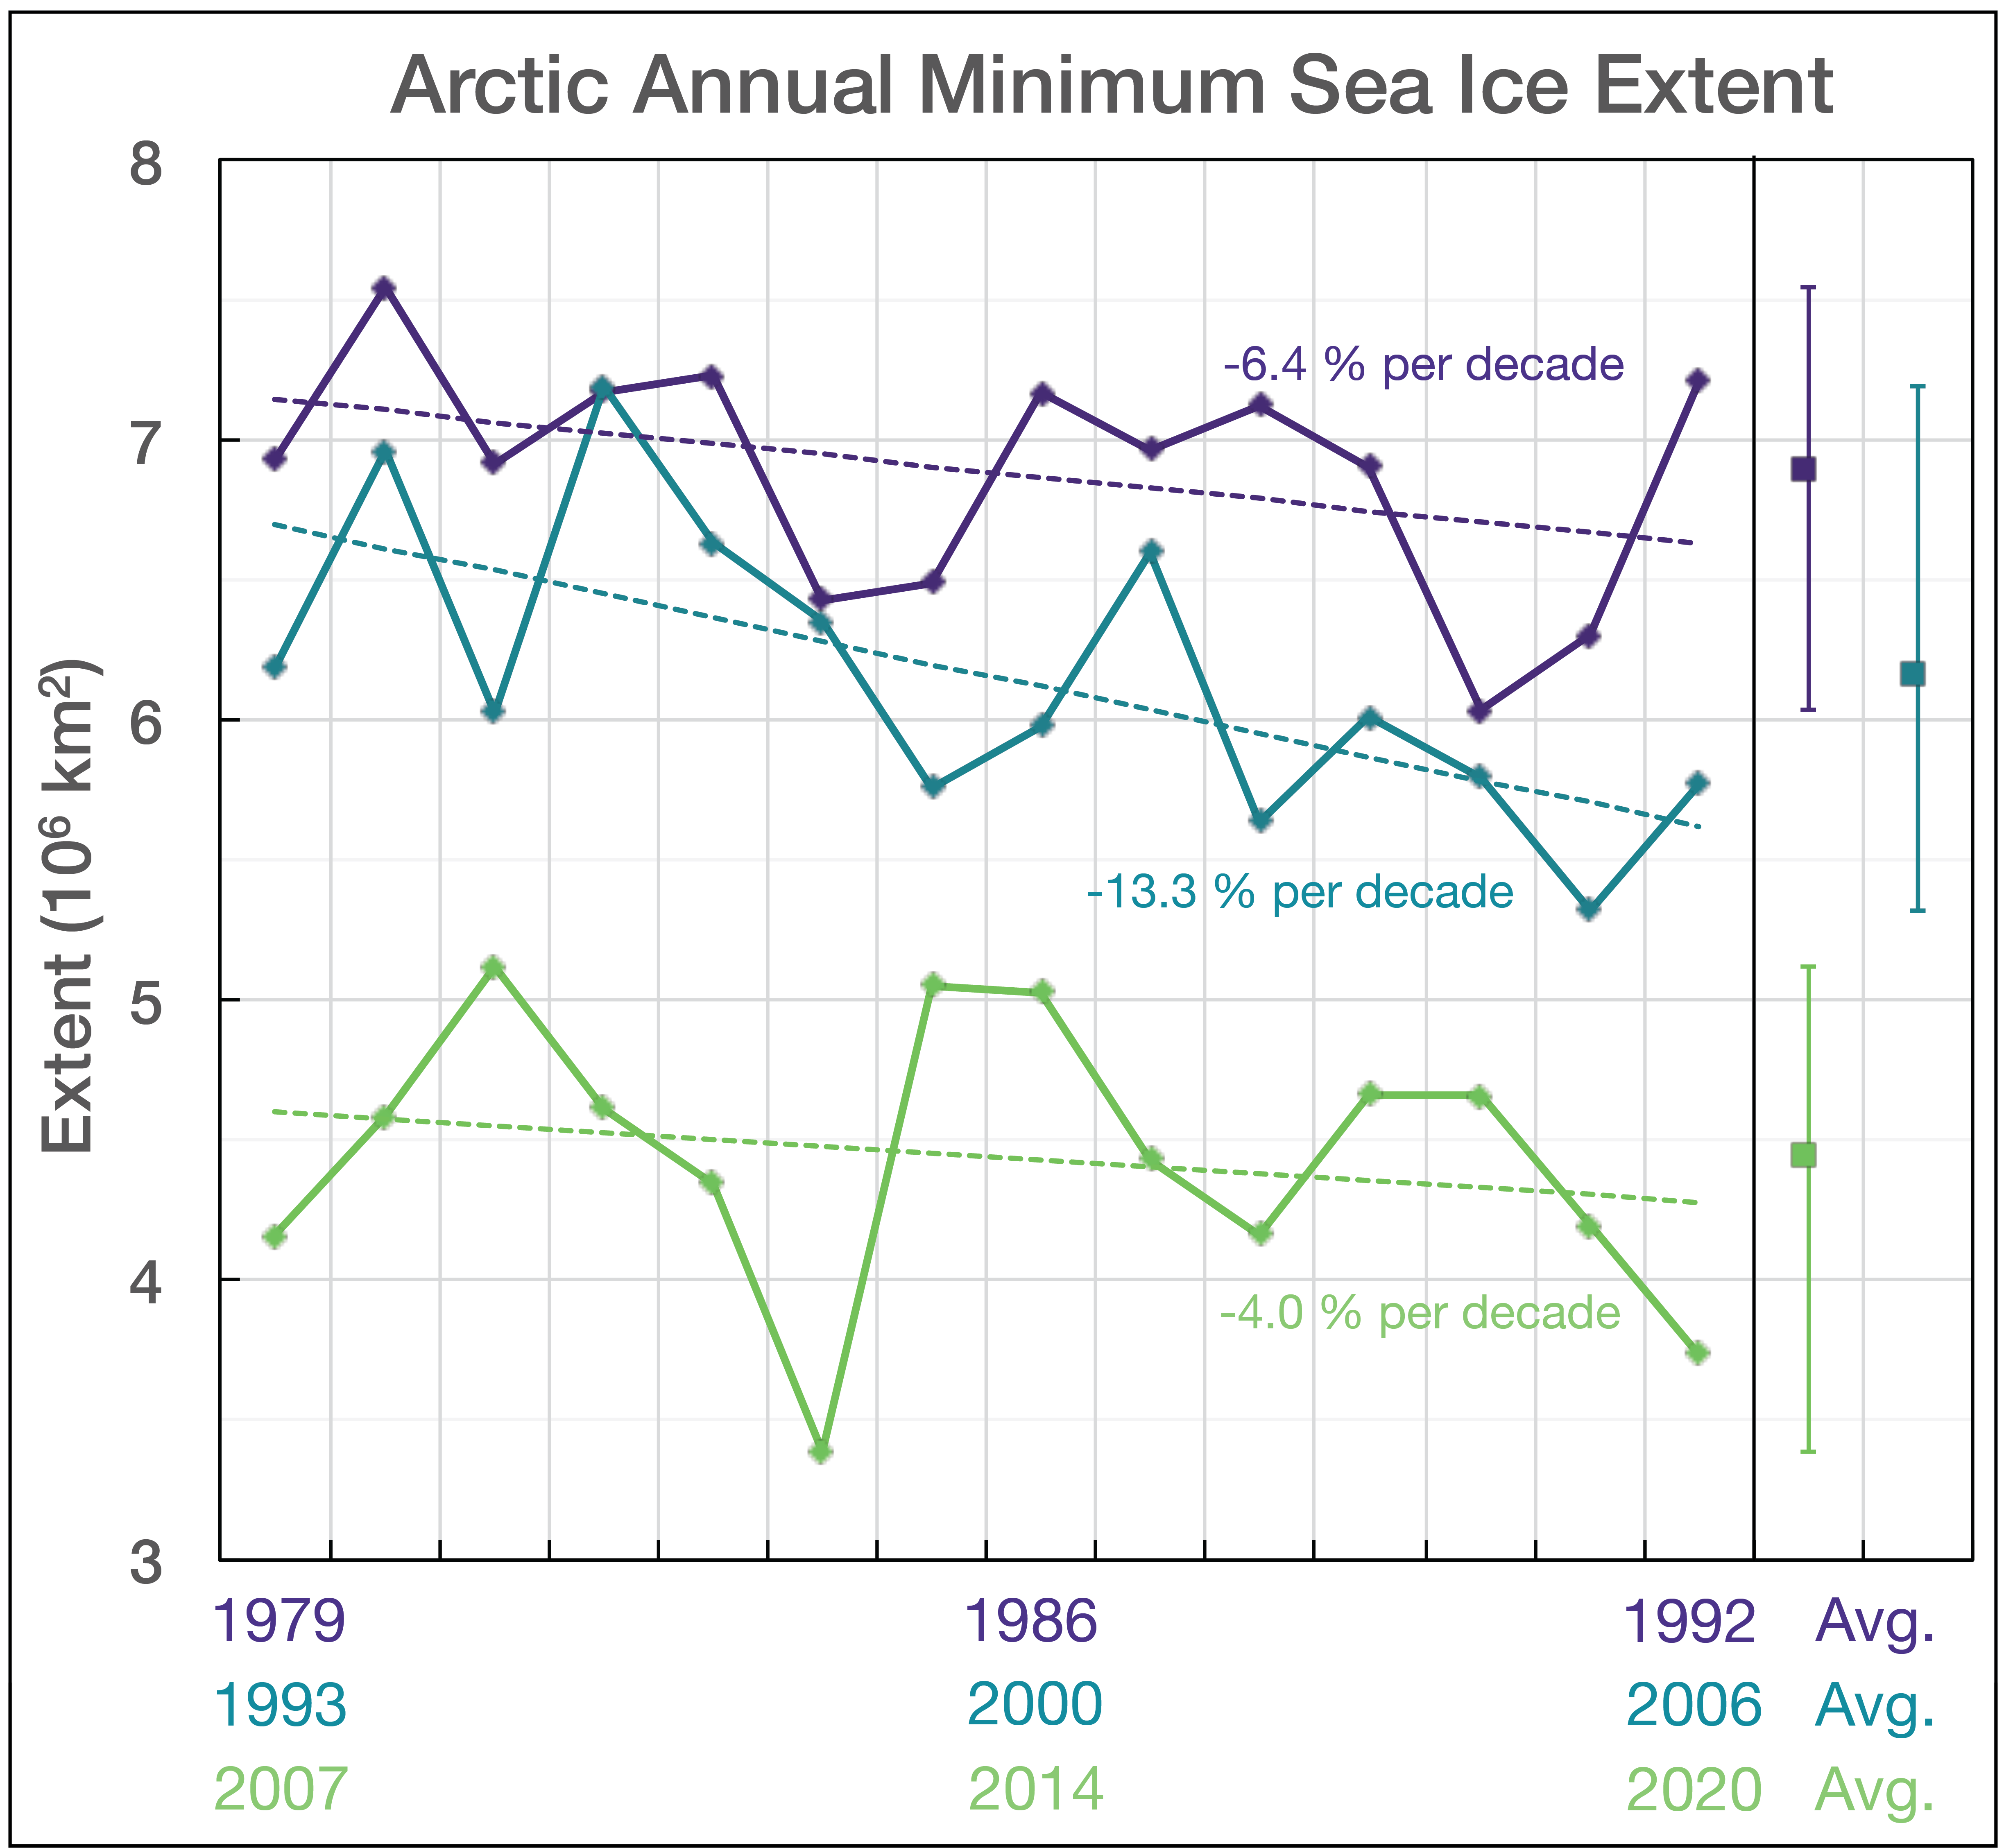
Figure 3. Monthly September ice extent for 1979 to 2020 shows a decline of 13.1 percent per decade.

Credit: National Snow and Ice Data Center
High-resolution image

The overall rate of sea ice decline in September is now at 83,700 square kilometers (32,300 square miles) per year, or a rate of ice loss of 13.1 percent per decade relative to the 1981 to 2010 average.

A look back at summer 2020

Ranking of Arctic Temperatures by month from 1979 to 2020

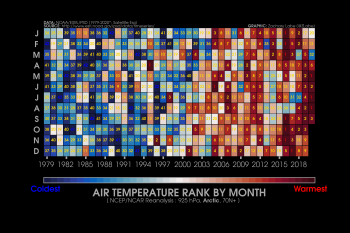
Figure 4a. This graphic ranks months based on their Arctic air temperature from 1979 to 2020 at 925 hPa from the National Centers for Environmental Prediction/National Center for Atmospheric Research (NCEP/NCAR) Reanalysis for all areas north of 70 degrees N. Dark reds indicate warmest months; dark blues indicate coldest months.

Credit: Z. Labe, Colorado State University, Colorado
High-resolution image

Arctic air temperatures for May through August 2020, difference from average

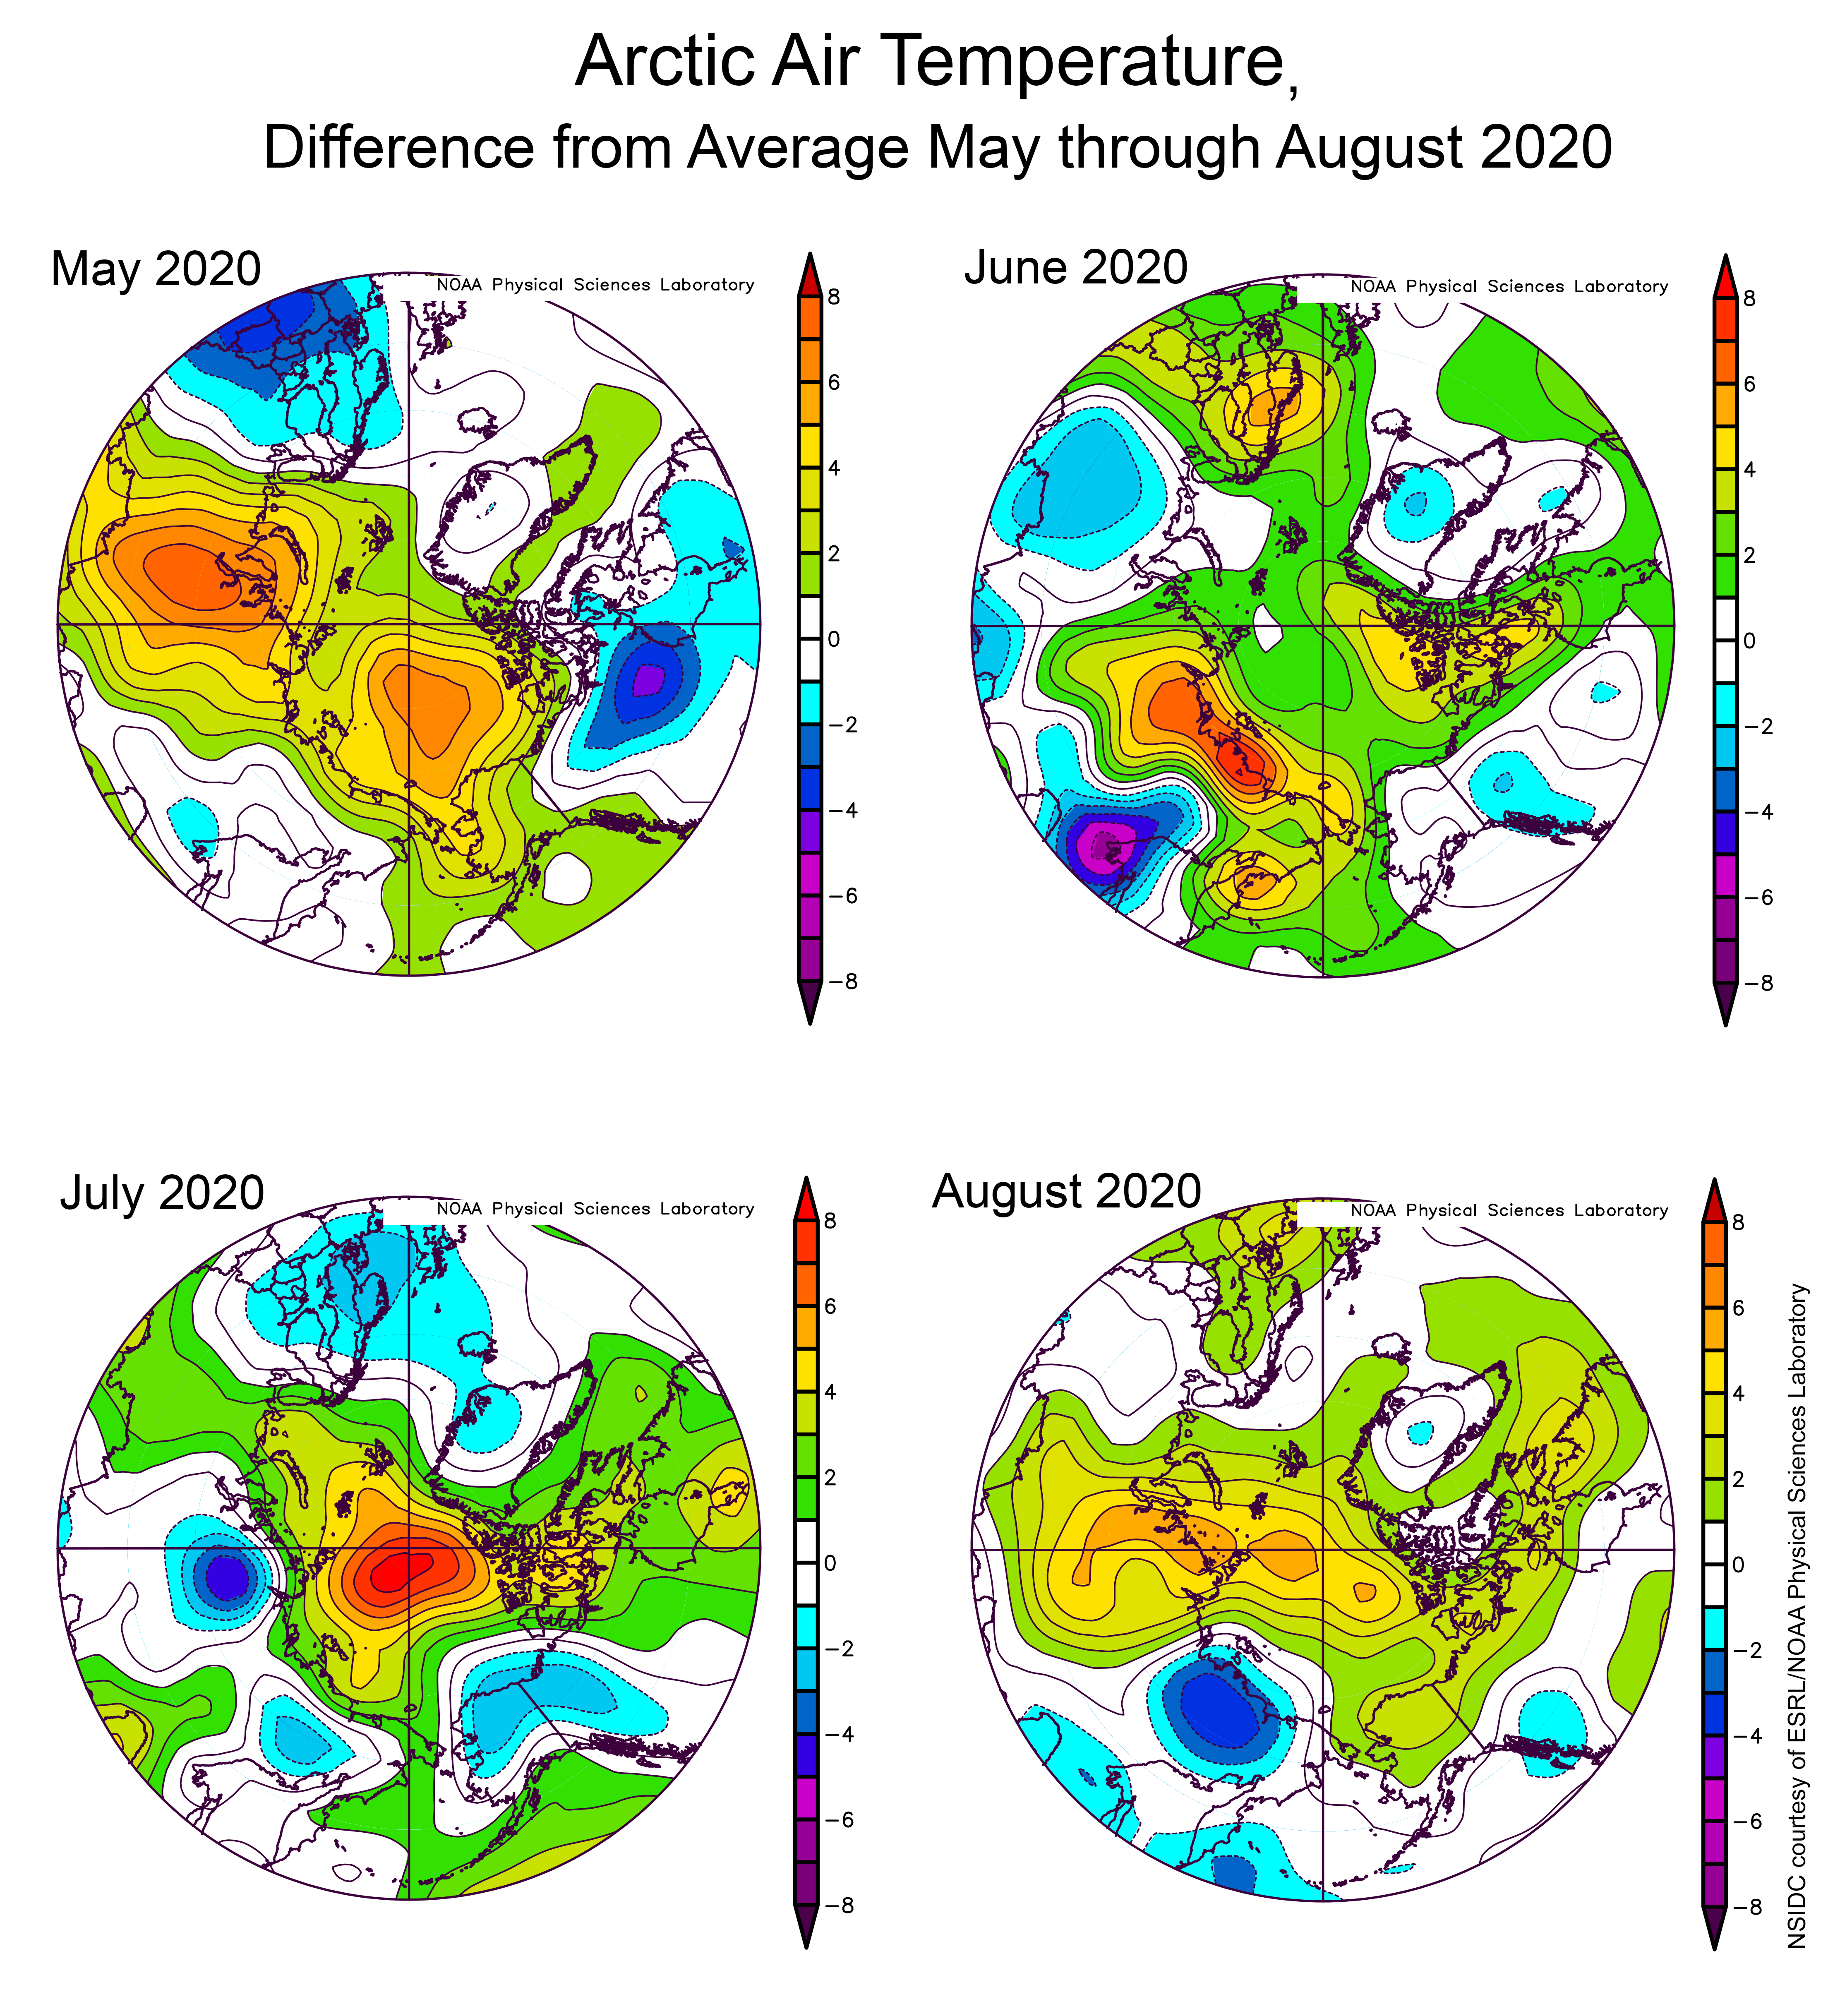
Figure 4b. This plot shows the departure from average air temperature in the Arctic at the 925 hPa level, in degrees Celsius, for May, June, July, and August 2020. Yellows and reds indicate higher than average temperatures; blues and purples indicate lower than average temperatures.

Credit: NSIDC courtesy NOAA Earth System Research Laboratory Physical Sciences Division
High-resolution image

Average sea level pressure for April, May, June, and July 2020

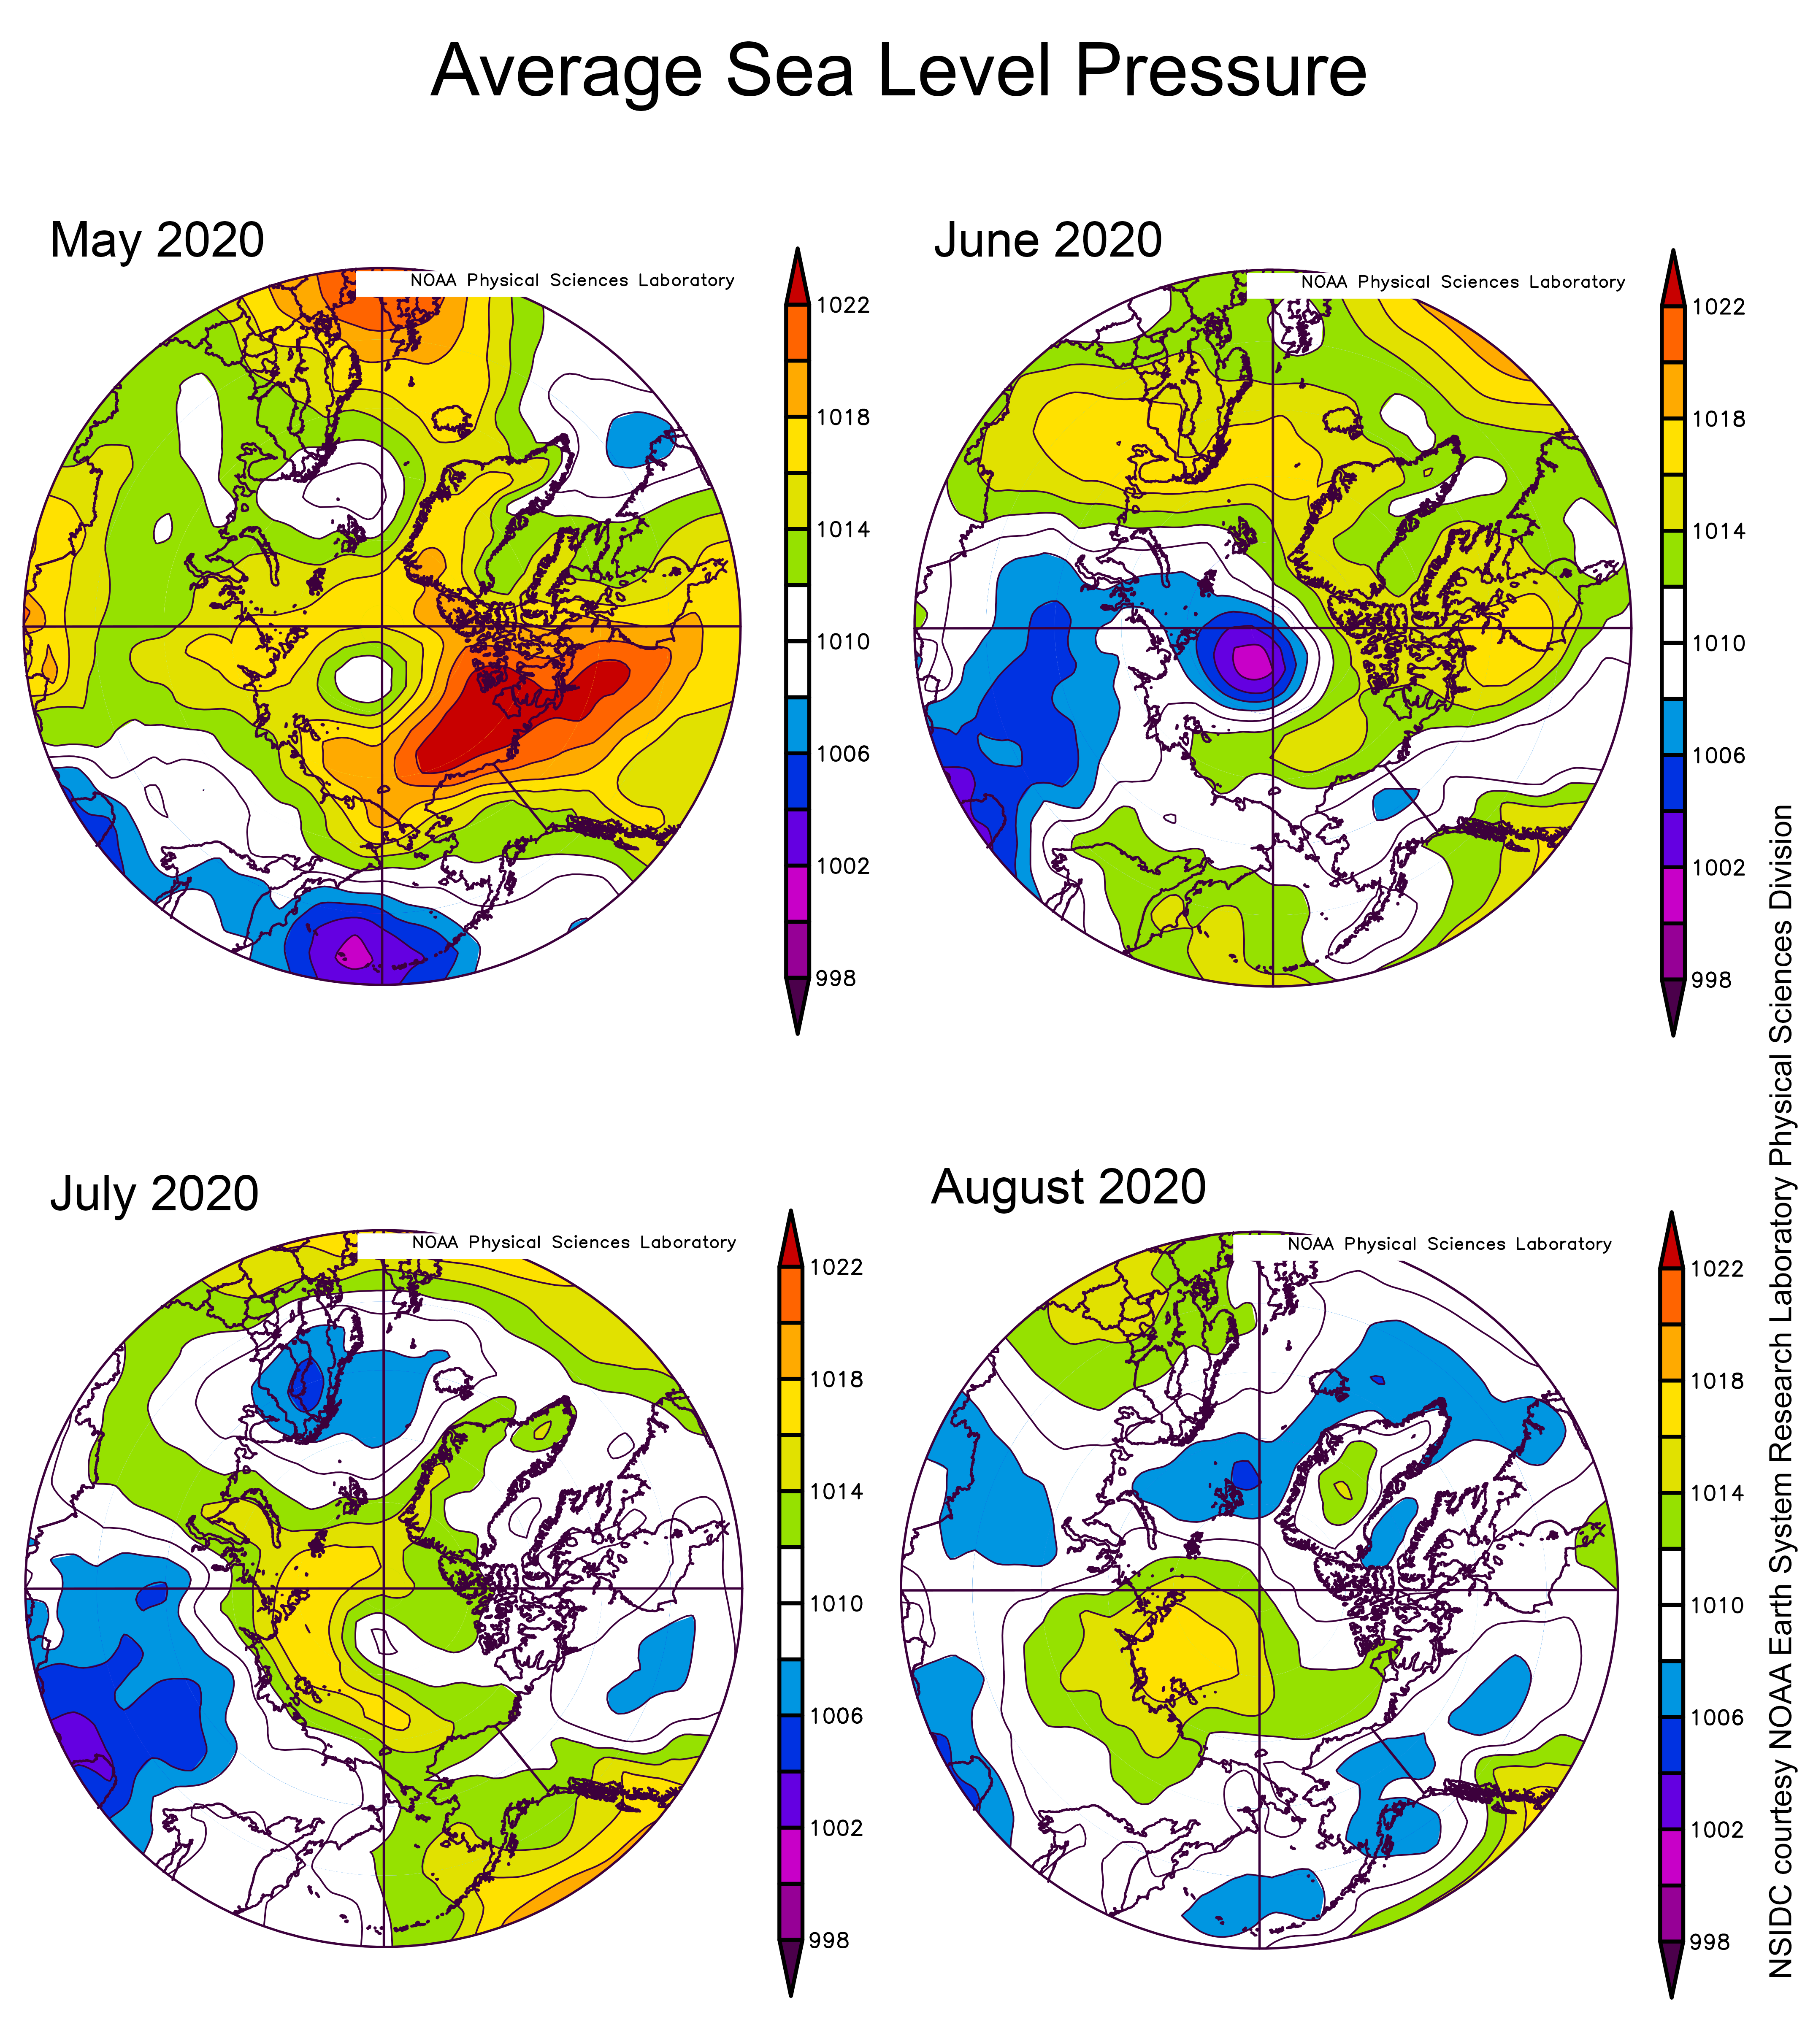
Figure 4c. These four plots show average sea level pressure in the Arctic in millibars (hPa) for May, June, July, and August 2020. Yellows and reds indicate high air pressure; blues and purples indicate low pressure.

Credit: NSIDC courtesy NOAA Earth System Research Laboratory Physical Sciences Division
High-resolution image

Sea surface temperatures (SST) in the Arctic Ocean

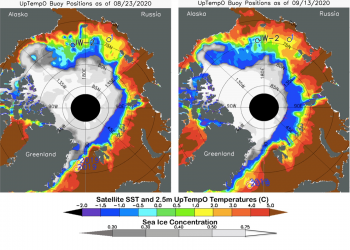
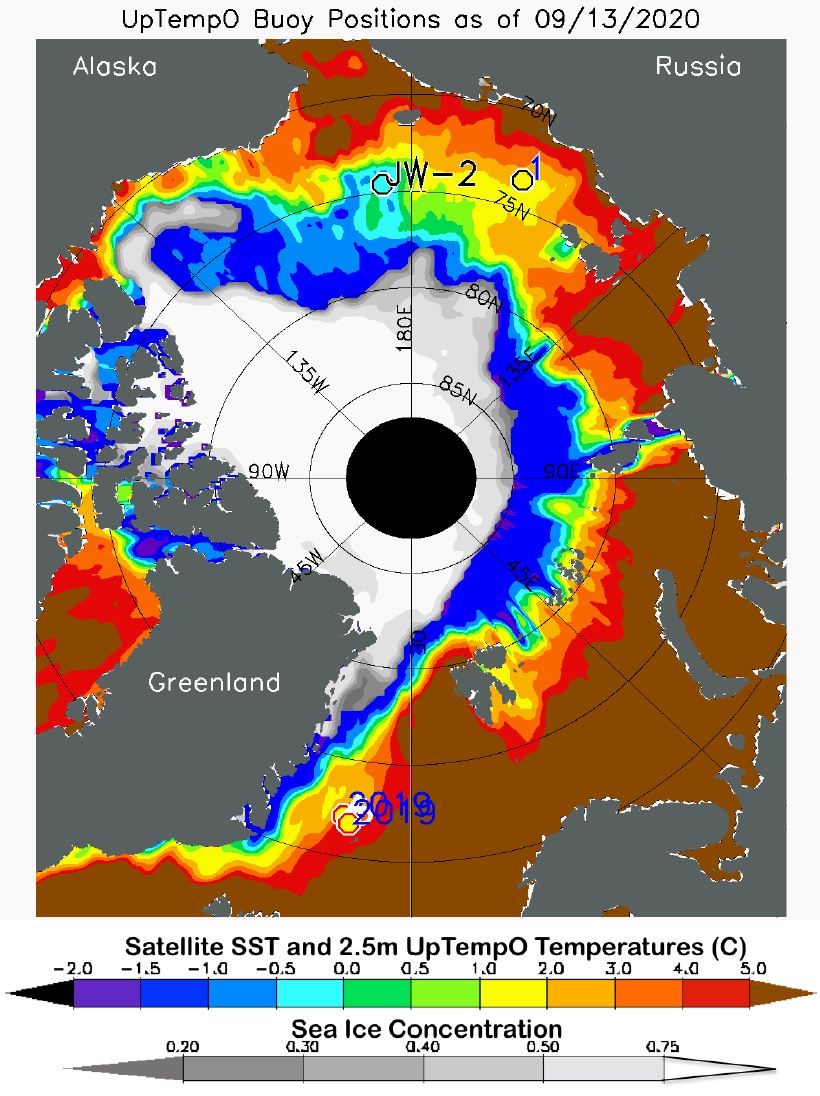
Figure 4d. These maps show sea surface temperature (SST) in degrees Celsius and sea ice concentration for August 23, 2020 on the left and September 13, 2020 on the right. SST data are from the University of Washington Polar Science Center Upper layer Temperature of the Polar Oceans (UptempO) buoys and satellite-derived values from the National Oceanic and Atmospheric Administration (NOAA), and ice concentration is from the NSIDC Sea Ice Index.

Credit: University of Washington
High-resolution image

While average and below average air temperature characterized the Arctic Ocean in the winter of 2019 to 2020, exceptionally warm conditions prevailed this past summer. Indeed, the summer of 2020 appears to be the warmest since at least 1979. According to the NCEP/NCAR reanalyses, monthly averaged air temperatures (at the 925 hPa level) over the Arctic Ocean, north of 70 degrees N, were at record highs in May, July, and August. June ranked as the second warmest behind 2005 (Figure 4a). Exceptionally high temperatures in May led to early development of melt ponds along the Russian coast (Figure 4b). This, combined with exceptional warmth over Siberia in June and thin ice in the region, fostered by the strongly positive phase of the Arctic Oscillation (AO) in winter (see discussion below), resulted in early development of open water within the Laptev Sea. This led to record low ice extent in the region starting in mid-June. By mid-July, Arctic sea ice extent was tracking at record lows over the period of satellite observations, fueled by the early ice retreat along the Russian coast.

Sea level pressure patterns this melt season shifted from month to month (Figure 4c). For example, high air temperatures in May were linked to a high pressure ridge over Alaska that extended into the Beaufort and Chukchi Seas. Meanwhile, unusually low pressure was focused over the central Arctic Ocean and Scandinavia, driving winds from the south over to the Kara Sea. In June, the high pressure moved over to the western Arctic Ocean. High pressure also developed throughout the Canadian Arctic Archipelago, Greenland, and Scandinavia. This, combined with low sea level pressure near the pole and over the Kara Sea and Eurasia, spilled cold Arctic air into Eurasia and warm air over Siberia. In July, the high pressure ridge moved further east to the Kara and Laptev Seas. Coupled with low pressure over Siberia and Scandinavia, this circulation pattern funneled warm air from Scandinavia and Eurasia towards the pole, while pushing cold Arctic air from the Kara Sea over to Russia and from the central Arctic over to Alaska.

As August started, the pace of ice loss slowed and by the end of the month, total Arctic sea ice extent went from the lowest to the second lowest in the satellite record. This was despite August being the warmest August recorded since at least 1979.

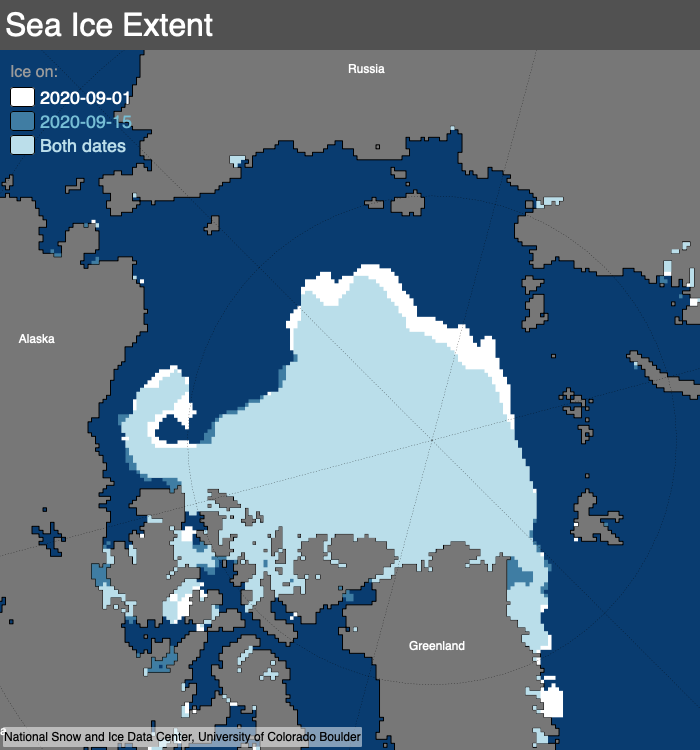
By late August, sea surface temperatures showed large variations across the Arctic, with generally warm water to the south and colder, near-freezing water near the ice edge in most locations (Figure 4d). According to our colleague Mike Steele at the University of Washington, this cold water persists near the ice edge as the ocean gives up its heat to melt ice; this signals the last stage of summer ice retreat. The resulting new open water hardly warms up because there is little atmospheric heating late in the season from lack of solar energy. An exception is the eastern Beaufort Sea, where ice was swept southward this year into warm water along the northern coast of northwest Canada and Alaska. By mid-September, the cold northern band of sea surface temperatures expanded in response to continued ice retreat and weak atmospheric heating of the ocean. Many areas, such as the Beaufort and Chukchi Seas, Canada Basin, and Baffin Bay, had lower sea surface temperatures at this time relative to August. This surface cooling happens as the calm winds of summer  are replaced by windier conditions in the fall, which mixes the ocean heat downward. The date of maximum sea surface temperature is often earlier than the date of minimum sea ice extent. This is not so evident in the eastern Arctic Ocean, possibly because of the influence of warm ocean currents that continue to pump heat into the area through late summer.

Comment on the northernmost ice edge position in the Kara and Barents Seas

Three-month average Arctic Oscillation from 1950 to August 2020


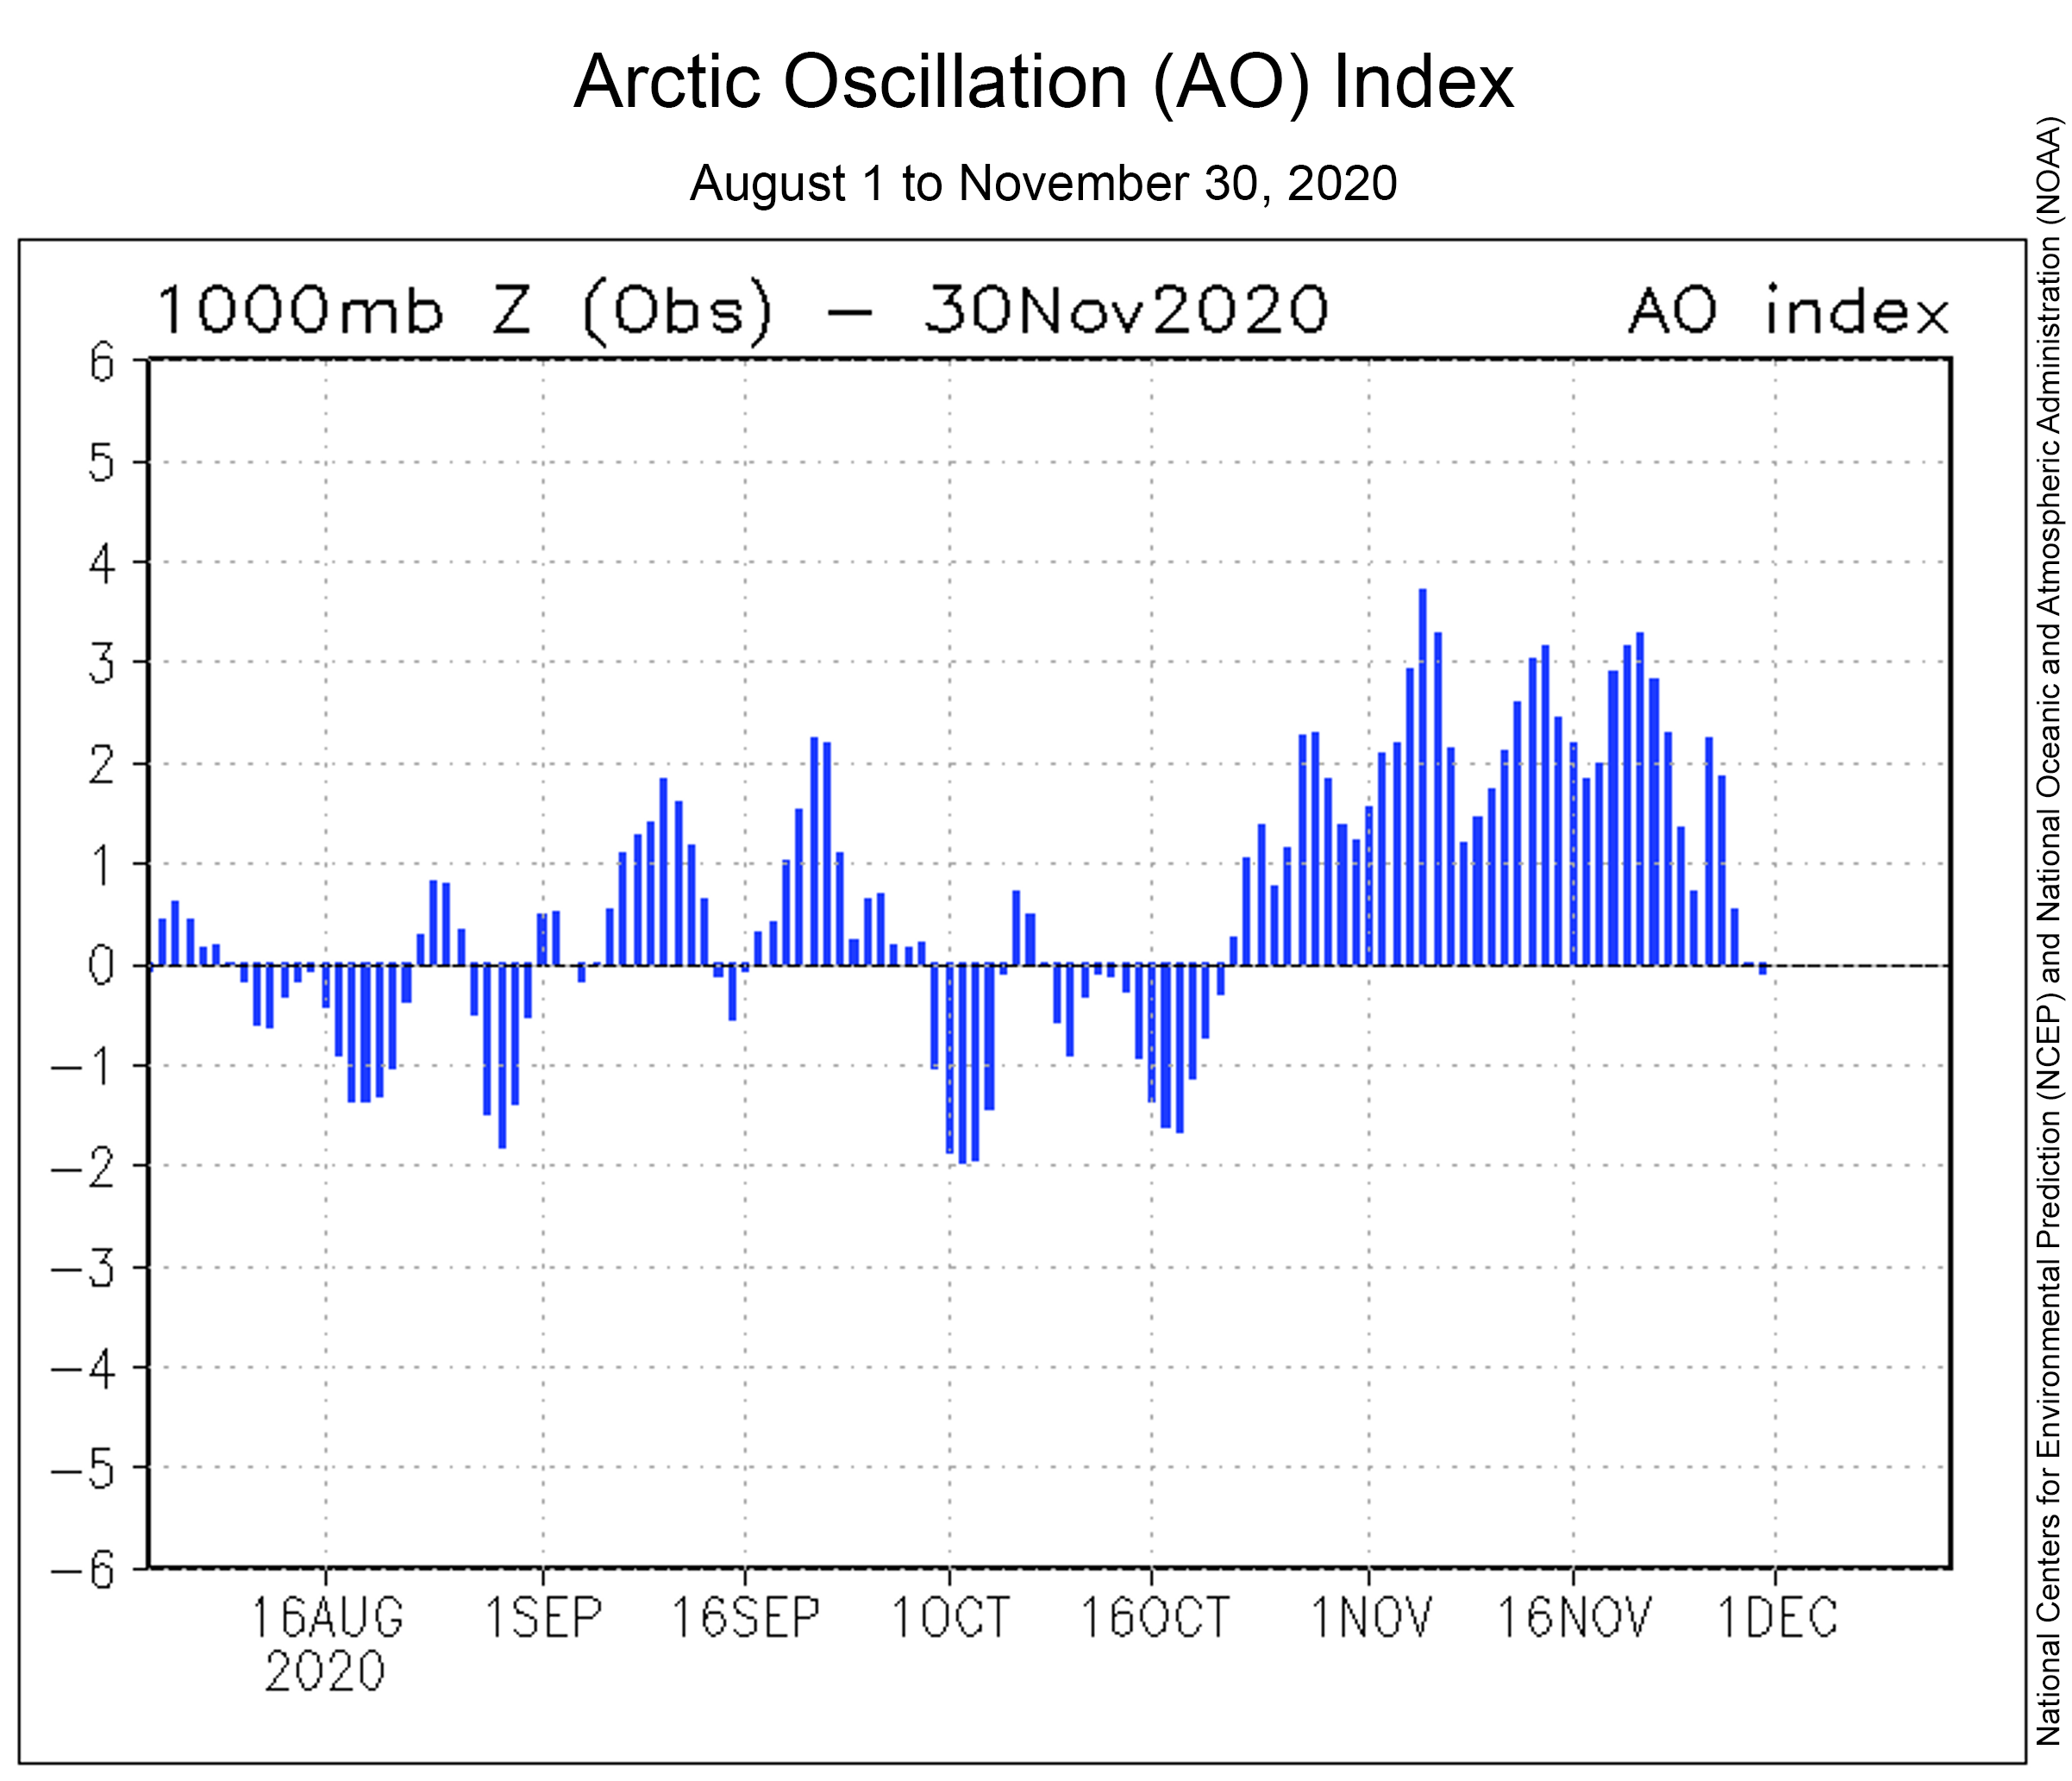
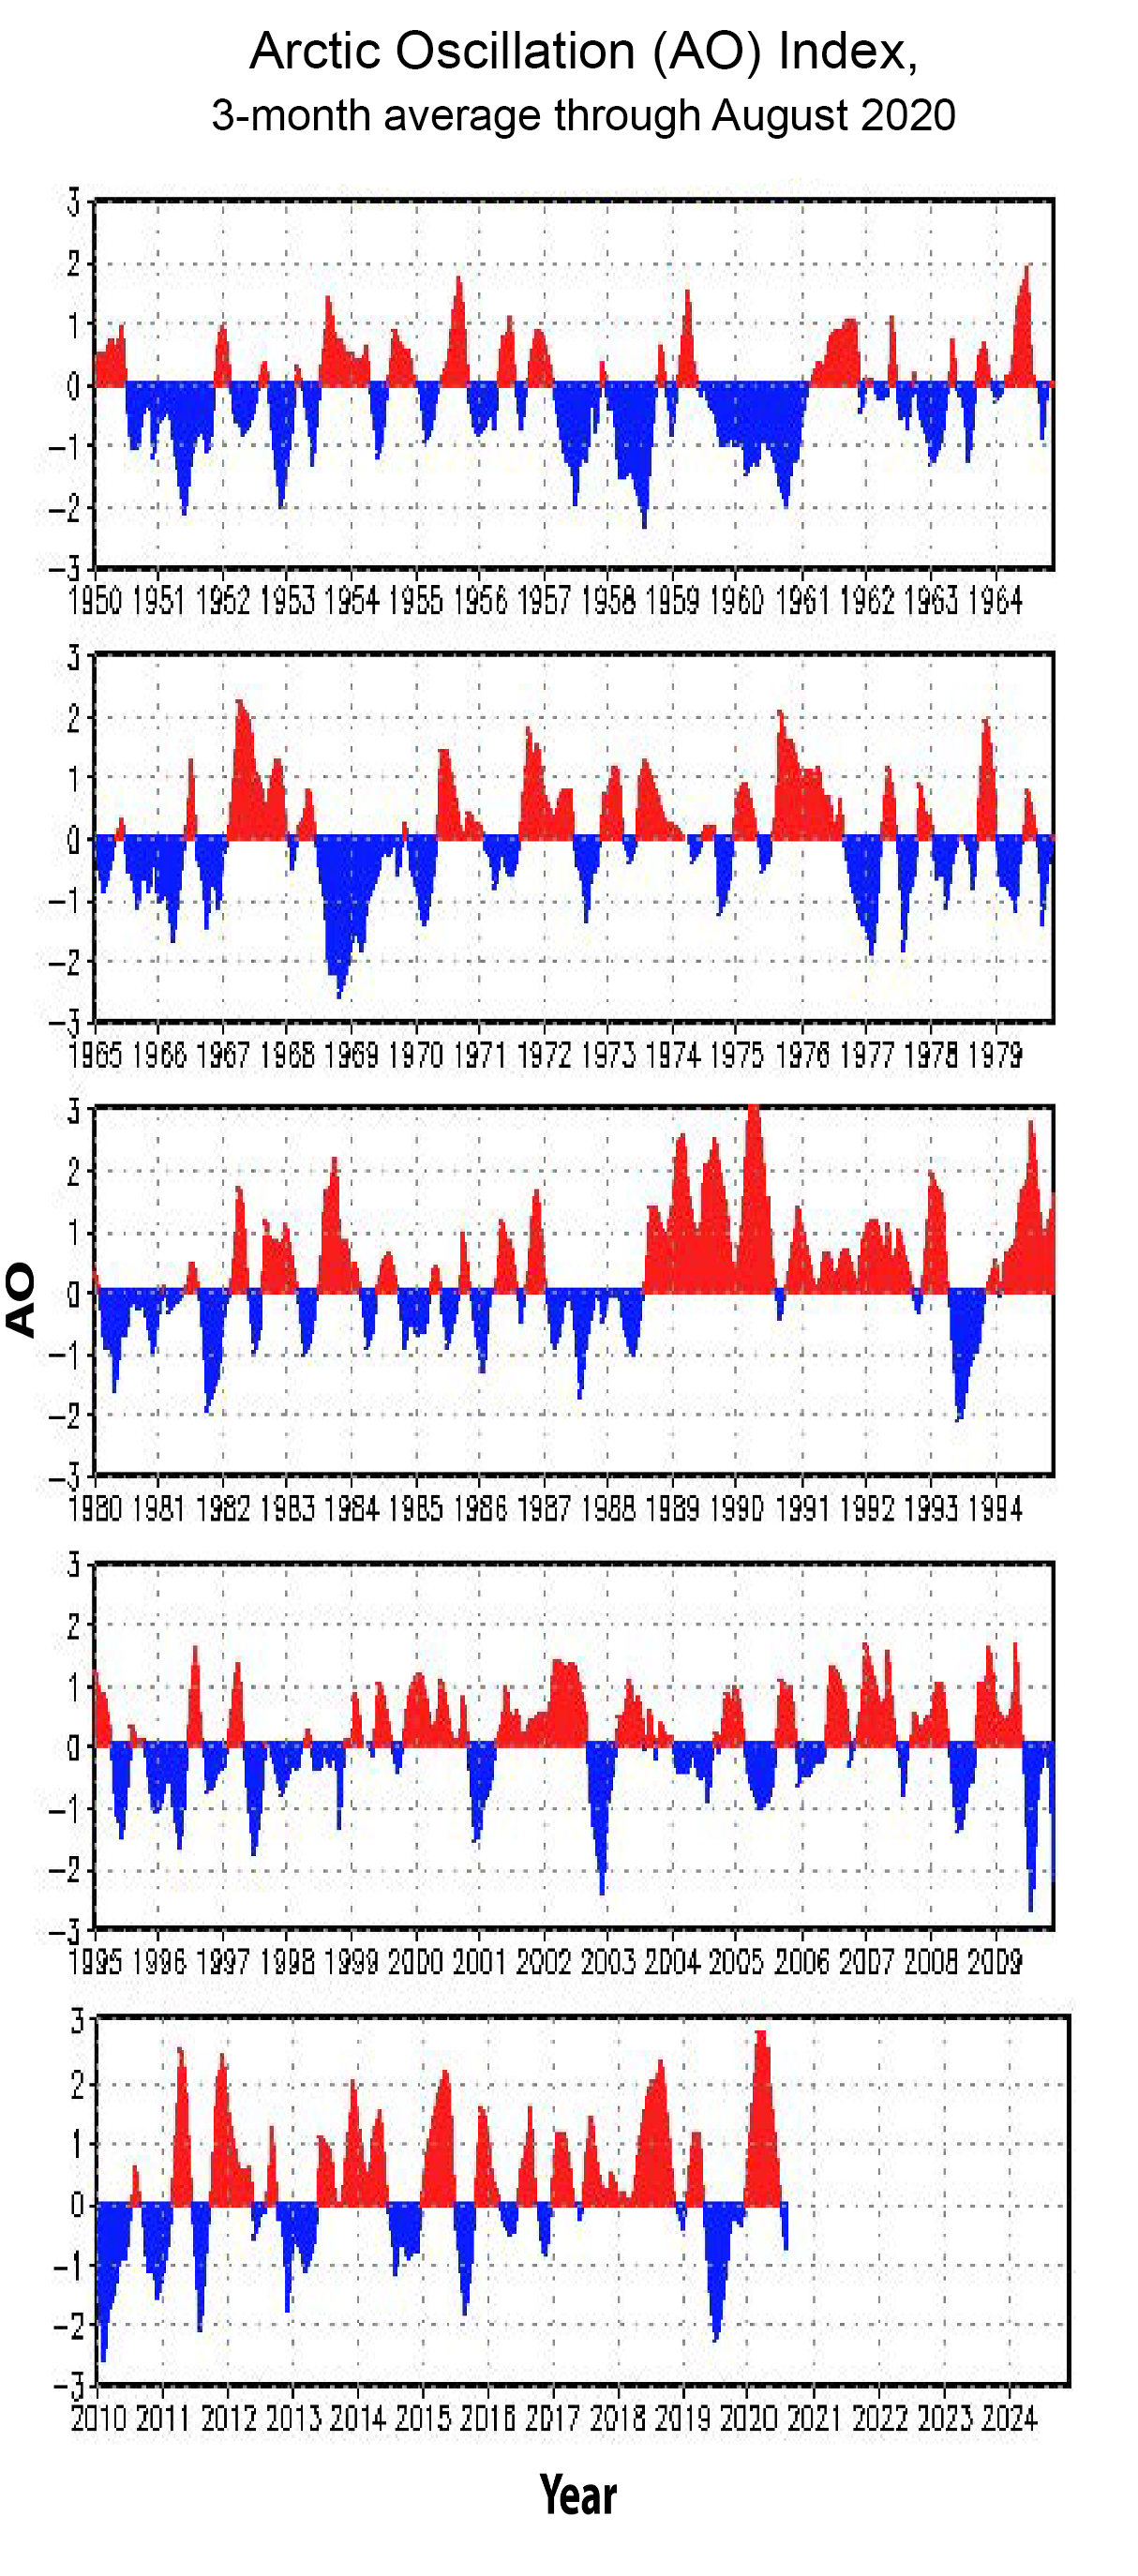
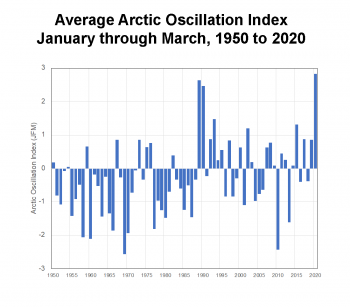
Figure 5. These graphs show the 3-month average Arctic Oscillation (AO) index from 1950 through August 2020.

Credit: National Centers for Environmental Prediction (NCEP) and National Oceanic and Atmospheric Administration
High-resolution image

The near record minimum Arctic sea ice extent in September 2020, and particularly the loss of ice along the Russian margin of the Arctic Ocean, is consistent with wind patterns associated with the persistently strong positive phase of the Arctic Oscillation (AO) this past winter. During the positive phase of the winter AO, there tends to be a pattern of offshore winds along the Russian side of the Arctic, drawing ice out of the Siberian shelf seas (Kara, Laptev, East Siberian, and Chukchi Seas) and causing new ice formation in the openings left behind. The result is that the spring ice cover along the Siberian coast is thinner than usual and more likely to melt out in summer. The 2019 to 2020 winter AO was at a record or near record positive phase (Figure 5). According to our colleague Jamie Morrison at the University of Washington, this summer’s pronounced retreat of ice north of the Laptev-Kara-Barents-Seas region is consistent with the effects of the positive winter AO. Morison notes that the winter AO has been generally positive over the past 30 years, particularly so over the last 10 years. He speculates that the atmospheric circulation pattern associated with the AO may also favor a greater influence of Atlantic water heat on the sea ice cover through weakening the cold halocline layer—the cold, but low density water at the ocean surface.

Arctic sea ice age

Arctic sea ice age map at end of 2020 melt season

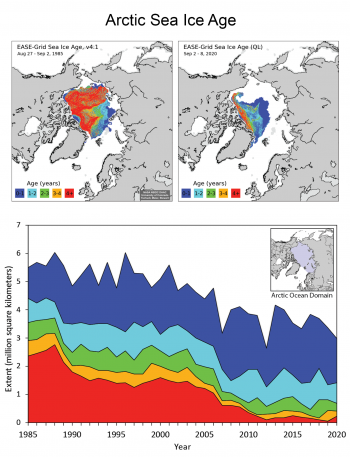
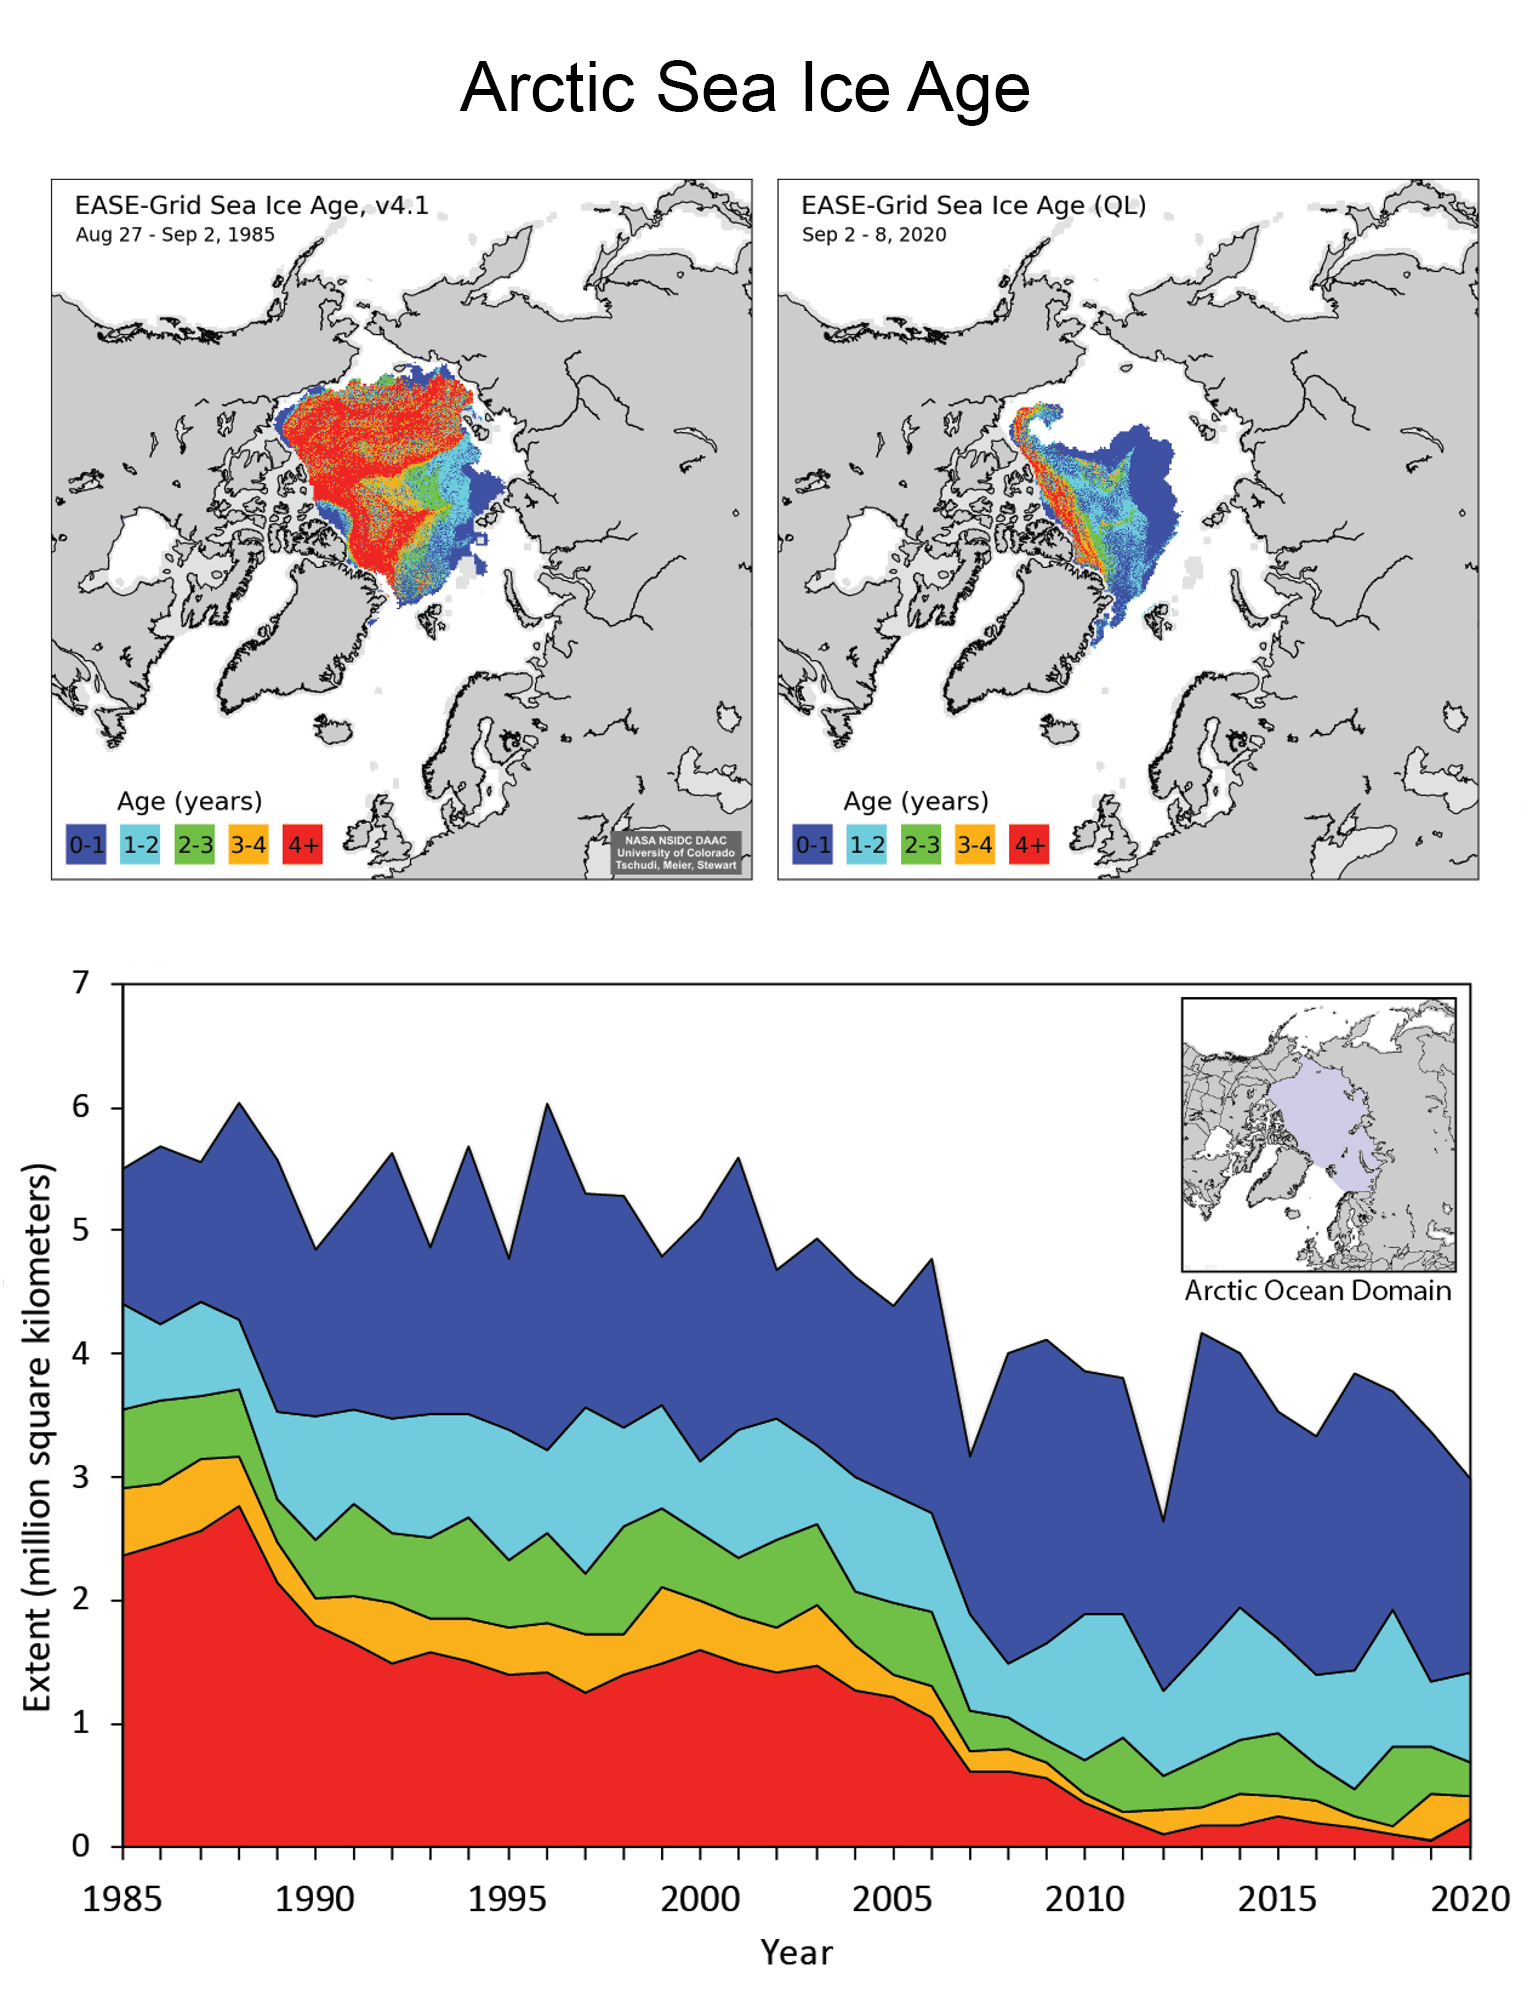
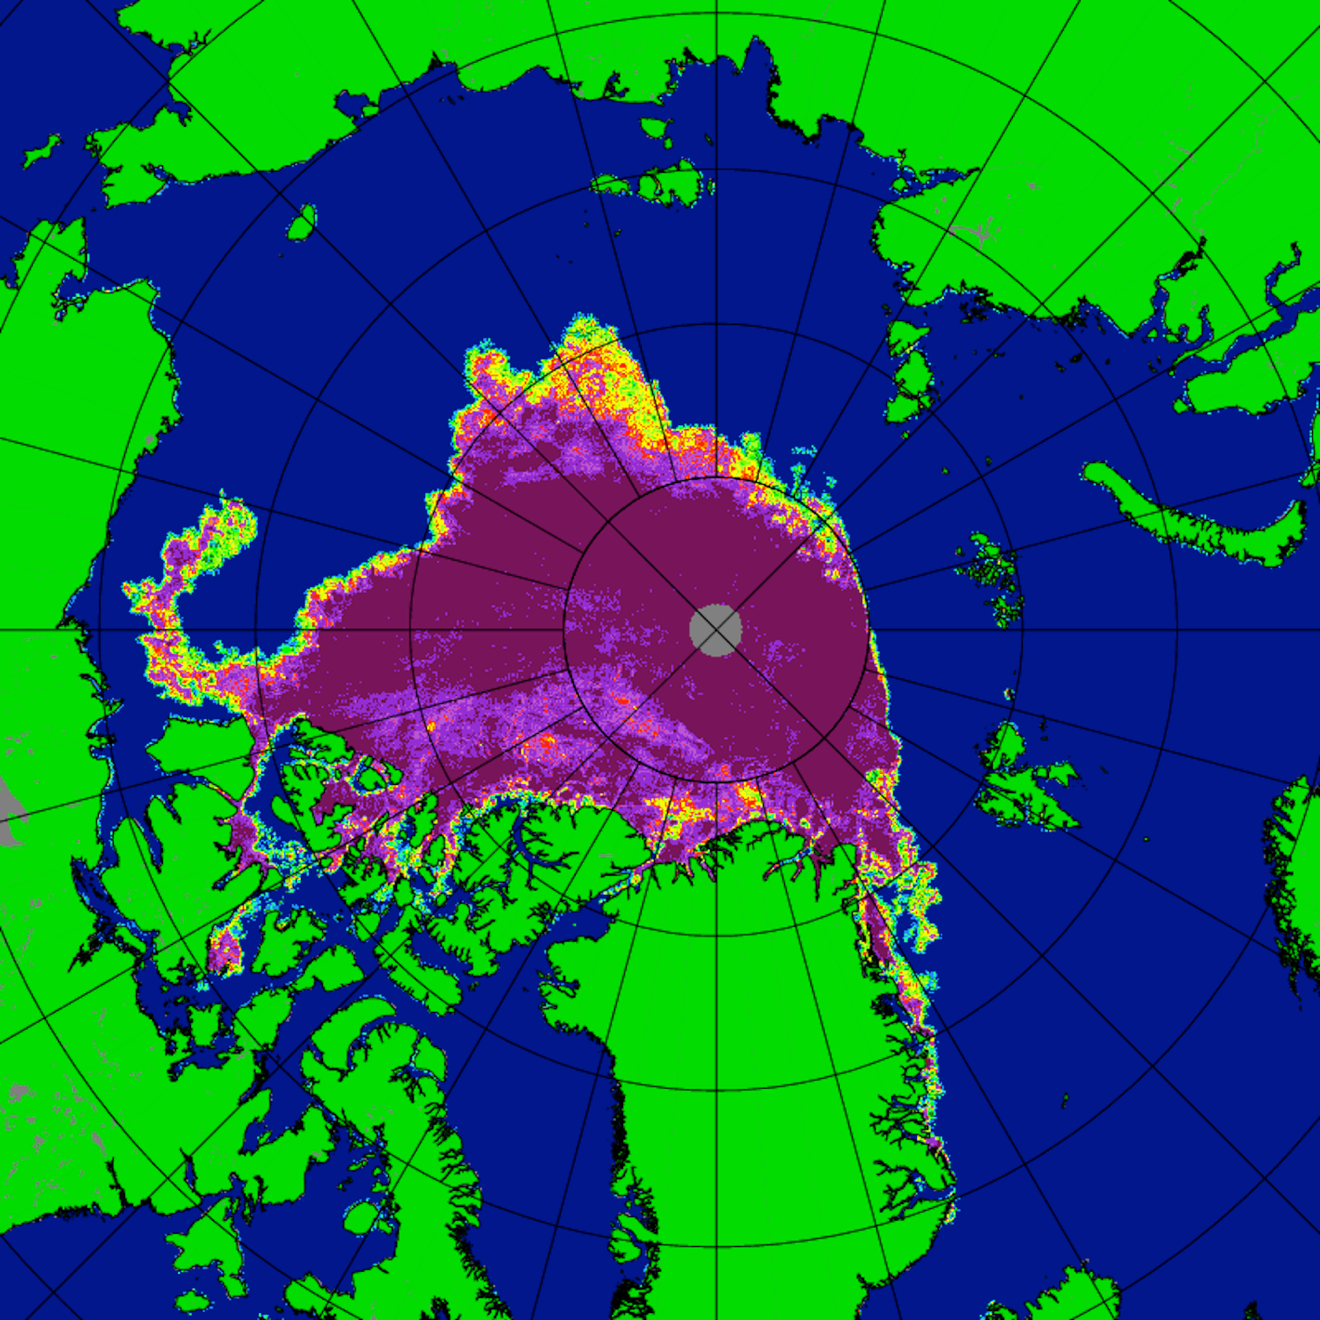
Figure 6. The upper left map shows sea ice age distribution toward the end of the melt season for 1985 and the upper right map shows the end of the 2020 melt season. The bottom time series of different age categories shows the minimum extent for 1985 to 2020. Note that the ice age product does not include ice in the Canadian Archipelago. Data from Tschudi et al., EASE-Grid Sea Ice Age, Version 3

Credit: W. Meier, National Snow and Ice Data Center and M. Tschudi et al.
High-resolution image

With the minimum reached, the remaining sea ice has had its “birthday,” aging one year. Assessing the ice age just before this birthday gives an indication of the health of the ice at the end of the melt season. The extent of the oldest ice (4+ years old) at that time in 2020 was 230,000 square kilometers (89,000 square miles). This is considerably higher compared to last year, when the 4+ year old ice extent stood at 55,000 square kilometers (21,000 square miles) at the 2019 minimum. The increase in 4+ year old ice in 2020 was compensated by a slight decrease in 2- to 3-year old ice and 3- to 4-year old ice (Figure 6). Overall, since the 1980s, when older ice covered over 2 million square miles (772,000 square miles) of the Arctic Ocean, sea ice has become much thinner and younger. The linear downward trend in 4+ year old ice extent at the sea ice minimum is 70,000 square kilometers (27,000 square miles) per year, equivalent to a decline of 6.1 percent per year relative to the 1984 to 2020 average.

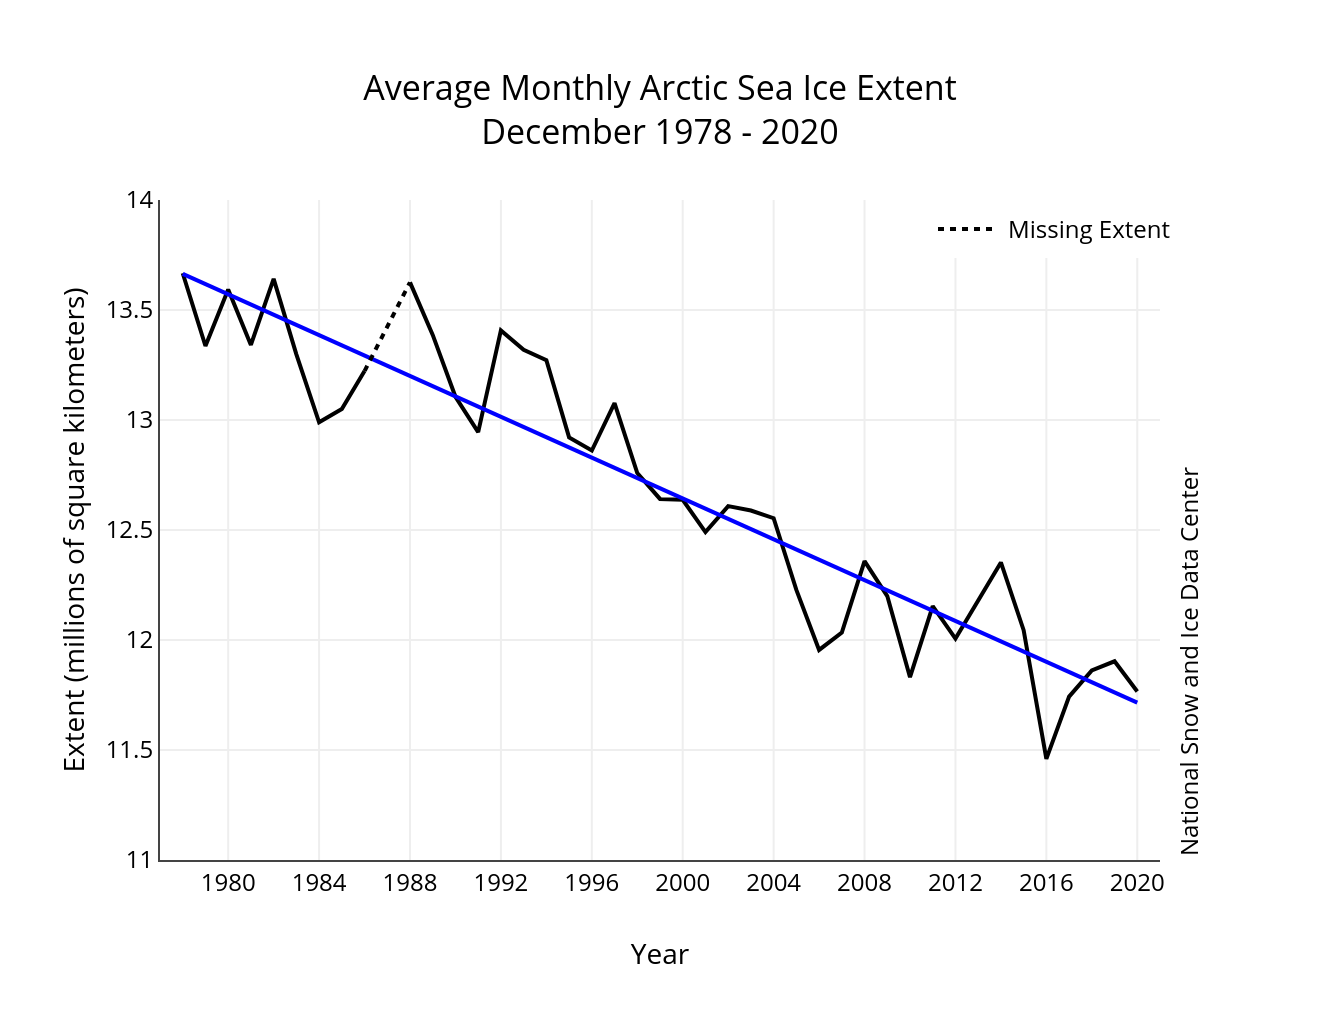
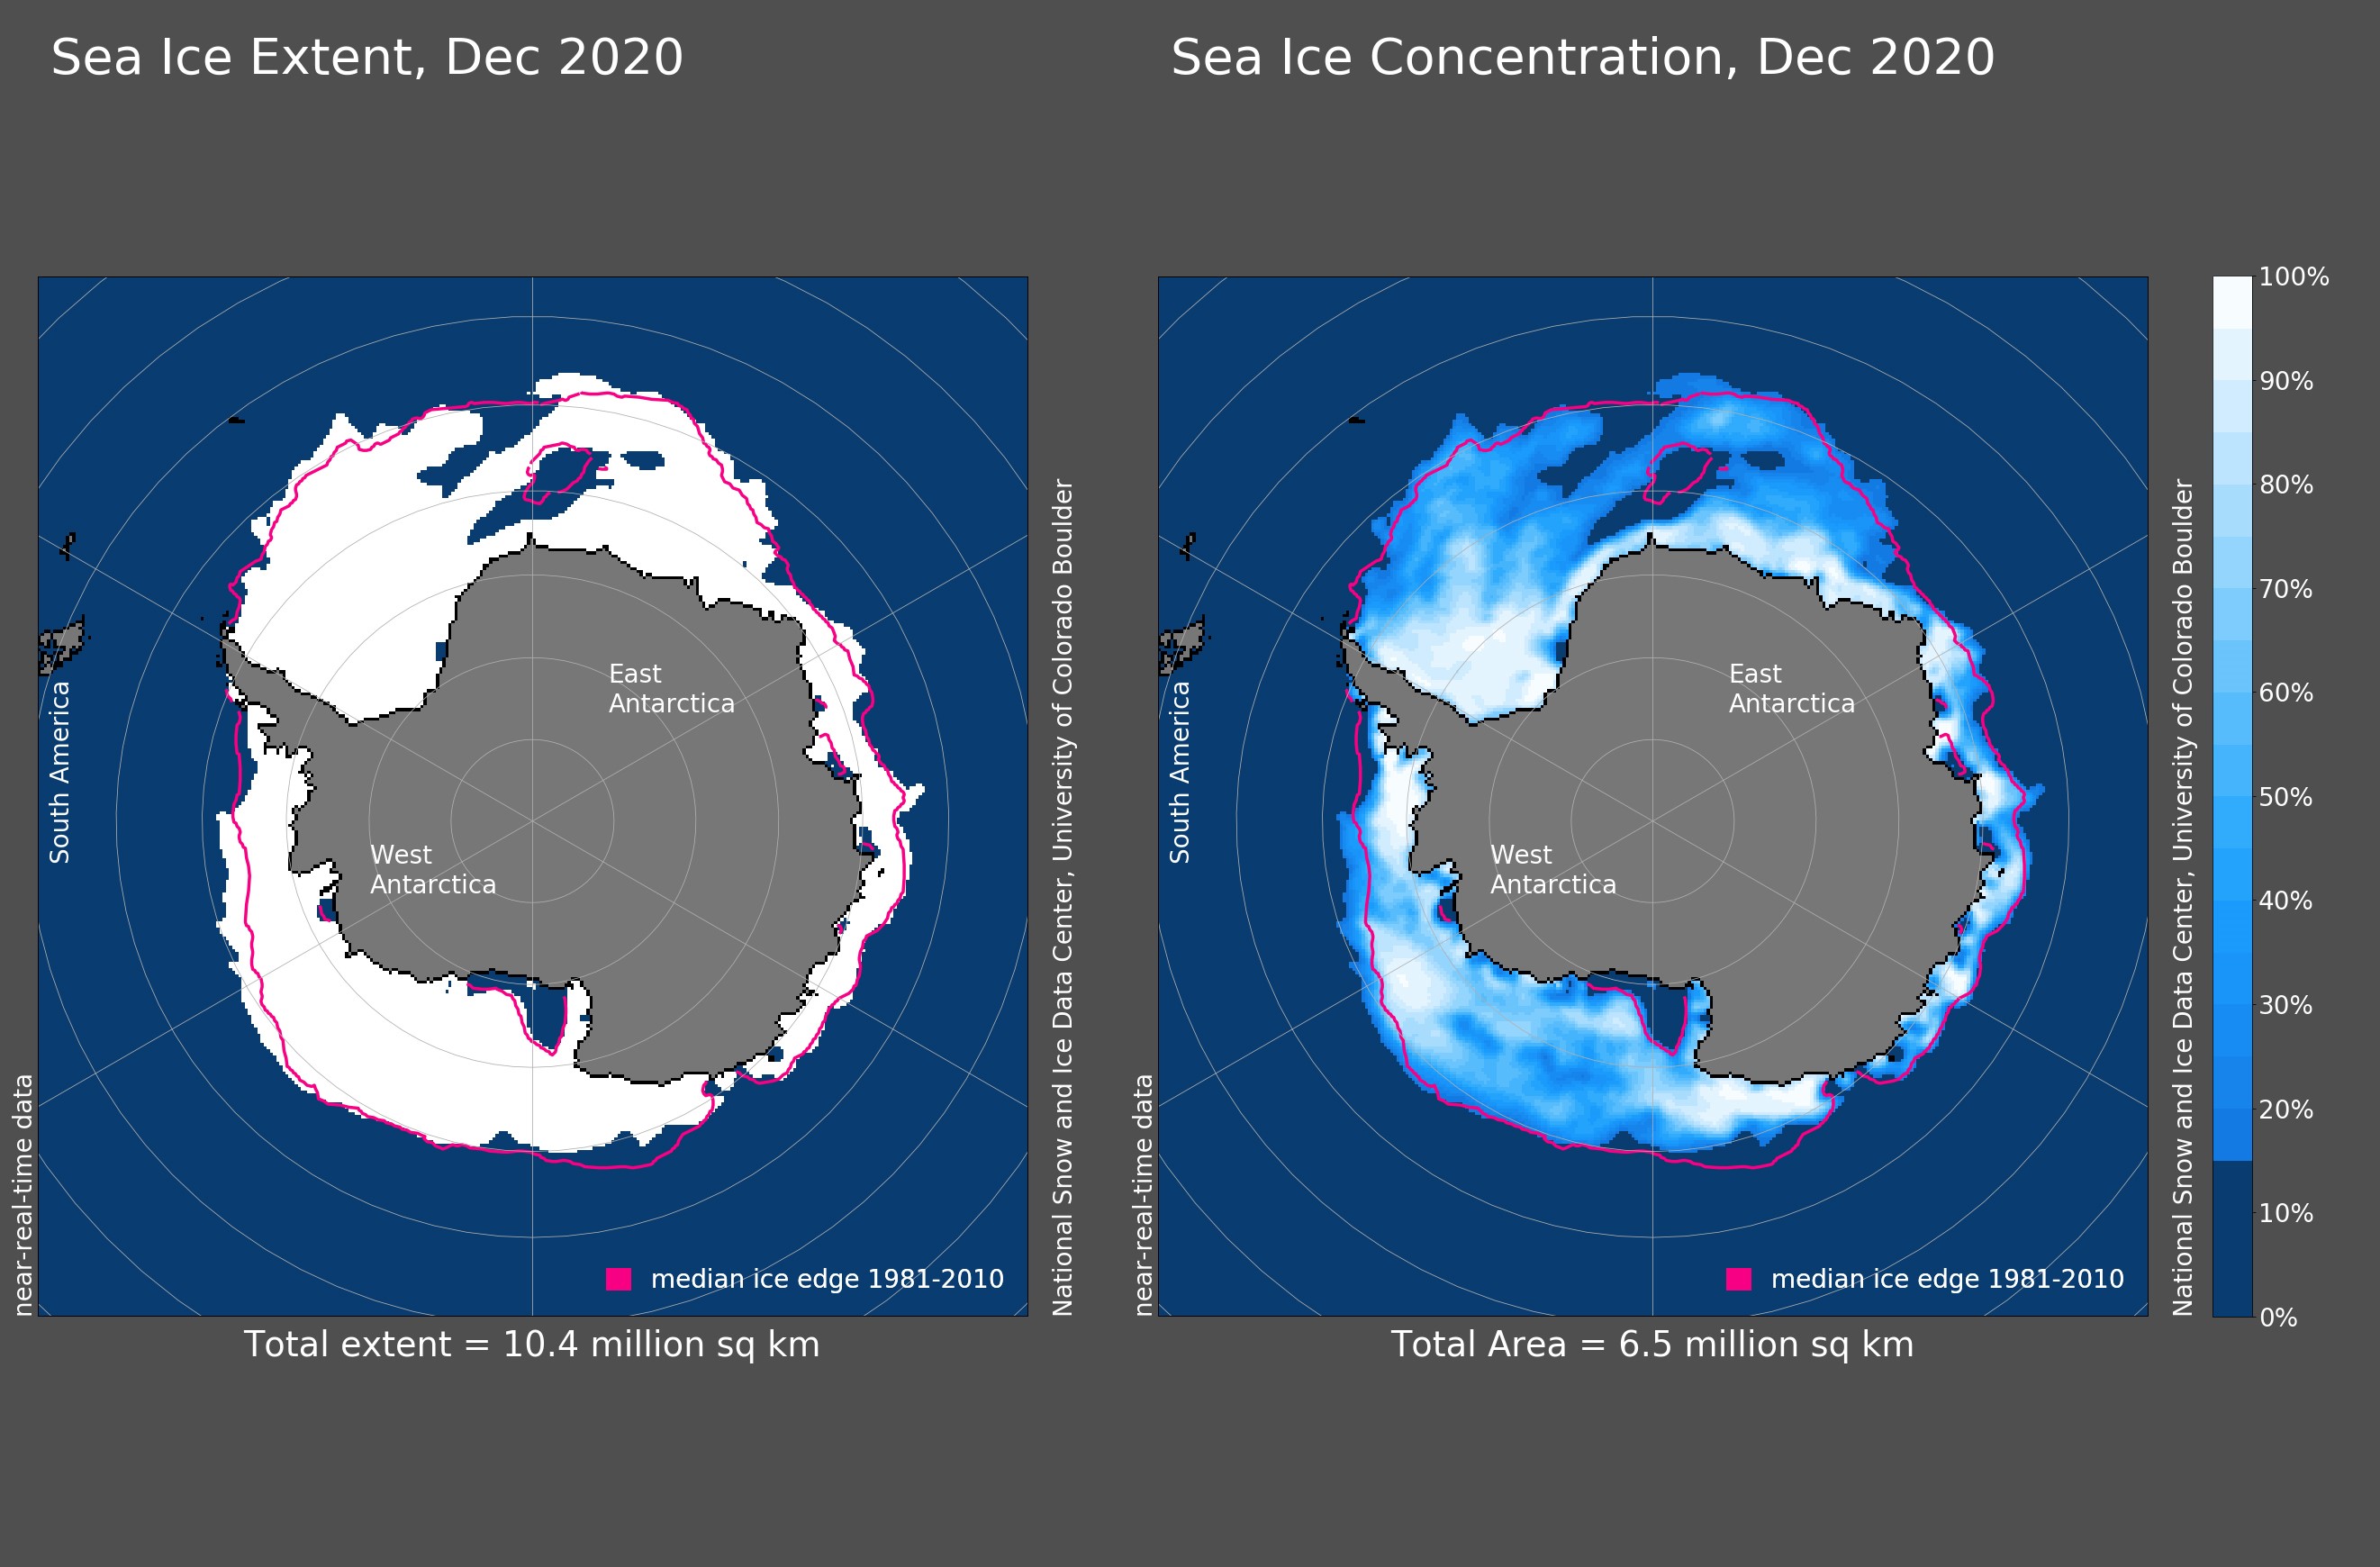
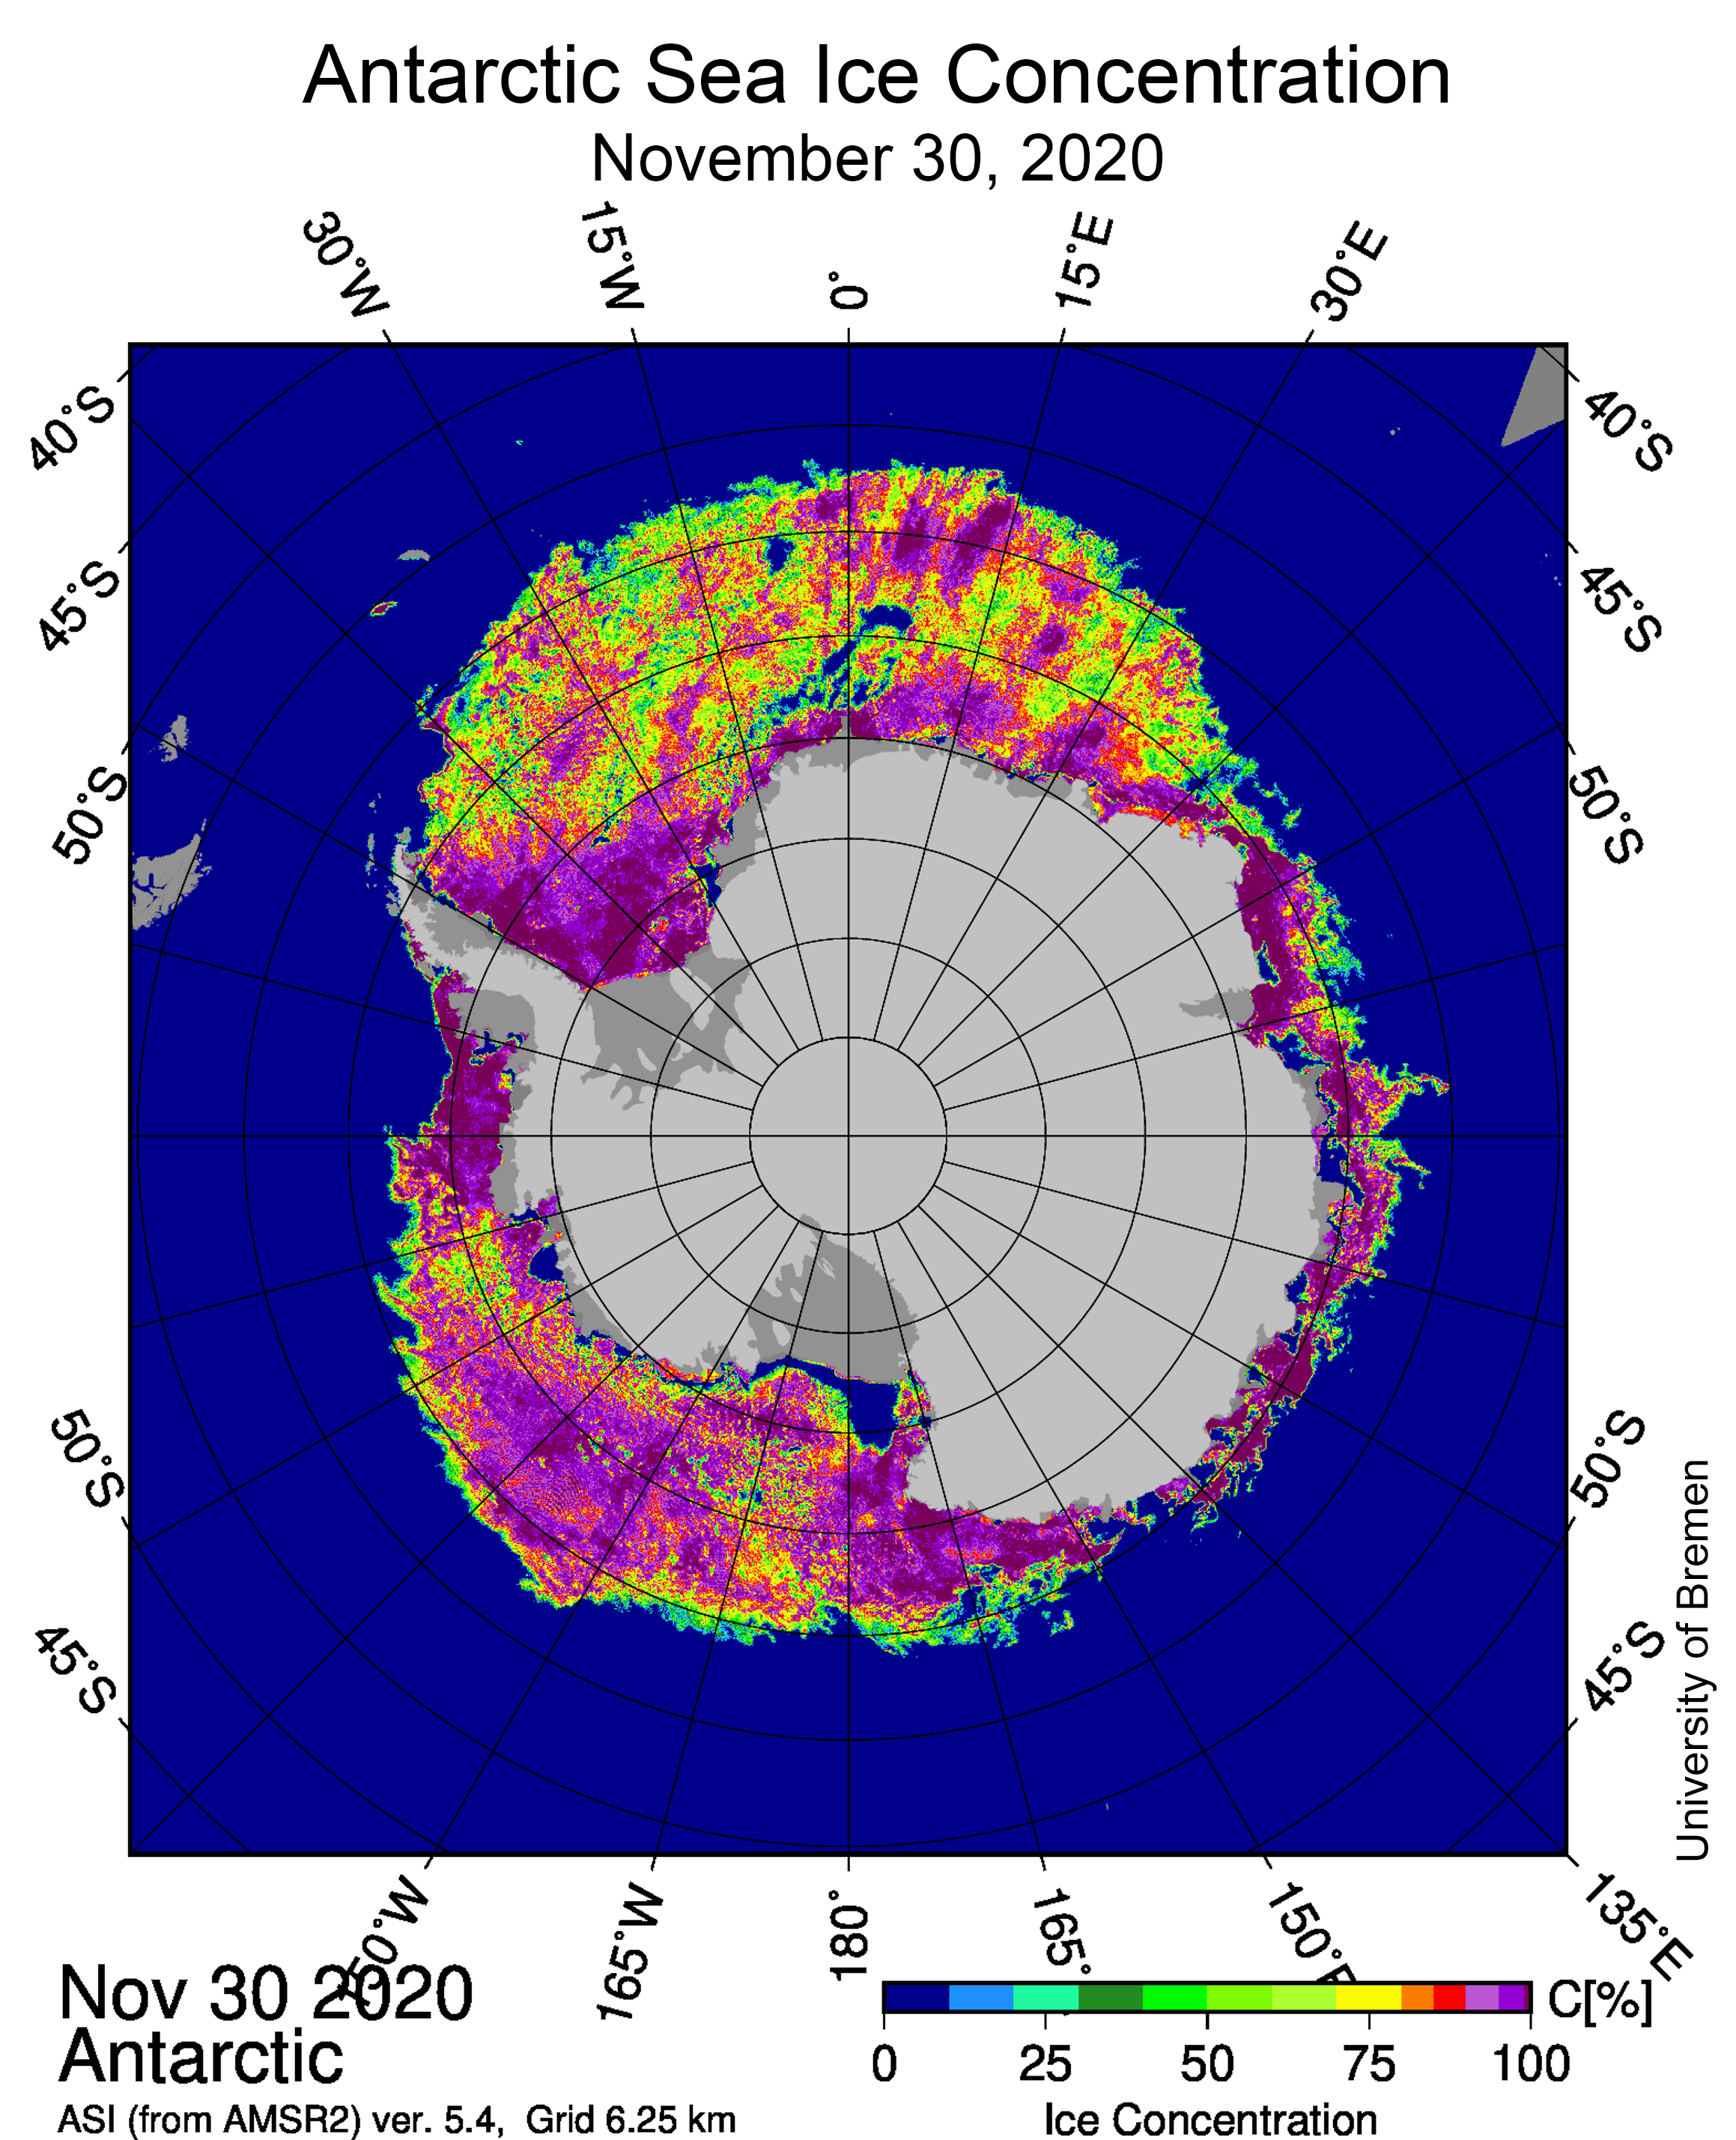
Antarctica maximum may have been reached

Antarctic sea ice extent map for September 2020

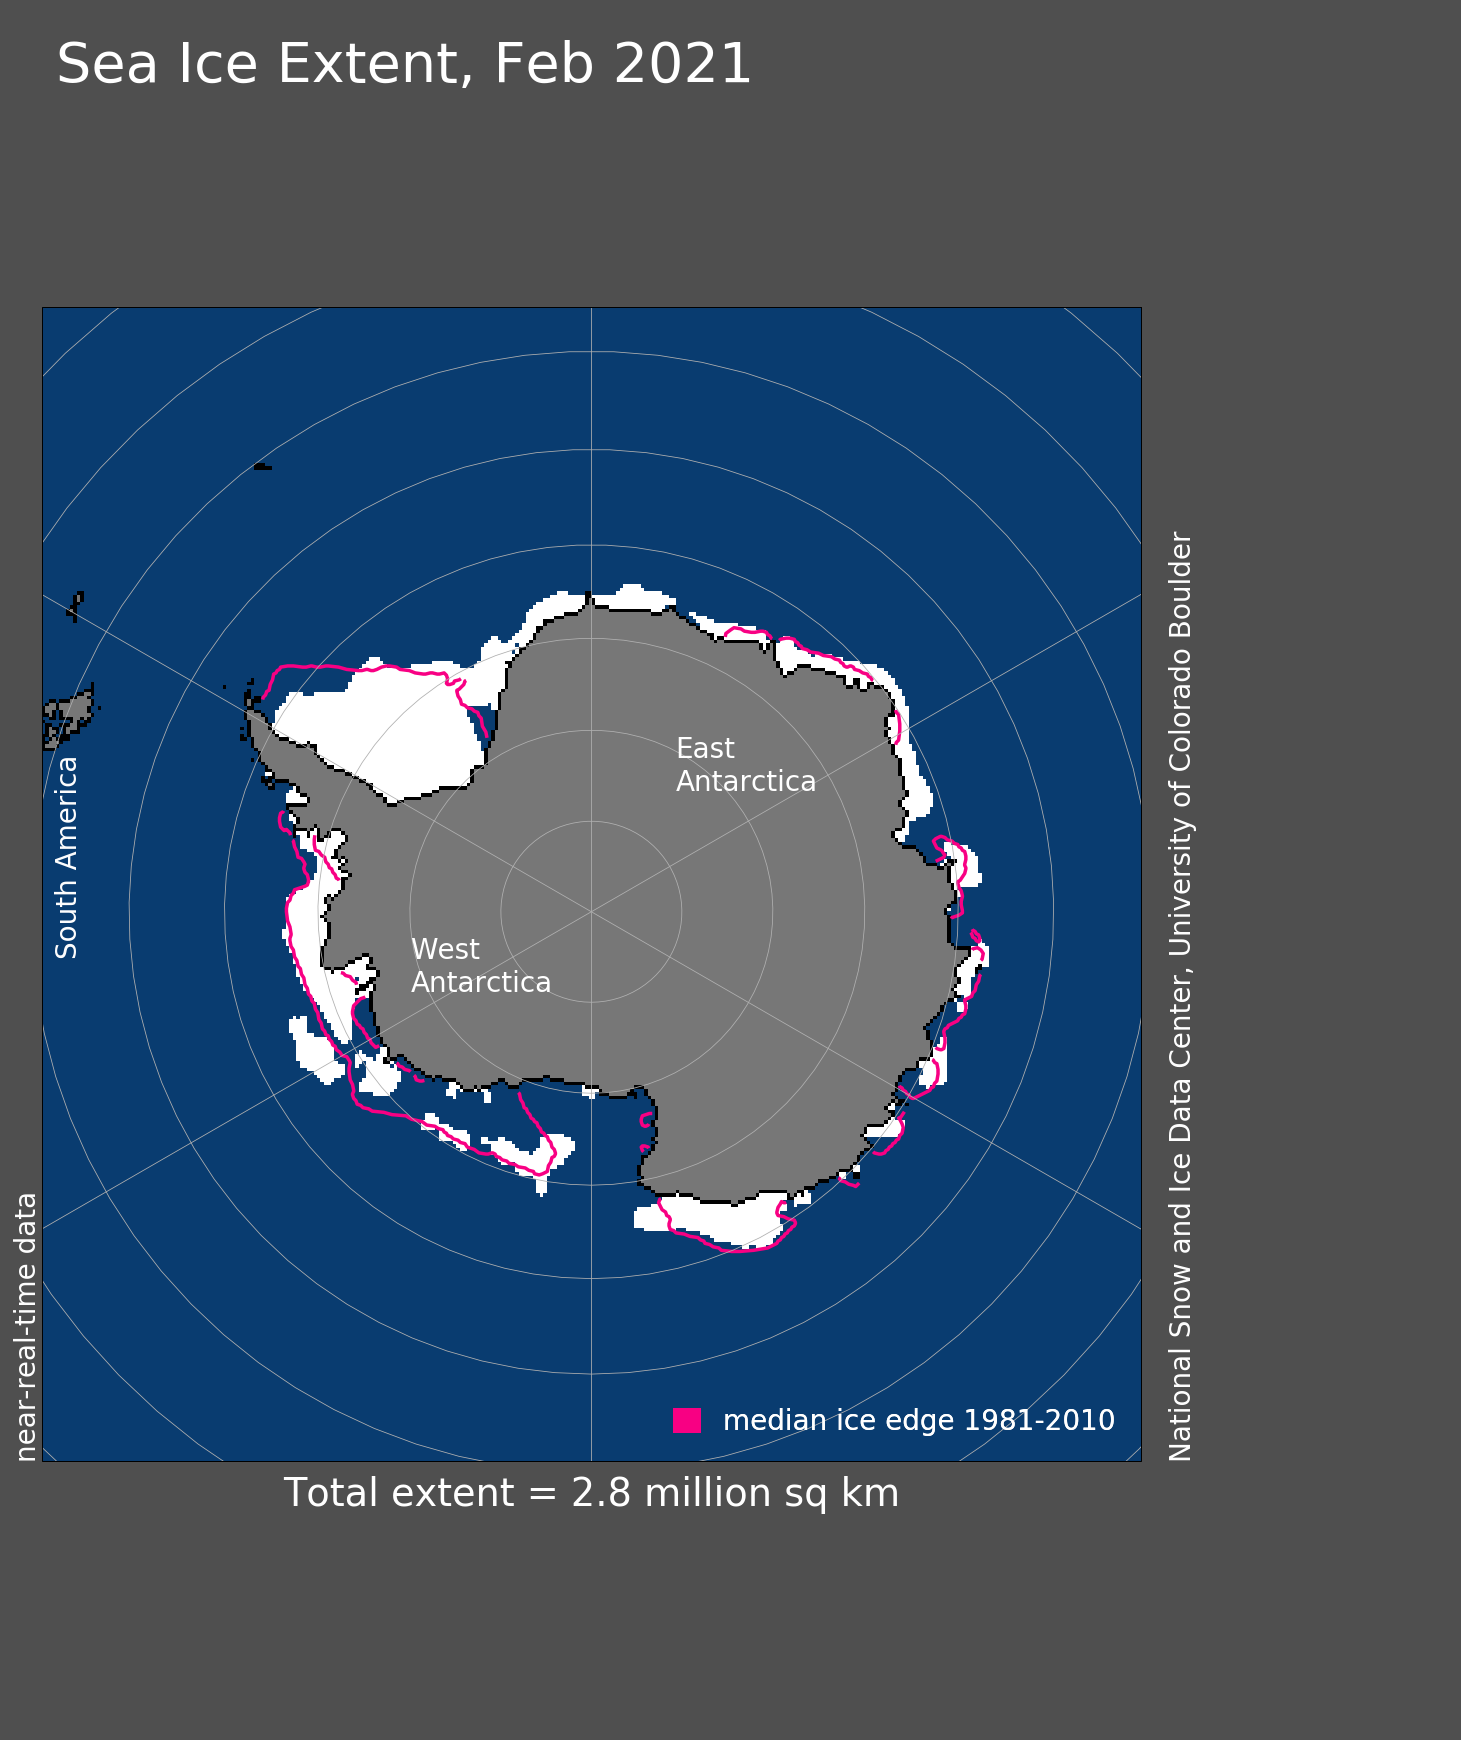
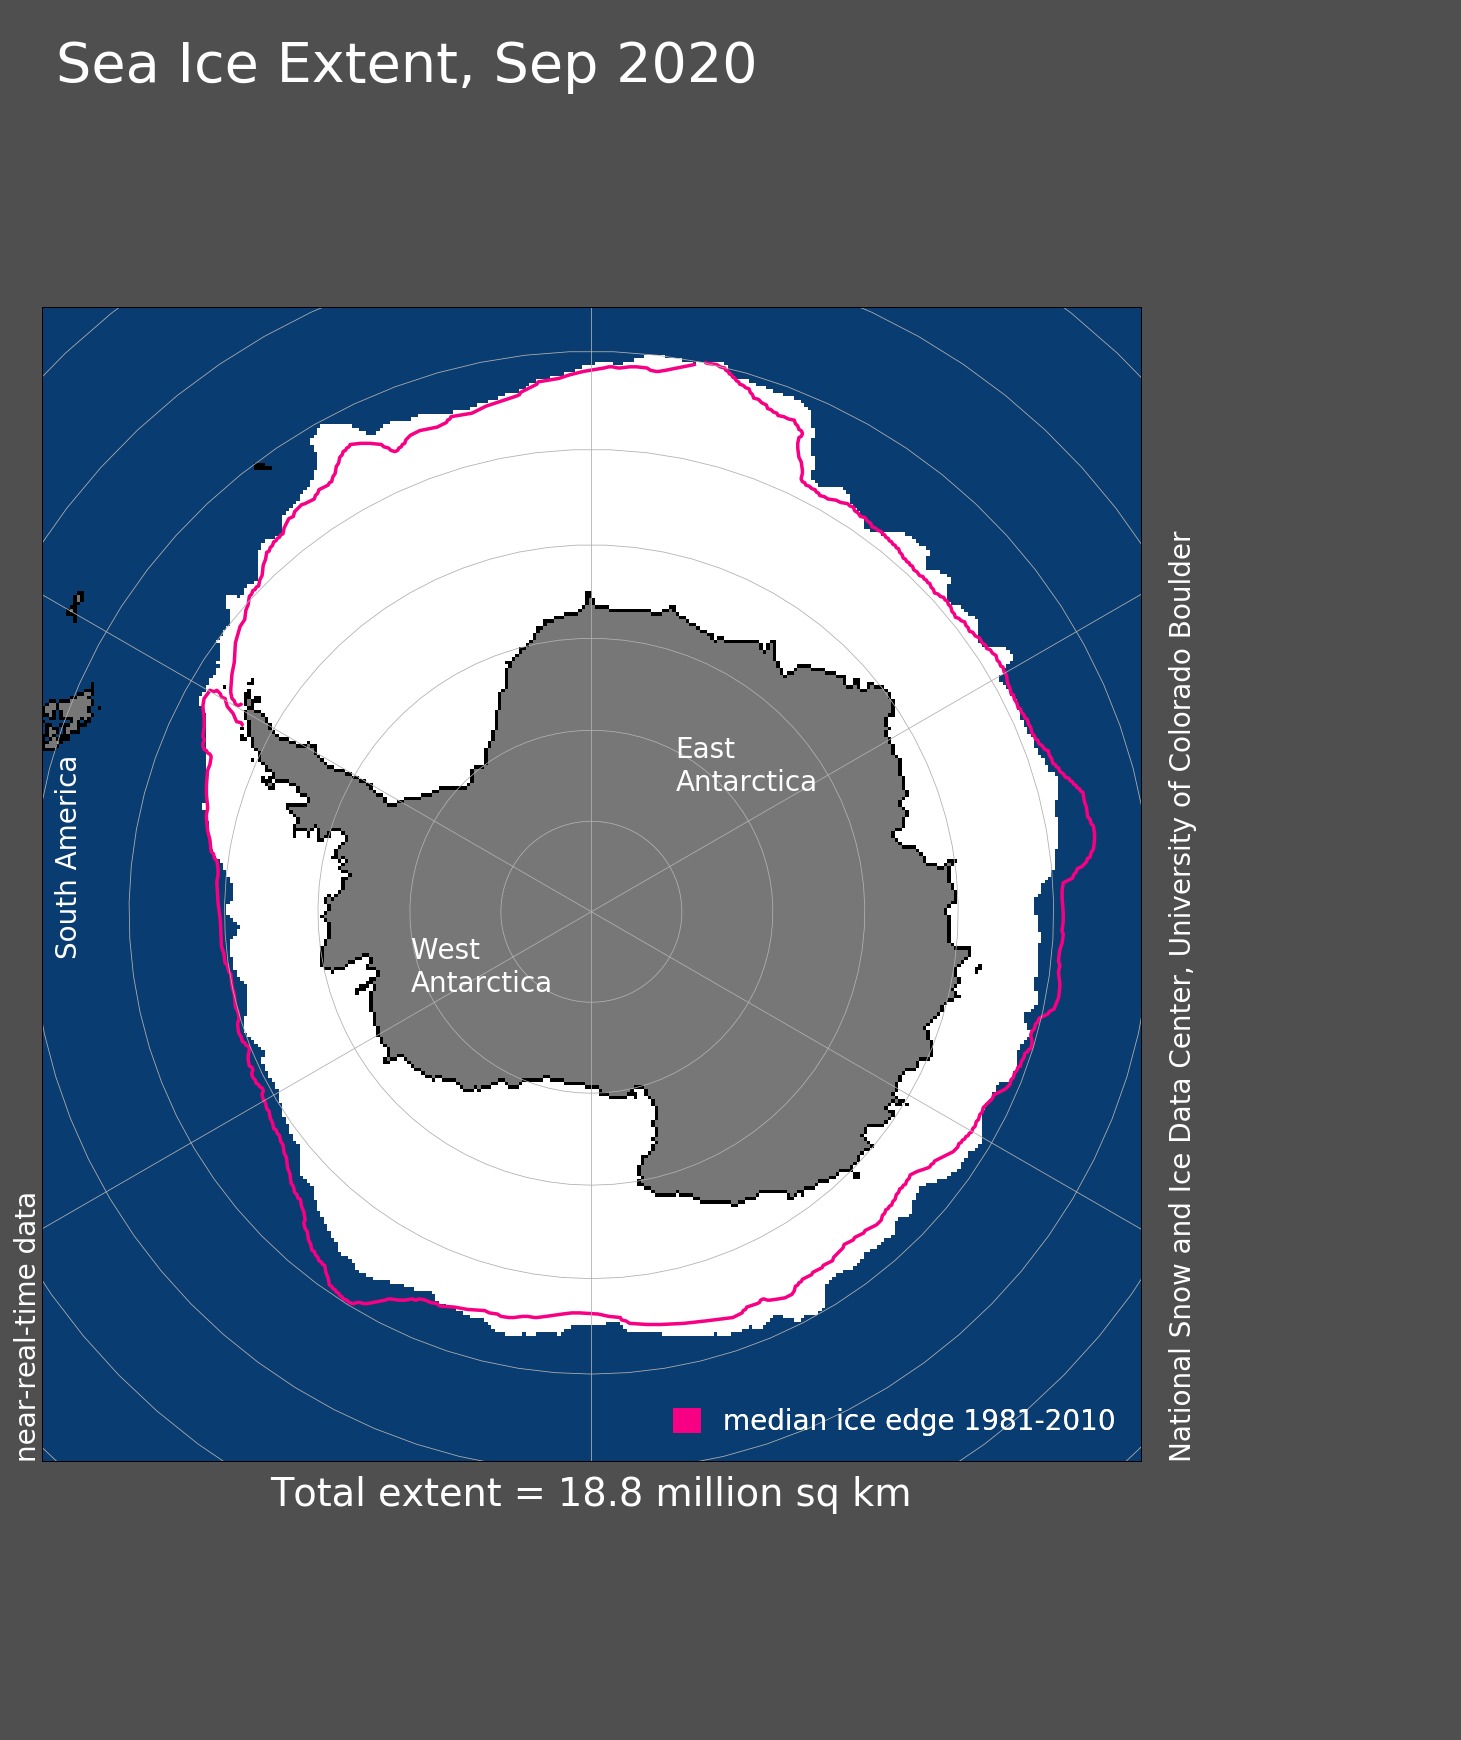
Figure 7. Arctic sea ice extent for September 2020 was 18.77 million square kilometers (7.25 million square miles). The magenta line shows the 1981 to 2010 average extent for that month. Sea Ice Index data. About the data

Credit: National Snow and Ice Data Center
High-resolution image

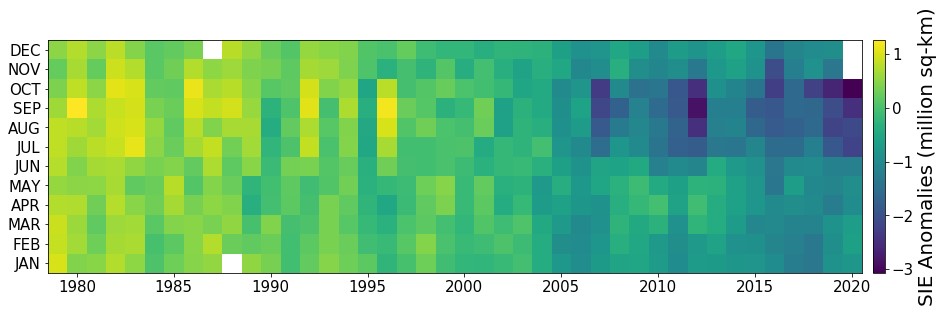
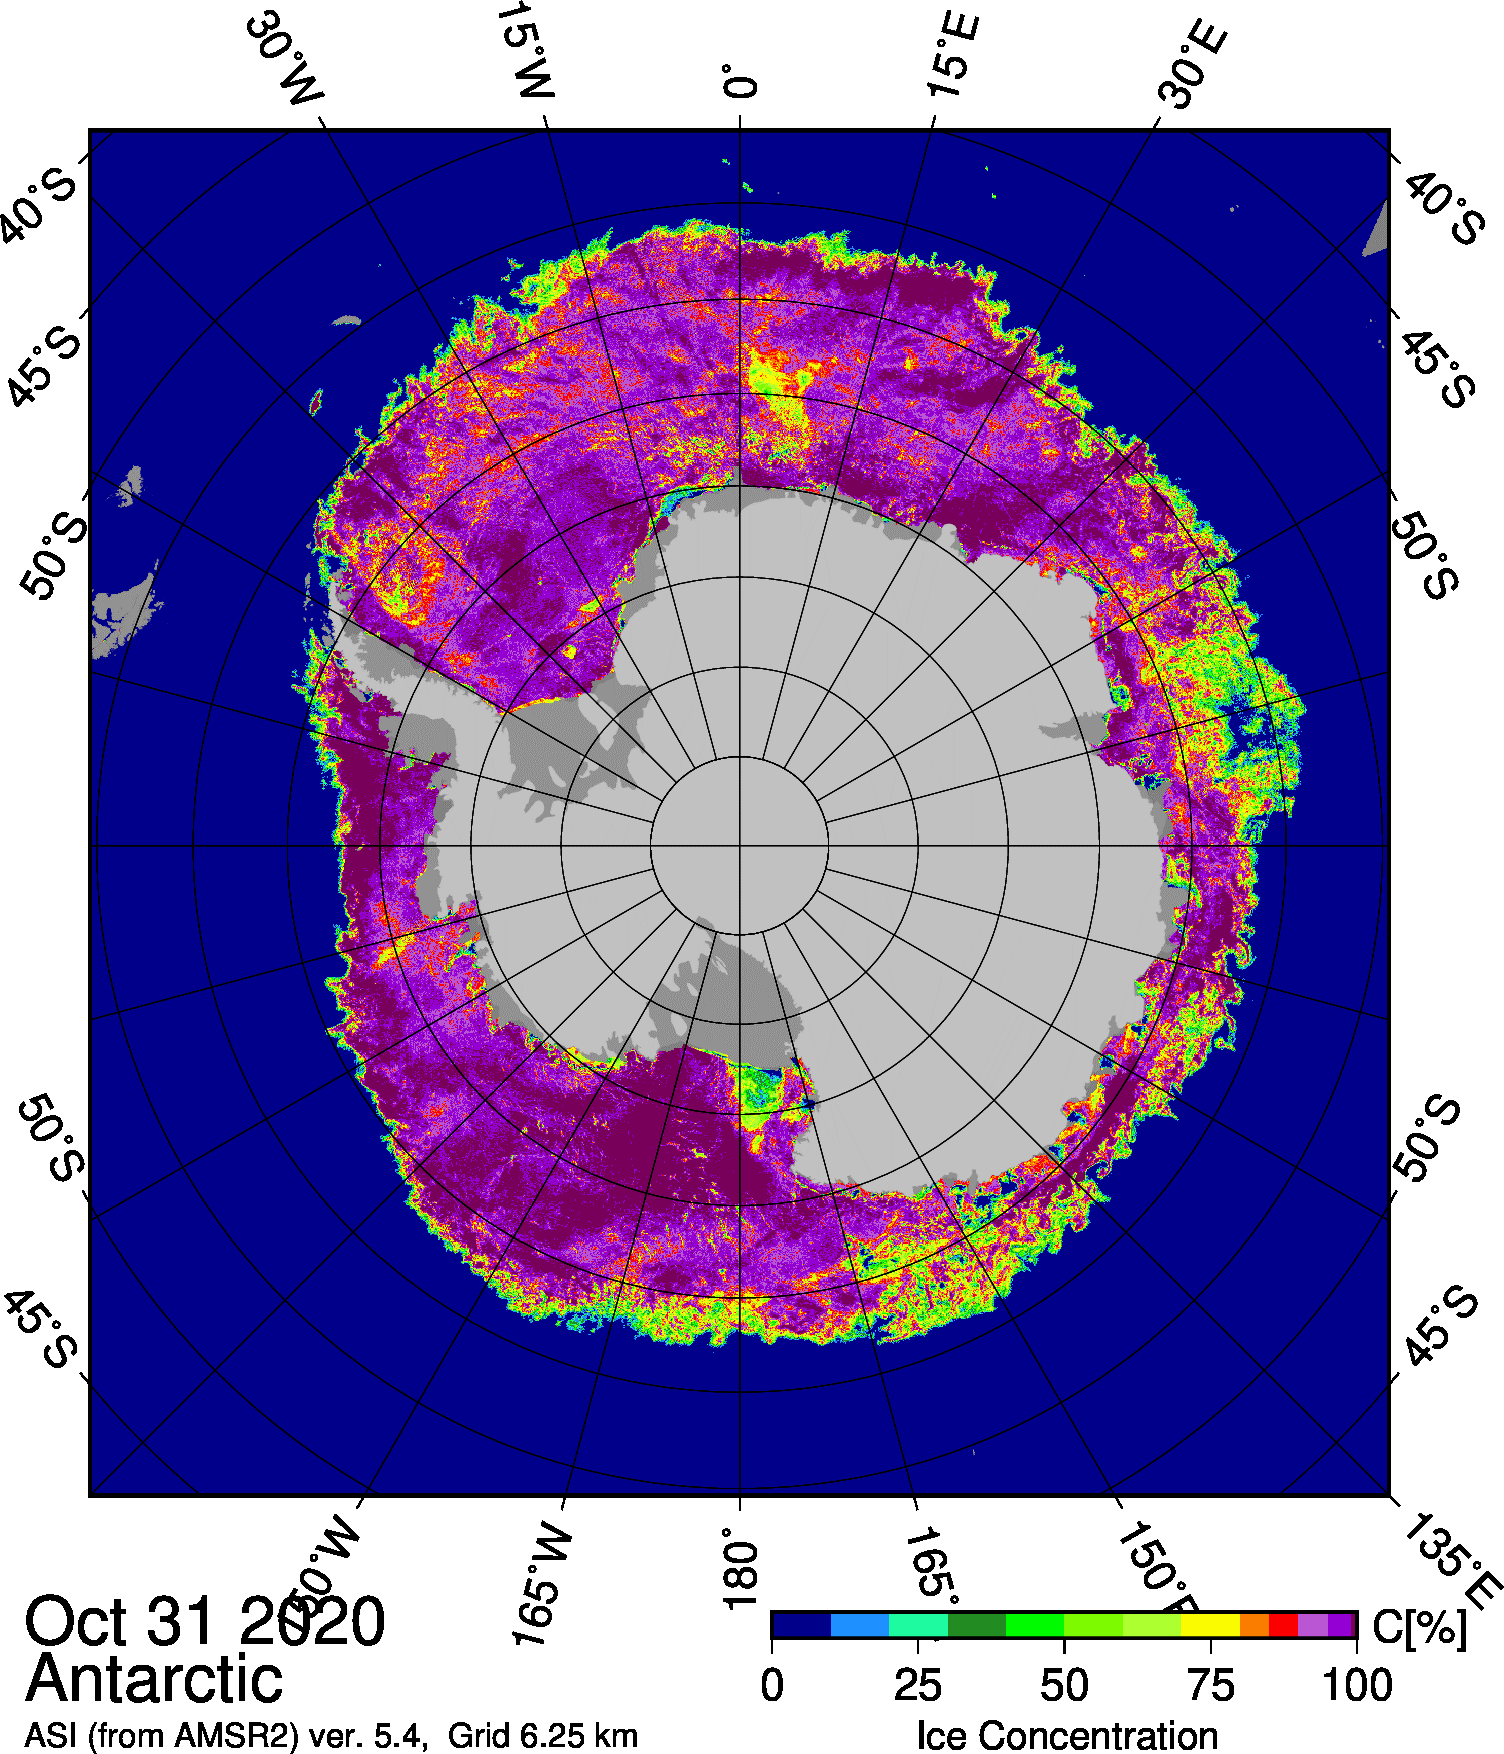
Antarctic sea ice extent may have reached its maximum of 18.95 million square kilometers (7.32 million square miles) on September 28, but the extent could still expand in the coming days. As is typical this time of year, there are wide swings caused by winds and storms along the extensive ice edge. Ice extent is now well above the 1981 to 2020 median extent. This follows a remarkable transition from generally below median extent beginning in August 2016 to well above median extent just in the seven weeks preceding October 1, 2020. Ice extent is above the median extent along a broad area off the Wilkes Land coast and western Ross Sea, near the median extent from the Amundsen Sea clockwise to the Weddell Sea and above the median north of Dronning Maud Land, Enderby Land, and the Cosmonaut Sea. The only major area of below the median extent is in the Indian Ocean sector near the Amery Ice Shelf and eastward.

References

Morison, J. 2020. Workshop on observing, modeling, and understanding the circulation of the Arctic Ocean and Sub-Arctic Seas. Retrieved here.

Moore, G. W. K., Schweiger, A., Zhang, J., and M. Steele. 2019. Spatiotemporal variability of sea ice in the arctic’s last ice area. Geophysical Research Letters, 46, 11237– 11243. doi:10.1029/2019GL083722.

Polyakov, I. V., Pnyushkov, A. V., Alkire, M. B., Ashik, I. M., Baumann, T. M., Carmack, E. C., et al. 2017. Greater role for Atlantic inflows on sea-ice loss in the Eurasian Basin of the Arctic Ocean. Science, 356 (6335), 285. doi:10.1126/science.aai8204.

Rigor, I. G., Wallace, J. M., and R. L. Colony. 2002. Response of sea ice to the Arctic oscillation. Journal of Climate, 15(18), 2648-2663. doi:10.1175/1520-0442.

Steele, M., and T. Boyd. 1998. Retreat of the cold halocline layer in the Arctic Ocean. Journal of Geophysical Research Oceans, 103(C5), 10419-10435. doi:10.1029/98JC00580.

Steele, M., Zhang, J., and W. Ermold. 2010. Mechanisms of summertime upper Arctic Ocean warming and the effect on sea ice melt, Journal of Geophysical Research, 115, C11004. doi:10.1029/2009JC005849.

Steele, M., and S. Dickinson. 2016. The phenology of Arctic Ocean surface warming, Journal of Geophysical Research Oceans, 121, 6847– 6861. doi:10.1002/2016JC012089.


Arctic sea ice decline stalls out at second lowest minimum

On September 15, Arctic sea ice likely reached its annual minimum extent of 3.74 million square kilometers (1.44 million square miles). The minimum ice extent is the second lowest in the 42-year-old satellite record, reinforcing the long-term downward trend in Arctic ice extent. Sea ice extent will now begin its seasonal increase through autumn and winter. In the Antarctic, sea ice extent is now well above average and within the range of the ten largest ice extents on record, underscoring its high year-to-year variability. The annual maximum for Antarctic sea ice typically occurs in late September or early October.

Please note that this is a preliminary announcement. Changing winds or late-season melt could still reduce the Arctic ice extent, as happened in 2005 and 2010. NSIDC scientists will release a full analysis of the Arctic melt season, and discuss the Antarctic winter sea ice growth, in early October.

Overview of conditions

Figure 1. Arctic sea ice extent for September 15, 2020

Figure 1a. Arctic sea ice extent for September 15, 2020 was 3.74 million square kilometers (1.44 million square miles). The orange line shows the 1981 to 2010 average extent for that day. Sea Ice Index data. About the data

Credit: National Snow and Ice Data Center
High-resolution image

Figure 1b. The map above compares the 2012 Arctic sea ice minimum, reached on September 17, with the 2020 Arctic sea ice minimum, reached on September 15. Light blue shading indicates the region where ice occurred in both 2012 and 2020, while white and medium blue areas show ice cover unique to 2012 and to 2020, respectively. Sea Ice Index data. About the data||Credit: National Snow and Ice Data Center|High-resolution image

Figure 1b. The map above compares the 2012 Arctic sea ice minimum, reached on September 17, with the 2020 Arctic sea ice minimum, reached on September 15. Light blue shading indicates the region where ice occurred in both 2012 and 2020, while white and medium blue areas show ice cover unique to 2012 and to 2020, respectively. Sea Ice Index data. About the data

Credit: National Snow and Ice Data Center
High-resolution image

A sharp decline of Arctic sea ice at the beginning of September dropped the extent below 4.0 million square kilometers (1.54 million square miles) for only the second time since the beginning of the satellite record in 1979. After September 8, daily melt began leveling out, reaching its seasonal minimum extent of 3.74 million square kilometers (1.44 million square miles) on September 15 (Figure 1a). This appears to be the lowest extent of the year. In response to the setting sun and falling temperatures, ice extent will begin increasing through autumn and winter. However, a shift in wind patterns or a period of late season melt could still push the ice extent lower.

Compared to 2012, the minimum extent this year has more ice in the Beaufort Sea, but somewhat less ice in the Laptev and East Greenland Sea regions (Figure 1b). The minimum extent was reached one day later than the 1981 to 2010 median minimum date of September 14. The interquartile range of minimum dates is September 11 to September 19.

The 14 lowest extents in the satellite era have all occurred in the last 14 years.

Conditions in context

Figure 2a. The graph above shows Arctic sea ice extent on September 18, 2019, along with 2007 and 2016—the years tied for second lowest minimum—and the record minimum for 2012. 2019 is shown in blue, 2016 in light brown, 2012 in dotted pink, and 2007 in dark brown. The 1981 to 2010 median is in dark gray. The gray areas around the median line show the interquartile and interdecile ranges of the data. Sea Ice Index data.||Credit: National Snow and Ice Data Center|High-resolution image

Figure 2a. The graph above shows Arctic sea ice extent on September 15, 2020, along with several other recent years and the record minimum set in 2012. 2019 is shown in green, 2018 in orange, 2017 in brown, 2016 in magenta, and 2012 in dashed brown. The 1981 to 2010 median is in dark gray. The gray areas around the median line show the interquartile and interdecile ranges of the data. Sea Ice Index data.

Credit: National Snow and Ice Data Center
High-resolution image

14 year trends for Arctic sea ice loss

Figure 2b. This graph shows linear trends of Arctic sea ice extent for three 14-year periods for the day of the annual minimum. Trend percent values are relative to the 1981 to 2010 average minimum extent. On the right, the average (square) and range of highest and lowest extents at the minimum for each period are given.

Credit: W. Meier, NSIDC
High-resolution image

This year’s minimum set on September 15 was 350,000 square kilometers (135,000 square miles) above the record minimum extent in the satellite era, which occurred on September 17, 2012 (Figure 2a). It is also 2.51 million square kilometers (969,000 square miles) below the 1981 to 2010 average minimum extent, which is equivalent in size to roughly the states of Alaska, Texas, and Montana combined, or Greenland and Finland combined.

The 42-minimum-extent values in the satellite record can be broken down into three 14-year periods. Most notably, minimum extents in the last 14 years of the time series are the lowest 14 in the 42-year record (Figure 2b). All three periods show a downward trend. The middle period, 1993 to 2006, shows the steepest downward trend of 13.3 percent per decade, relative to the 1981 to 2010 average. The earliest period, 1979 to 1992, has a downward trend of 6.4 percent per decade, while the most recent period of low extents, 2007 to 2020, has a downward trend of 4.0 percent per decade.

The overall, downward trend in the minimum extent from 1979 to 2020 is 13.4 percent per decade relative to the 1981 to 2010 average.

Fourteen lowest minimum Arctic sea ice extents (satellite record, 1979 to present)

Table 1. Fourteen lowest minimum Arctic sea ice extents (satellite record, 1979 to present)
RANK YEAR MINIMUM ICE EXTENT DATE
IN MILLIONS OF SQUARE KILOMETERS IN MILLIONS OF SQUARE MILES
1 2012 3.39 1.31 Sept. 17
2 2020 3.74 1.44 Sept. 15
3 2007
2016
2019
4.16
4.17
4.19
1.61
1.61
1.62
Sept. 18
Sept. 18
Sept. 10
6 2011 4.34 1.68 Sept. 11
7 2015 4.43 1.71 Sept. 9
8 2008
2010
4.59
4.62
1.77
1.78
Sept. 19
Sept. 21
10 2018
2017
4.66
4.67
1.80
1.80
Sept. 23
Sept. 13
12 2014
2013
5.03
5.05
1.94
1.95
Sept. 17
Sept. 13
14 2009 5.12 1.98 Sept. 13

Values within 40,000 square kilometers (15,000 square miles) are considered tied. The 2019 value has changed from 4.15 to 4.19 million square kilometers (1.62 million square miles) when final analysis data updated from near-real-time data.

Suddenly in second place

In the first week of September, sea ice extent took a sharp downward turn, exceeding the pace of decline for any previous year during that period, and placing the 2020 sea ice minimum firmly as second lowest—after 2012—in the 42-year continuous satellite record. Pulses of warm air from north-central Siberia are responsible for the late downward trend. Sea ice decline has slowed in the past few days, and the annual minimum is imminent.

Overview of conditions

Figure 1a. Arctic sea ice extent for September 15, 2020 was X.XX million square kilometers (X.XX million square miles). The orange line shows the 1981 to 2010 average extent for that day. Sea Ice Index data. About the data||Credit: National Snow and Ice Data Center|High-resolution image

Figure 1a. Arctic sea ice extent for September 15, 2020 was 3.74 million square kilometers (1.44 million square miles). The orange line shows the 1981 to 2010 average extent for that day. Sea Ice Index data. About the data

Credit: National Snow and Ice Data Center
High-resolution image

Figure 1b. This figure shows daily Arctic sea ice extent as of September X, 2020, as well as the 1981 to 2010 median and 2007, 2012, 2016, 2019, and 2020.||Credit: National Snow and Ice Data Center|High-resolution image

Figure 1b. The graph above shows Arctic sea ice extent as of September 15, 2020, along with daily extent data for several low sea ice extent years and the record low year. 2020 is shown in blue, 2019 in dark green, 2018 in purple, 2007 in light green, and 2012 in dashed red. The 1981 to 2010 median is in dark gray. The gray areas around the median line show the interquartile and interdecile ranges of the data. Sea Ice Index Data

Credit: National Snow and Ice Data Center
High-resolution image

Figure 1c. This figure shows the Japanese Aerospace Exploration Agency (JAXA) Advanced Microwave Scanning Radiometer 2 (AMSR2) sea ice concentration for Arctic sea ice on September 12, 2020. ||Credit: University of Bremen|High-resolution image

Figure 1c. This map shows sea ice concentration for Arctic sea ice on September 12, 2020, using data collected from the Japanese Aerospace Exploration Agency (JAXA) Advanced Microwave Scanning Radiometer 2 (AMSR2).

Credit: University of Bremen
High-resolution image

Figure 1d. This figure compares Arctic sea ice extent on September 1, 2020 (in white), and September 14, 2020 (in blue), showing recent areas of retreat. ||Credit: National Snow and Ice Data Center|High-resolution image

Figure 1d. This figure compares Arctic sea ice extent on September 1, 2020 (in white), and September 14, 2020 (in blue), showing recent areas of retreat.

Credit: National Snow and Ice Data Center
High-resolution image

Sea ice extent stood at 3.74 million square kilometers (1.44 million square miles) on September 15, already well below 2007, 2016, and 2019 and within 400,000 square kilometers (154,400 square miles) of the record low extent set in 2012 (Figure 1a). Sea ice extent has dropped below 4 million square kilometers (1.54 million square miles) only once before, in 2012 (Figure 1b). Between August 31 and September 5, 2020, sea ice extent decreased by an average of 79,800 square kilometers (30,800 square miles) per day. This is a greater loss rate than any other year for these six days in the sea ice record. Ice retreat during this period was along the ice front in the northern Barents, Kara, and Laptev seas. A remaining tail of multiyear ice extends into the southern Beaufort Sea north of the Mackenzie River Delta and the Alaskan North Slope. North of Scandinavia and Russia, a very broad sea-ice-free area exists with the ice edge lying near 85 degrees N, far to the north of Svalbard, Franz Josef Land, and Severnaya Zemlya (Northern Land) (Figure 1c). The sharply defined ice edge in this area, between about 0 degrees and 100 degrees longitude, indicates strong compaction of the ice by winds coming from the south and is the furthest north the ice edge has been in this location over the satellite data record (Figure 1d).

Conditions in context

Figure 2a. This plot shows the departure from average air temperature in the Arctic at the 925 hPa level, in degrees Celsius, from September 1 to 14, 2020. Yellows and reds indicate higher than average temperatures; blues and purples indicate lower than average temperatures. ||Credit: NSIDC courtesy NOAA Earth System Research Laboratory Physical Sciences Division|High-resolution image

Figure 2a. This plot shows the departure from average air temperature in the Arctic at the 925 hPa level, in degrees Celsius, from September 1 to 14, 2020. Yellows and reds indicate higher than average temperatures; blues and purples indicate lower than average temperatures.

Credit: NSIDC courtesy NOAA Earth System Research Laboratory Physical Sciences Division
High-resolution image

Figure 2b. This plot shows average sea level pressure in the Arctic in millibars (hPa) from September 1 to 14, 2020. Yellows and reds indicate high air pressure; blues and purples indicate low pressure. ||Credit: NSIDC courtesy NOAA Earth System Research Laboratory Physical Sciences Division|High-resolution image

Figure 2b. This plot shows average sea level pressure in the Arctic in millibars (hPa) from September 1 to 14, 2020. Yellows and reds indicate high air pressure; blues and purples indicate low pressure.

Credit: NSIDC courtesy NOAA Earth System Research Laboratory Physical Sciences Division
High-resolution image

As assessed over the first two weeks of September, air temperatures at the 925 mb level (about 2,500 feet above sea level) were above average over much of the Eurasian side of the Arctic Ocean. Air temperatures were up to 6 degrees Celsius (11 degrees Fahrenheit) above the 1981 to 2010 average near the Taymyr Peninsula of north-central Siberia. Temperatures were 1 to 2 degrees Celsius (2 to 4 degrees Fahrenheit) below average in easternmost Siberia and western Alaska, 4 degrees Celsius (7 degrees Fahrenheit) below average in central Canada, and 5 degrees Celsius (9 degrees Fahrenheit) below average in northern Greenland (Figure 2a). The atmospheric circulation over the first two weeks of the month was characterized by generally high pressure in eastern Siberia and low pressure over the Atlantic side of the Arctic, driving winds from the south over much of the Eurasian side of the Arctic Ocean (Figure 2b). The Arctic Oscillation index has cycled between slightly negative and moderately positive values. Pulses of warm air have been observed to migrate across the Arctic Ocean and then break down over a scale of several days.

Late summer sea ice drift and sea surface temperature

Figure 3a. This figure shows sea ice motion determined from National Snow and Ice Data Center EASE-Grid passive microwave data from August 26, 2020, to September 1, 2020.||Credit: National Snow and Ice Data Center|High-resolution image

Figure 3a. This figure shows sea ice motion determined from National Snow and Ice Data Center EASE-Grid passive microwave data from August 26 to September 1, 2020.

Credit: National Snow and Ice Data Center
High-resolution image

Figure 3b. This map shows sea surface temperature and ice concentration for September 13, 2020. The locations of three Upper layer Temperature of the Polar Oceans (UpTempO) drifting buoys are marked as 1, 2, and 7. Sea surface temperature data are from the National Oceanic and Atmospheric Administration daily Optimum Interpolation Sea Surface Temperature (OISST), and ice concentration from the NSIDC Sea Ice Index. Download data from UptempO drifting buoy locations. ||Credit: University of Washington|High-resolution image

Figure 3b. This map shows sea surface temperature (SST) in degrees Celsius and ice concentration for September 13, 2020. SST data are from the University of Washington Polar Science Center Upper layer Temperature of the Polar Oceans (UptempO) buoys and satellite-derived values from the National Oceanic and Atmospheric Administration (NOAA), and ice concentration is from the NSIDC Sea Ice Index.

Credit: University of Washington
High-resolution image

Ice motion in late August drifted northward along the Eurasian side of the Arctic Ocean, while the multiyear sea ice region north of western Canada and Alaska drifted rapidly westward toward the Chukchi Sea (Figure 3a). Ice motion was determined by tracking patterns in the sea ice using passive microwave and other data. Both the motion and the compaction of the loose sea ice pack are responsible for the strong decline in ice extent seen in this period and the following week. Warm waters in the Chukchi Sea may induce some late melting of the multiyear ice from the heat in the ocean, but much of the water in the region is already near freezing from more recent ice loss (Figure 3b).

Sailing across the top of the world in a “new Arctic” soon

Figure 4. This map shows the potential transpolar shipping route discussed in Bennett et al., 2020. The orange line shows the approximate September 2020 ice edge overlaid on the September 2019 Arctic sea ice extent. ||Credit: Bennett et al., 2020|High-resolution image

Figure 4. This map shows the potential transpolar shipping route discussed in Bennett et al., 2020. The orange line shows the approximate September 2020 ice edge overlaid on the September 2019 Arctic sea ice extent.

Credit: Bennett et al., 2020
High-resolution image

A recent paper by an international group led by political geographer Mia Bennett at the University of Hong Kong discusses the potential impacts of the near-future emergence of a transpolar shipping route as sea ice retreat continues to open a very wide shipping lane along the Eurasian side of the Arctic Ocean (as it has this year). The route would pass over the North Pole as a way of avoiding an extensive Russian exclusive economic zone (EEZ) and still-contended continental shelf claim.

This emerging transpolar route reflects a fundamentally changed Arctic environment. Another recent paper by researchers Laura Landrum and Marika Holland at the National Center for Atmospheric Research found that the Arctic has indeed entered into a “new Arctic climate” state. This new climate is one characterized by warmer temperatures, more open water, less sea ice, more rain, and less snow. In the Arctic, weather that used to be considered extreme is becoming the norm. The summer of 2020 is clearly representative of this new Arctic.

Further reading

Bennett, M. M. et al. 2020. The opening of the Transpolar Sea Route: Logistical, geopolitical, environmental, and socioeconomic impacts. Marine Policy. doi.10.1016/j.marpol.2020.104178.

Landrum, L., and Holland, M. M. 2020. Extremes become routine in an emerging new Arctic. Nature Climate Change. doi.10.1038/s41558-020-0892-z.

Tapping the brakes

After a period of rapid sea ice loss extending into the last week of August, the rate has slowed with the onset of autumn in the Arctic. A region of low concentration ice persists in the Beaufort Sea. How much of this ice melts over in the next two weeks will strongly determine where the September sea ice minimum will stand in the record books. The Northwest Passage (Amundsen’s route) is largely open but some ice remains. The Northern Sea Route, along the Siberian coast, remains open.

Overview of conditions

Montly extent for August 2020

Figure 1. Arctic sea ice extent for August 2020 was 5.08 million square kilometers (1.96 million square miles). The magenta line shows the 1981 to 2010 average extent for that month. Sea Ice Index data. About the data

Credit: National Snow and Ice Data Center
High-resolution image

August 2020 sea ice extent averaged 5.08 million square kilometers (1.96 million square miles), placing it at third lowest in the satellite record for the month. This was 360,000 square kilometers (139,000 square miles) above the record low set in 2012. As of September 1, Arctic sea ice extent stood at 4.26 million square kilometers (1.64 million square miles), the second lowest extent for that date in the satellite passive microwave record that started in 1979.

In our previous post, we noted the development of substantial openings of the sea ice north of Alaska within the Beaufort and Chukchi Seas, possibly related to the mid-July storm that spread out the ice cover. Since then, further melt has occurred in the area. Some of this ice appears to be multiyear, which tends to be resistant to melting away. Total sea ice extent at the September minimum will depend strongly on how much of the ice in this area melts from the remaining heat in the ocean, and on wind compaction or expansion of the overall ice edge (the line of 15 percent concentration). The Northwest Passage is largely open, but some ice remains. The Northern Sea route remains open.

Conditions in context

Arctic sea ice extent graph

Figure 2a. The graph above shows Arctic sea ice extent as of September 01, 2020, along with daily ice extent data for four previous years and the record low year. 2020 is shown in blue, 2019 in green, 2018 in orange, 2017 in brown, 2016 in purple, and 2012 in dashed brown. The 1981 to 2010 median is in dark gray. The gray areas around the median line show the interquartile and interdecile ranges of the data. Sea Ice Index data.

Credit: National Snow and Ice Data Center
High-resolution image

Average air temperatures in Arctic from August 15 to 31, 2020

Figure 2b. This plot shows the departure from average air temperature in the Arctic at the 925 hPa level, in degrees Celsius, from August 15 to 31, 2020. Yellows and reds indicate higher than average temperatures; blues and purples indicate lower than average temperatures.

Credit: NSIDC courtesy NOAA Earth System Research Laboratory Physical Sciences Division
High-resolution image

Average sea level pressure over Arctic from August 1 to 31, 2020

Figure 2c. This plot shows average sea level pressure in the Arctic in millibars (hPa) from August 15 to 31, 2020. Yellows and reds indicate high air pressure; blues and purples indicate low pressure.

Credit: NSIDC courtesy NOAA Earth System Research Laboratory Physical Sciences Division
High-resolution image

Following a period of slow August ice loss, the pace quickened during the middle of the month as areas of low ice concentration melted away, only to slow again towards the end of the month with the onset of autumn in the Arctic. Overall, from August 15 through September 1, 2020, extent declined by 1.1 million square kilometers (425,000 square miles), more than the average 1981 to 2020 extent loss of 800,000 square kilometers (309,000 square miles) during the same period (Figure 2a).

As assessed from August 15 to August 31, air temperatures at the 925 mb level (about 2,500 feet above sea level) were above average over much of the Arctic Ocean, continuing the basic pattern of warmth that prevailed through the first half of the month, most notably in the Kara Sea. Temperatures were below average over central Siberia (Figure 2b). The atmospheric circulation pattern shifted relative to the first half of the month to feature high pressure centered over the Laptev Sea and extending across the Beaufort and Chukchi Seas (Figure 2c). Low pressure has been the dominant feature of the Norwegian Sea region.

August 2020 compared to previous years

Average trend for August sea ice loss since 1979

Figure 3. Monthly August ice extent for 1979 to 2020 shows a decline of 10.7 percent per decade.

Credit: National Snow and Ice Data Center
High-resolution image

The average sea ice extent for August 2020 as a whole is 5.08 million square kilometers (1.96 million square miles), placing it third lowest in the 42-year satellite record. Including 2020, the linear rate of decline for August sea ice extent is 10.7 percent per decade. This corresponds to a trend of 76,800 square kilometers (29,700 square miles) per year, or about the size of New Hampshire, Vermont, and Massachusetts combined. Over the satellite record, the Arctic Ocean has lost about 3.15 million square kilometers (1.22 million square miles) of ice in August, based on the difference in linear trend values in 2020 and 1979. This is comparable in size to about twice the size of the state of Alaska.

Atlantification continues

As discussed in a recent paper in the Journal of Climate led by colleague Igor Polyakov of the University of Alaska, the process of “Atlantification” of the Arctic Ocean, first noted in the Barents Sea, is continuing, with significant effects on the sea ice cover during the winter season in the Eastern Eurasian Basin. The relatively fresh surface layer of the Arctic Ocean is underlain by warm, salty water that is imported from the northern Atlantic Ocean. The cold fresh surface layer, because of its lower density, largely prevents the warm, salty Atlantic waters from mixing upwards. However, the underlying Atlantic water appears to have moved closer to the surface in recent years, reducing the density contrast with the water above it. Recent observations show this warm water “blob,” usually found at about 150 meters (492 feet) below the surface, has shifted within 80 meters (263 feet) of the surface. This has resulted in an increase in the upward winter ocean heat flow to the underside of the ice from typical values of 3 to 4 watts per square meter in 2007 to 2008 to greater than 10 watts per square meter from 2016 to 2018. Polyakov estimates that this is equivalent to a two-fold reduction in winter ice growth.

Other recent news

The RV Polarstern, which has been supporting the Multidisciplinary drifting Observatory for the Study of Arctic Climate (MOSAiC) expedition, conducted an impromptu detour to the North Pole, taking advantage of fairly light ice conditions. Large openings in the sea ice were present north of Greenland, an area that would normally be very difficult to traverse. The United States’ medium-duty icebreaker Healy did not fare as well—a fire broke out in the engine compartment, and although it was quickly extinguished, the damage is extensive, and with the ship temporarily out of commission, a planned expedition to the Chukchi and Beaufort Seas has been cancelled.

Antarctic sea ice: looking up down below

Antarctic sea ice extent

Figure 4. The graph above shows Antarctic sea ice extent as of September 01, 2020, along with daily ice extent data for four previous years and the record maximum extent year. 2020 is shown in blue, 2019 in green, 2018 in orange, 2017 in brown, 2016 in purple, and 2014 in dashed brown. The 1981 to 2010 median is in dark gray. The gray areas around the median line show the interquartile and interdecile ranges of the data. Sea Ice Index data.

Credit: National Snow and Ice Data Center
High-resolution image

Antarctic sea ice growth in late winter has brought the ice extent substantially above average in late August for the first time in four years. Ice extent exceeded the 1981 to 2010 average over much of the Weddell Sea and off the Wilkes Land coast. A few areas of below-average extent persisted in the Davis Sea (south of Perth, Australia) and the northeastern Ross Sea. The cause appears to be persistent high air pressure in the western Weddell Sea and the Davis Sea that generate offshore cold winds on the eastern sides of the high-pressure areas. While Antarctica often has a trio of high pressure and low pressure areas surrounding it, for the second half of August there were just two such pairs.

Further reading

Polyakov, I. V., et al. 2020. Weakening of Cold Halocline Layer Exposes Sea Ice to Oceanic Heat in the Eastern Arctic Ocean. Journal of Climate, 33, 8107–8123, doi:10.1175/JCLI-D-19-0976.1.