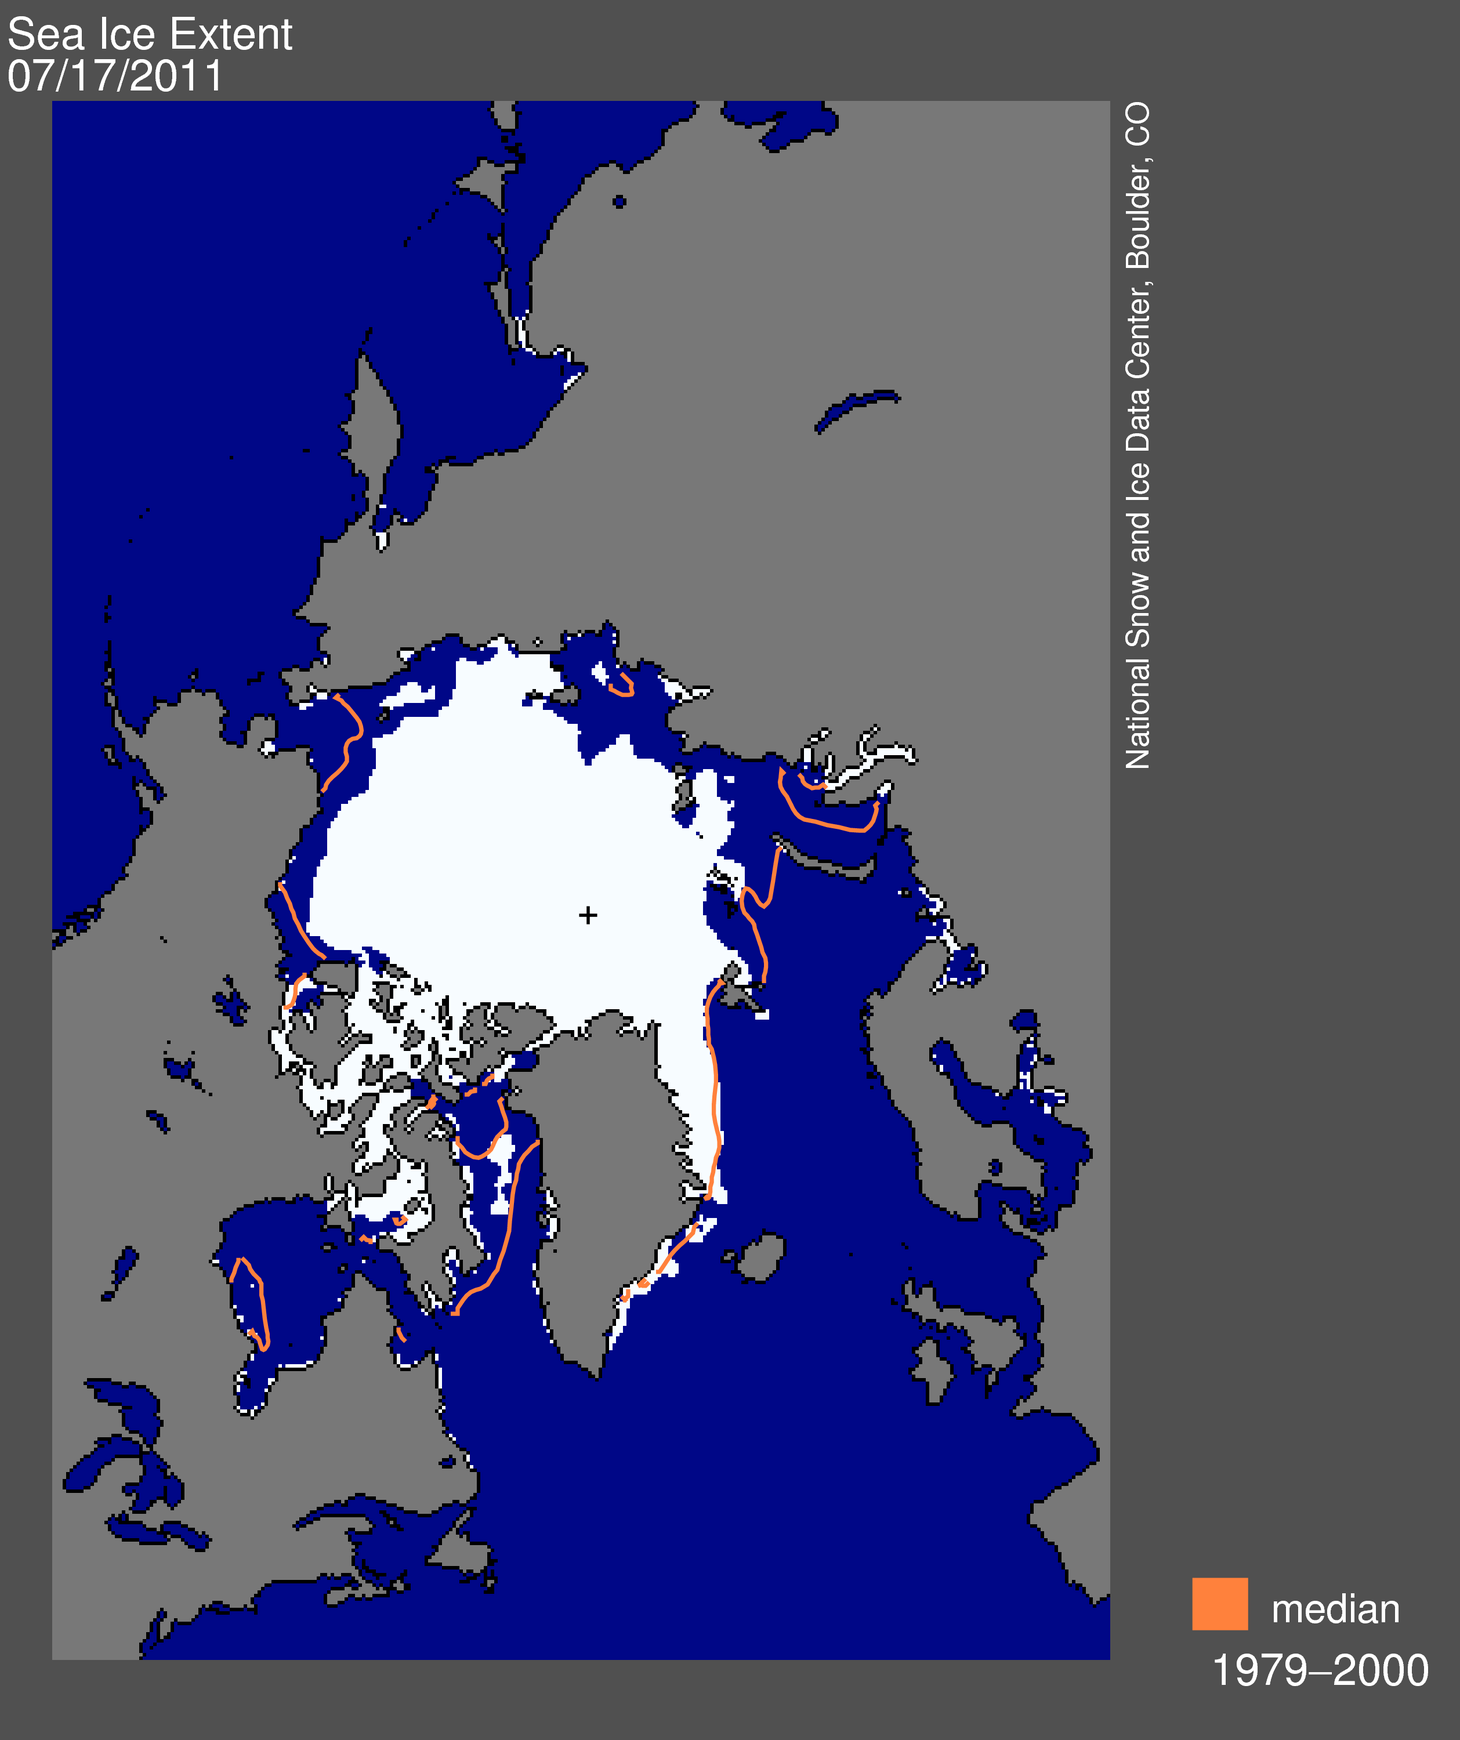
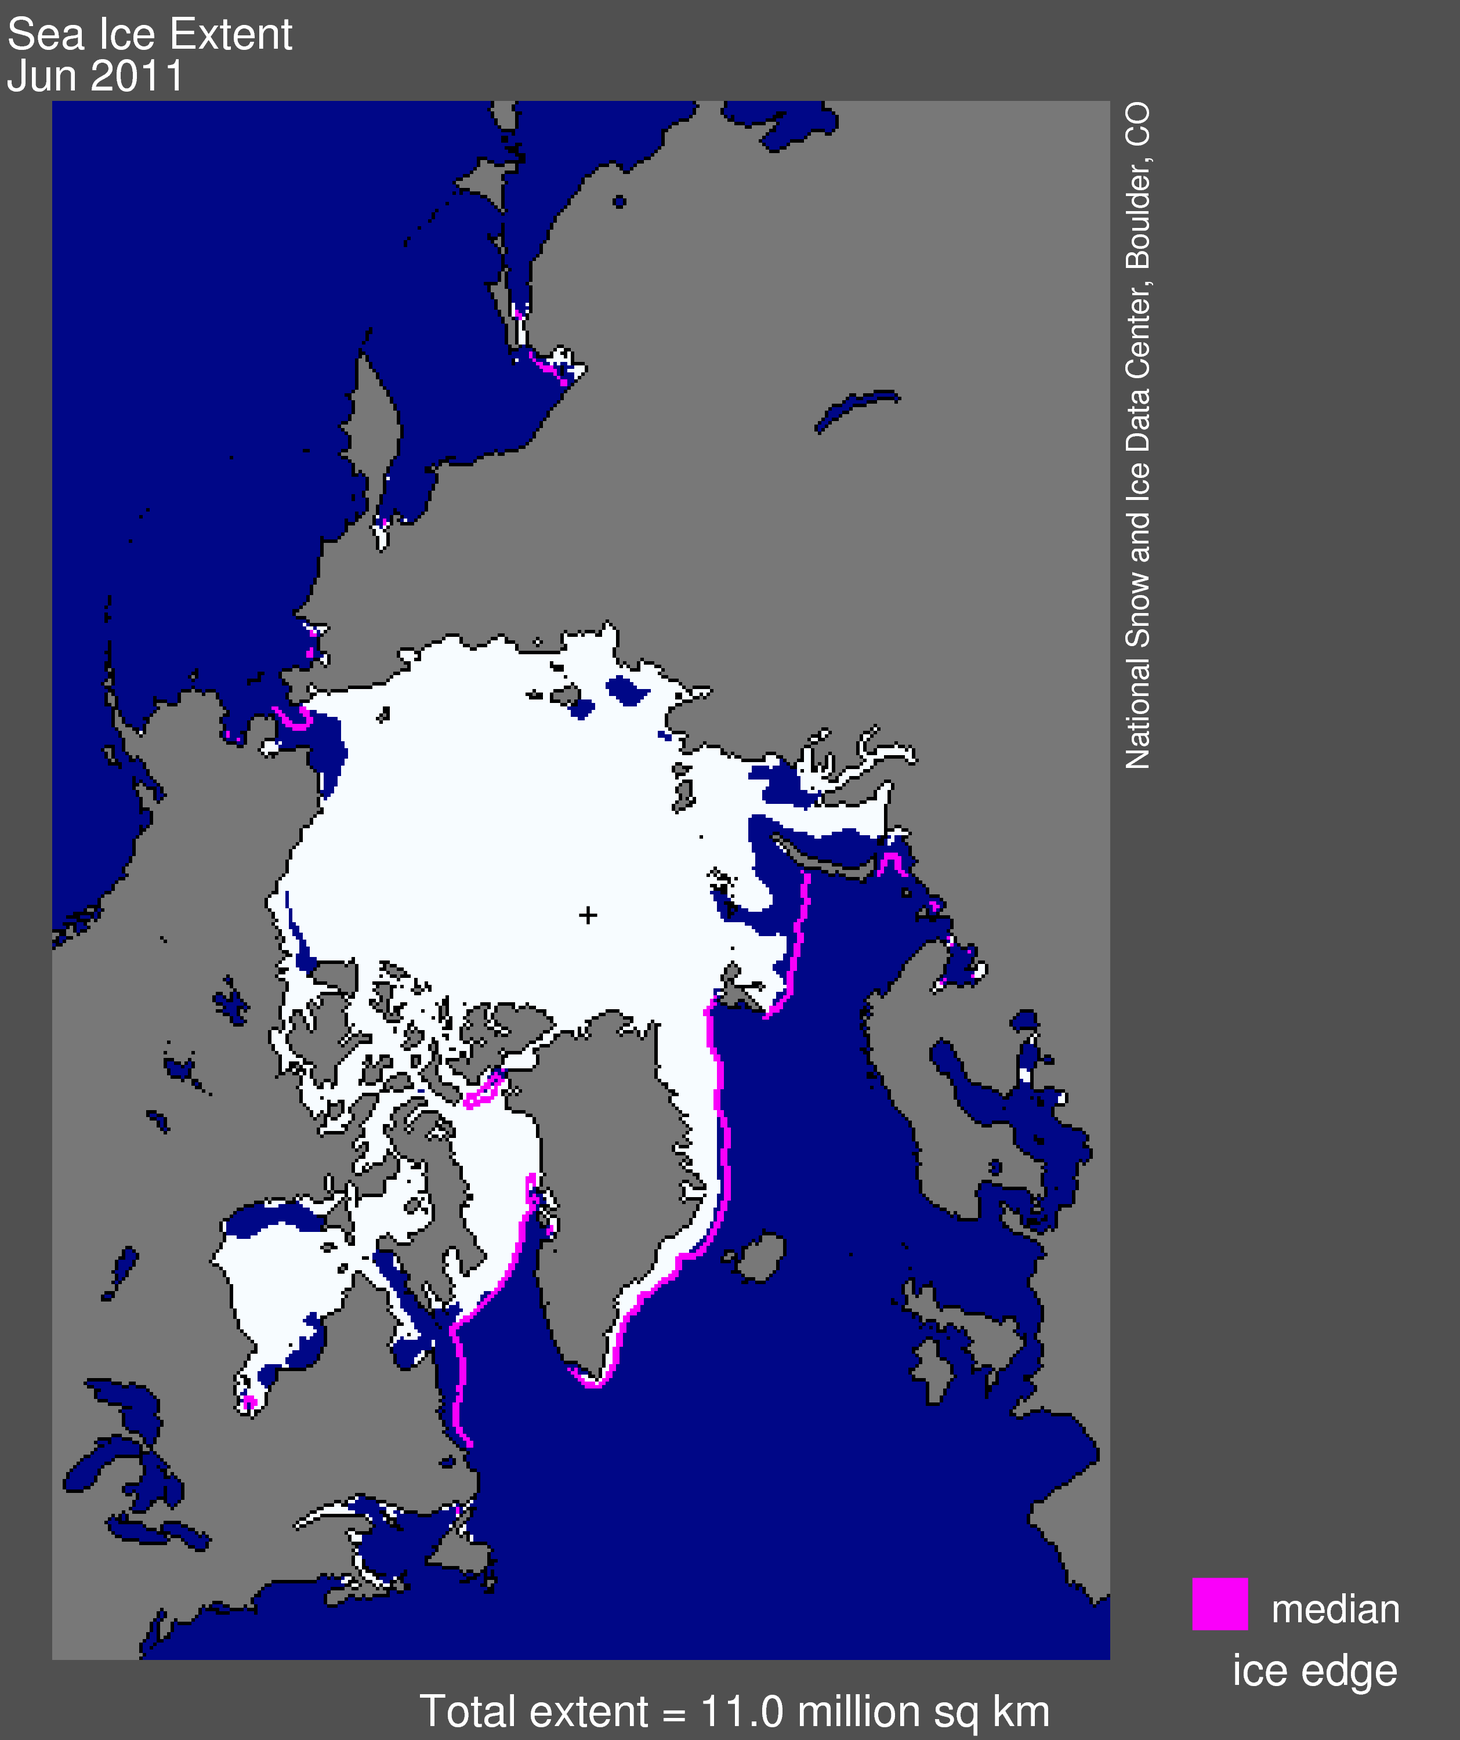
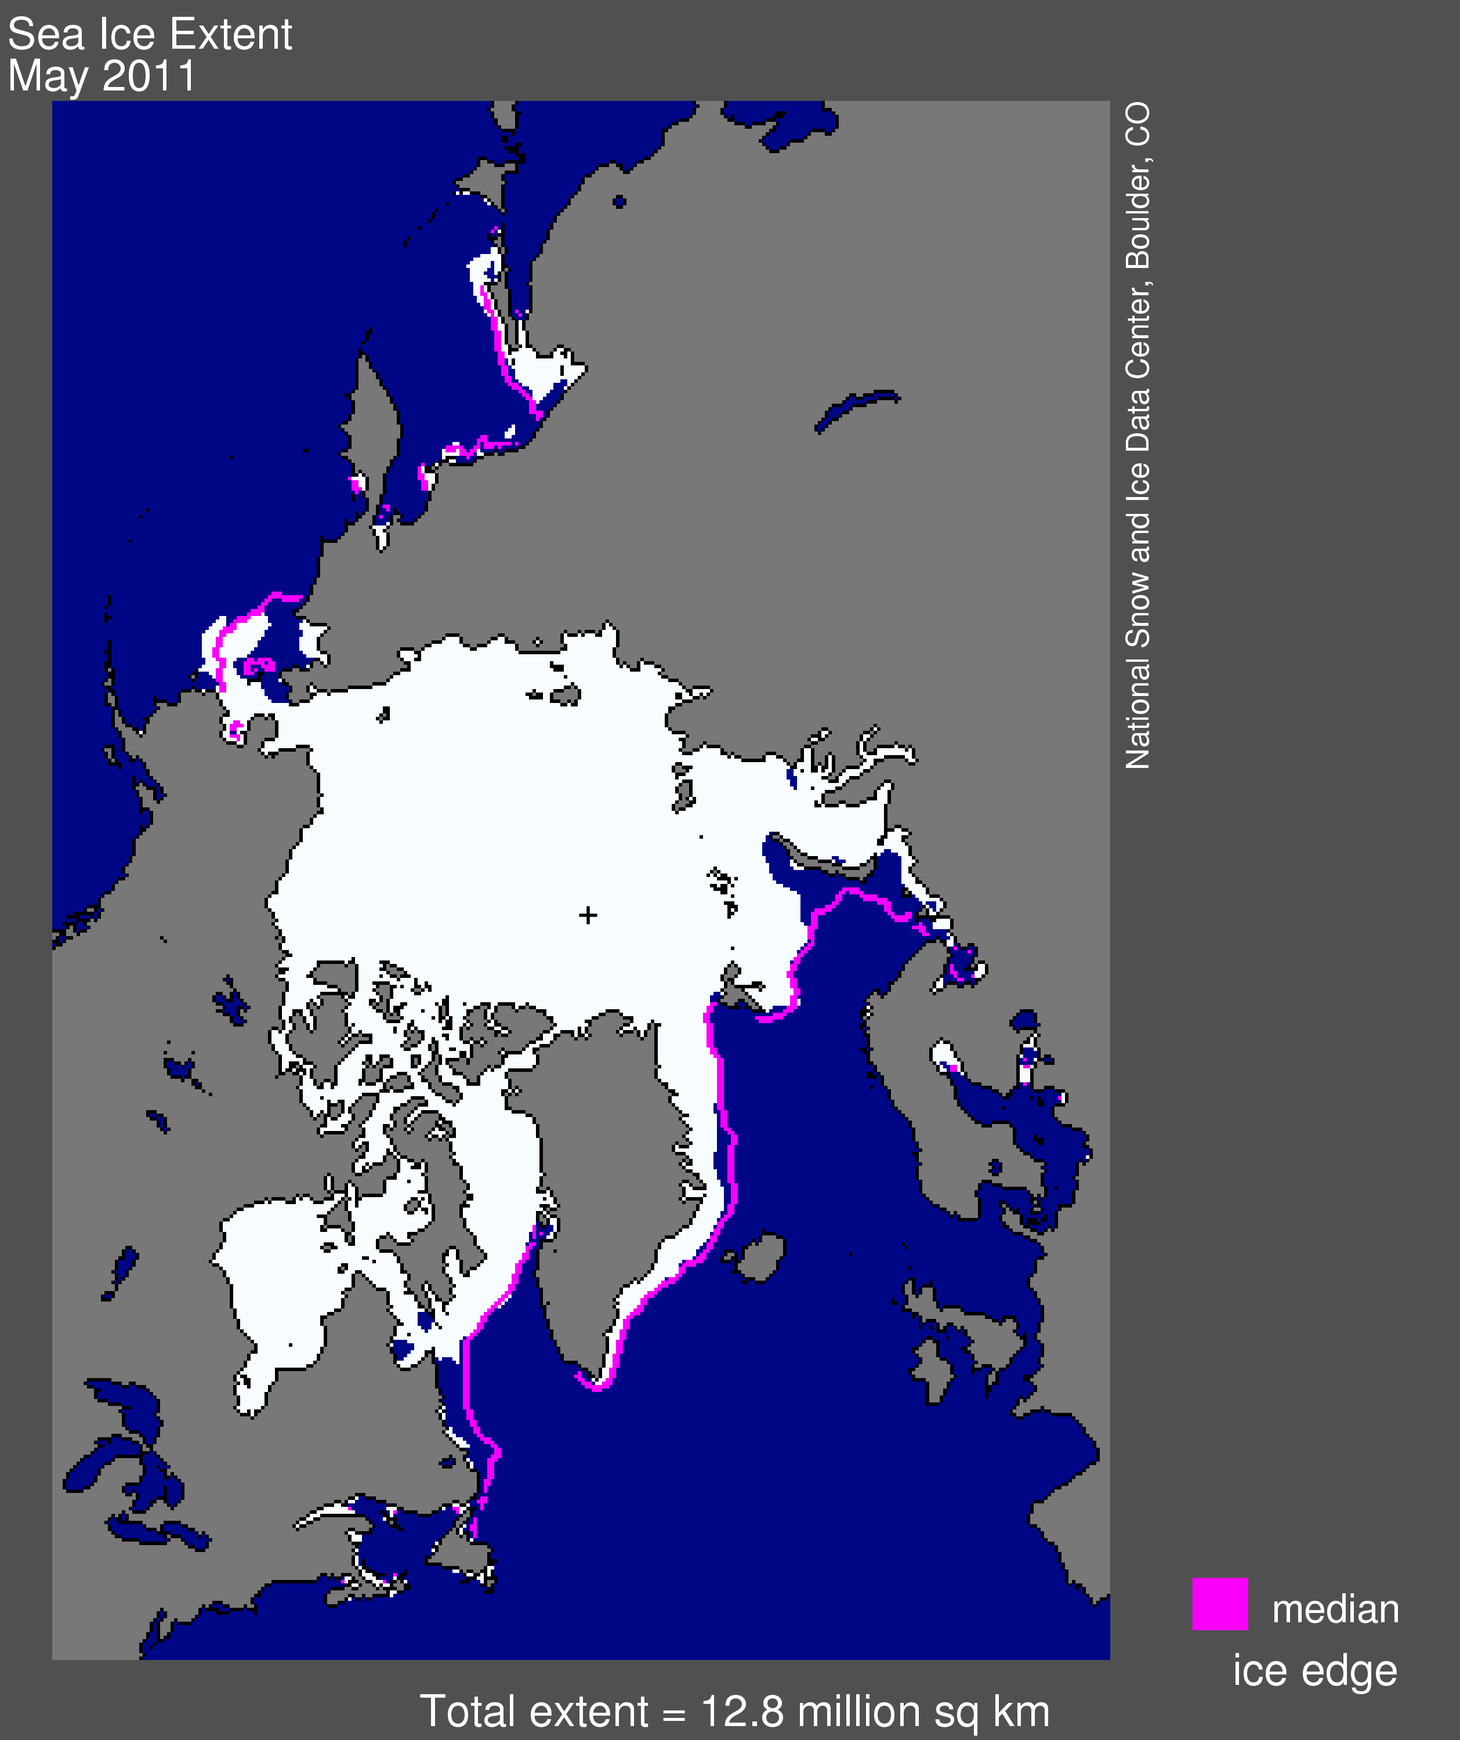
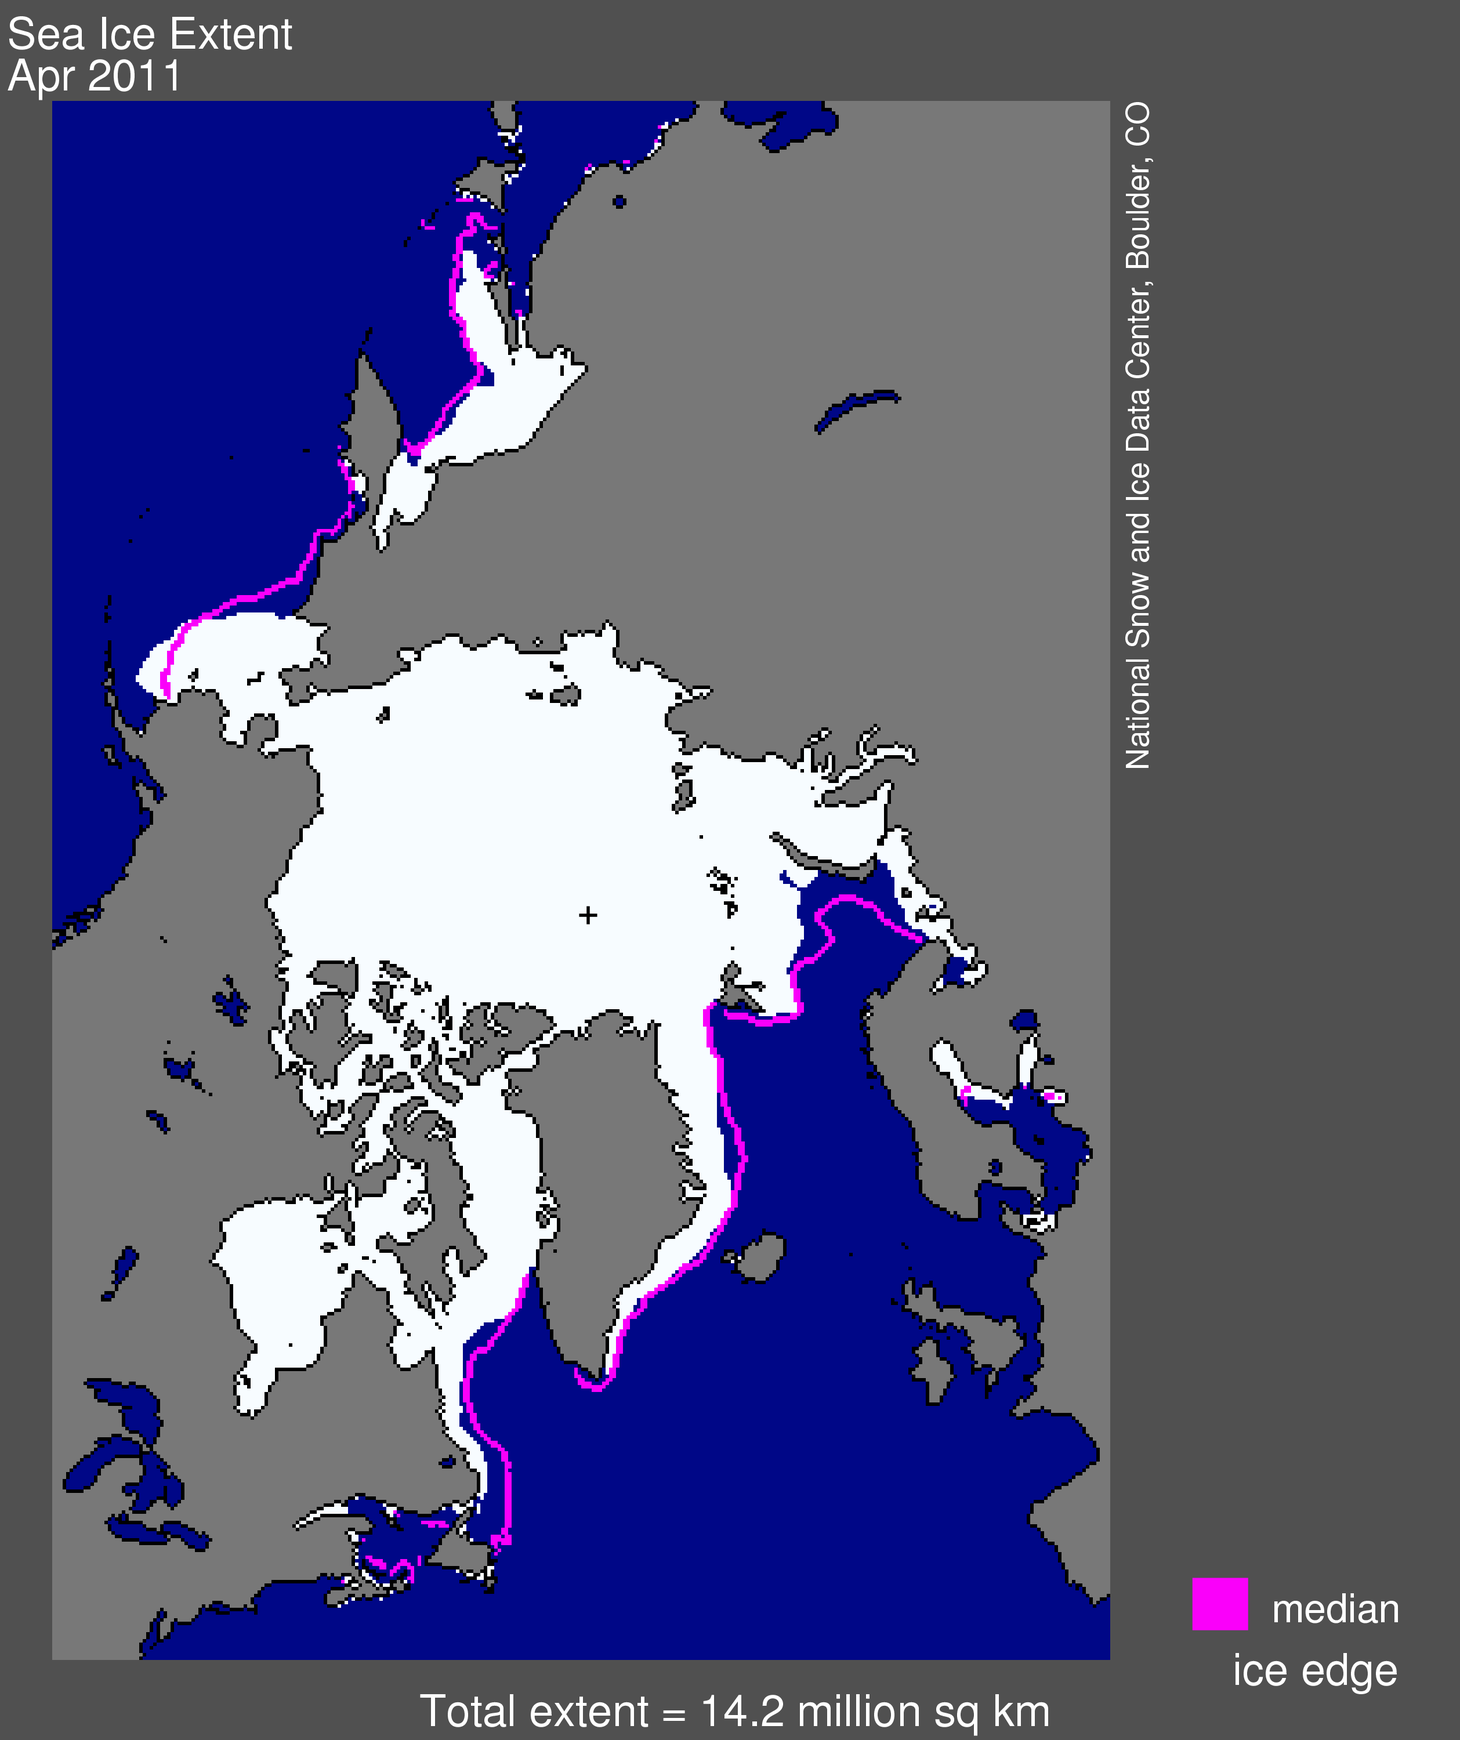
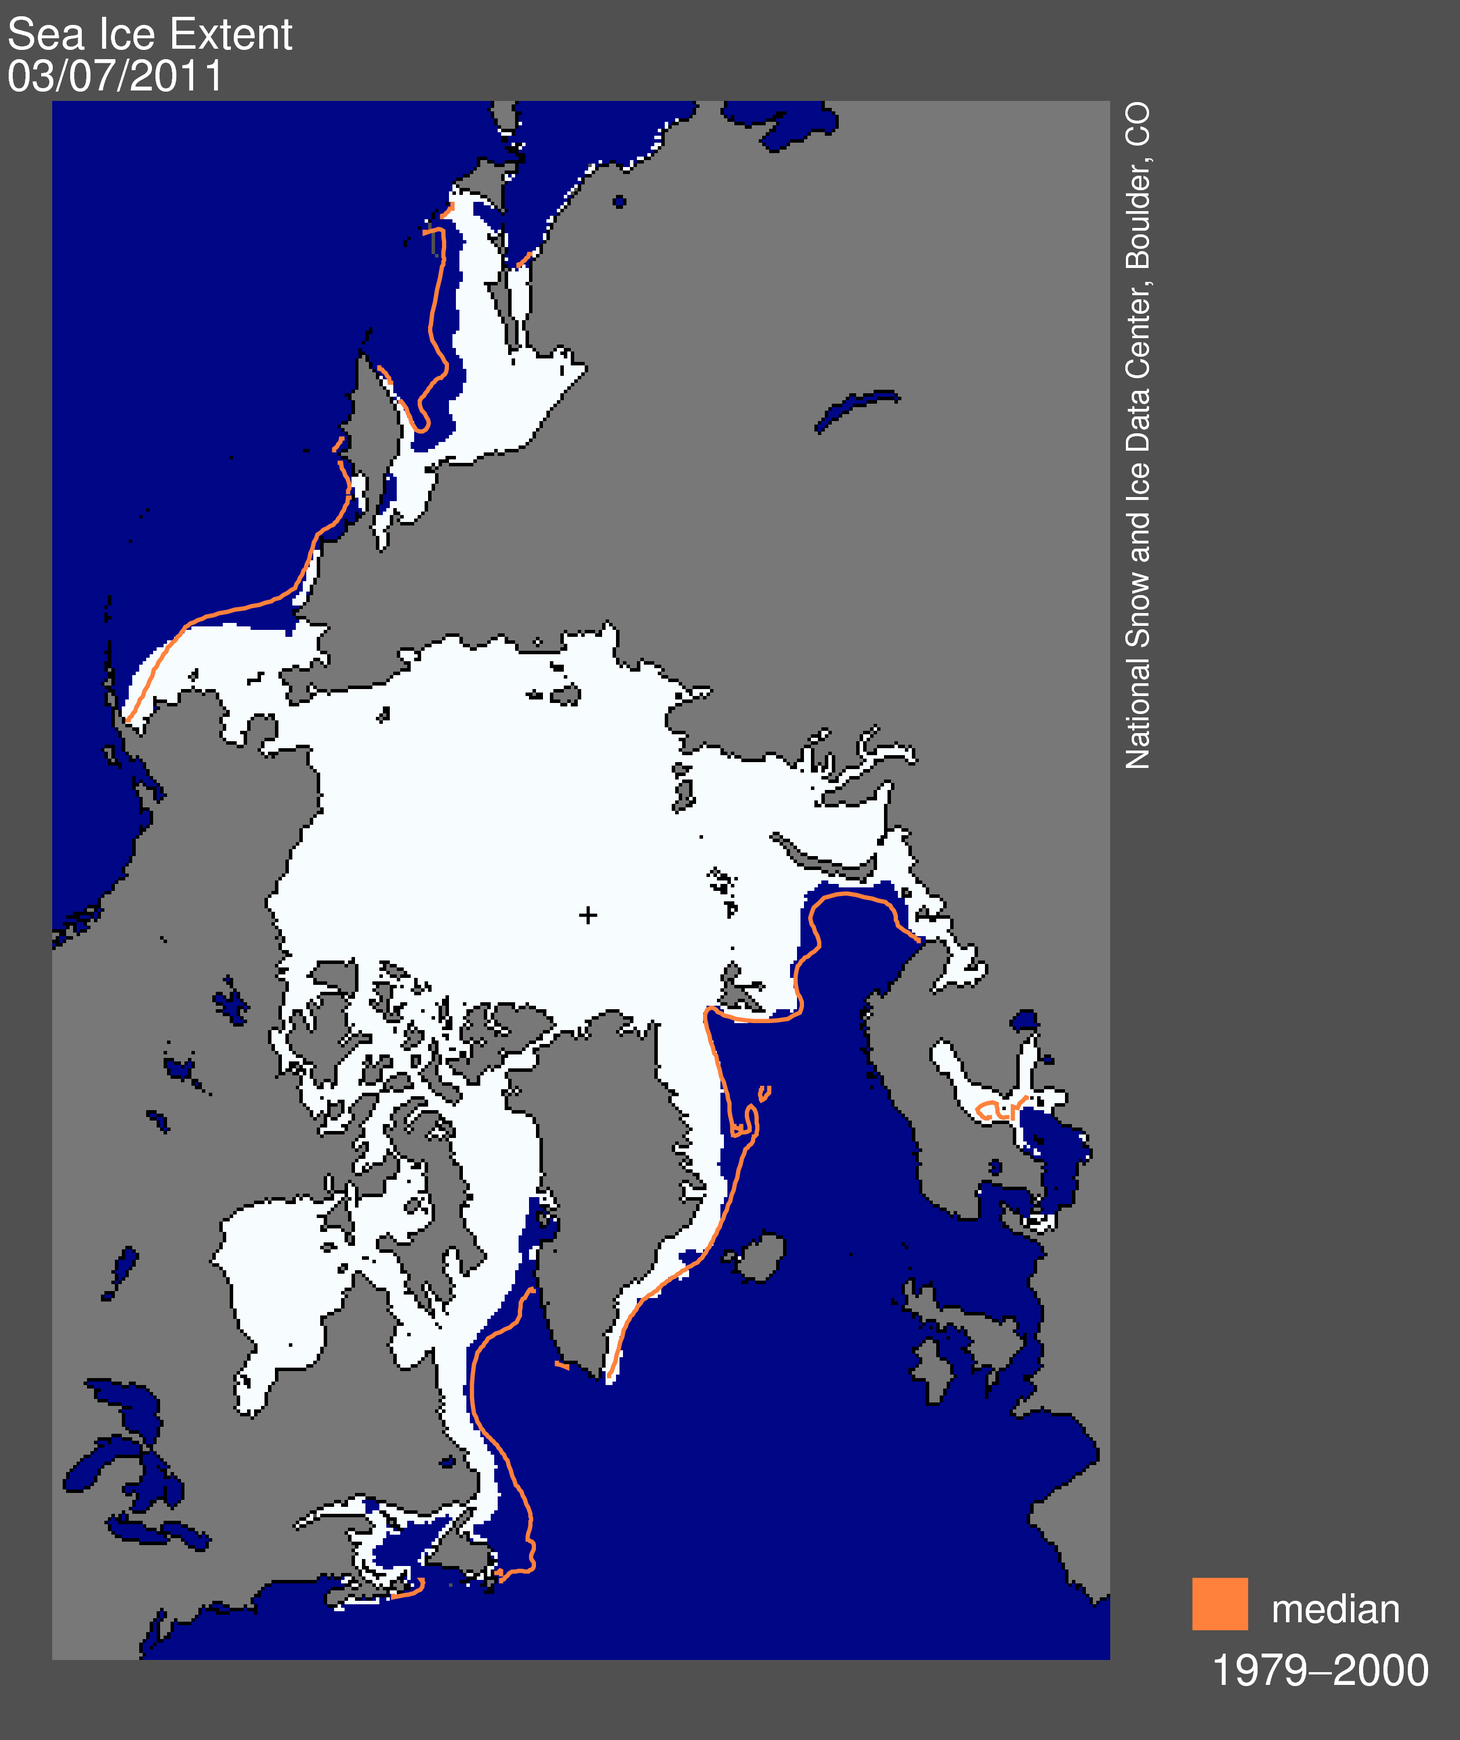
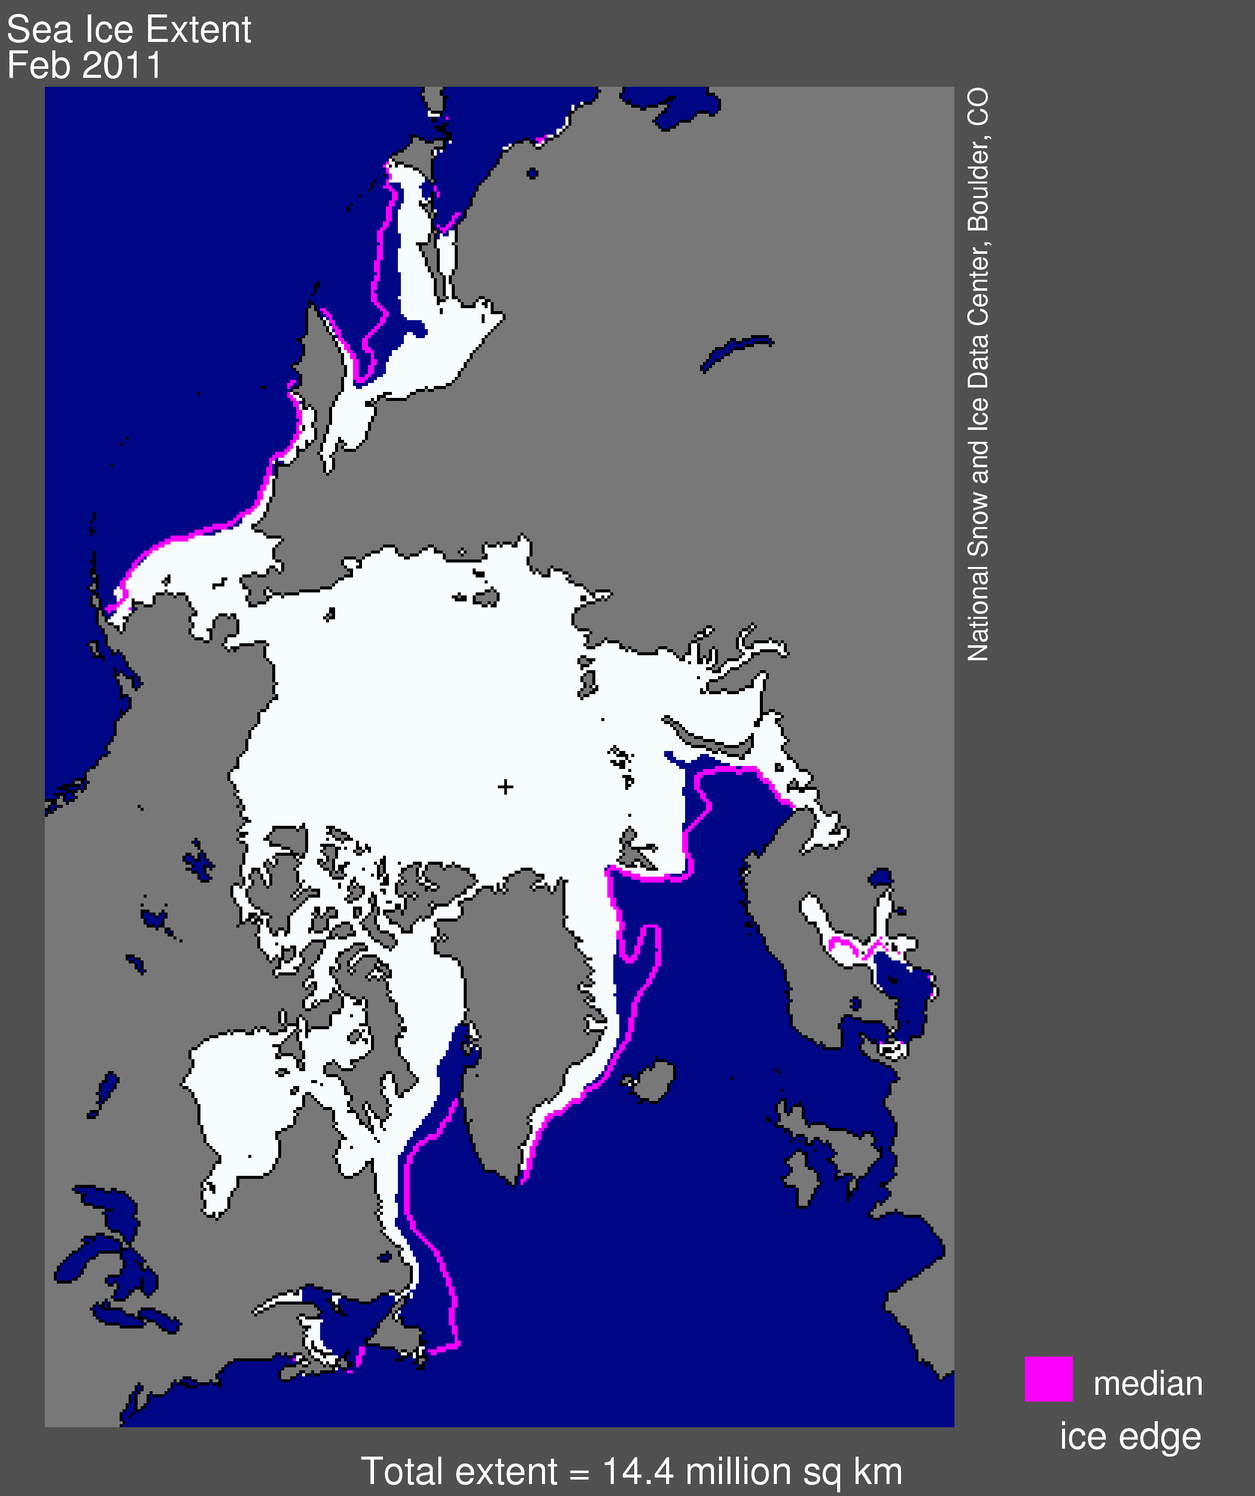
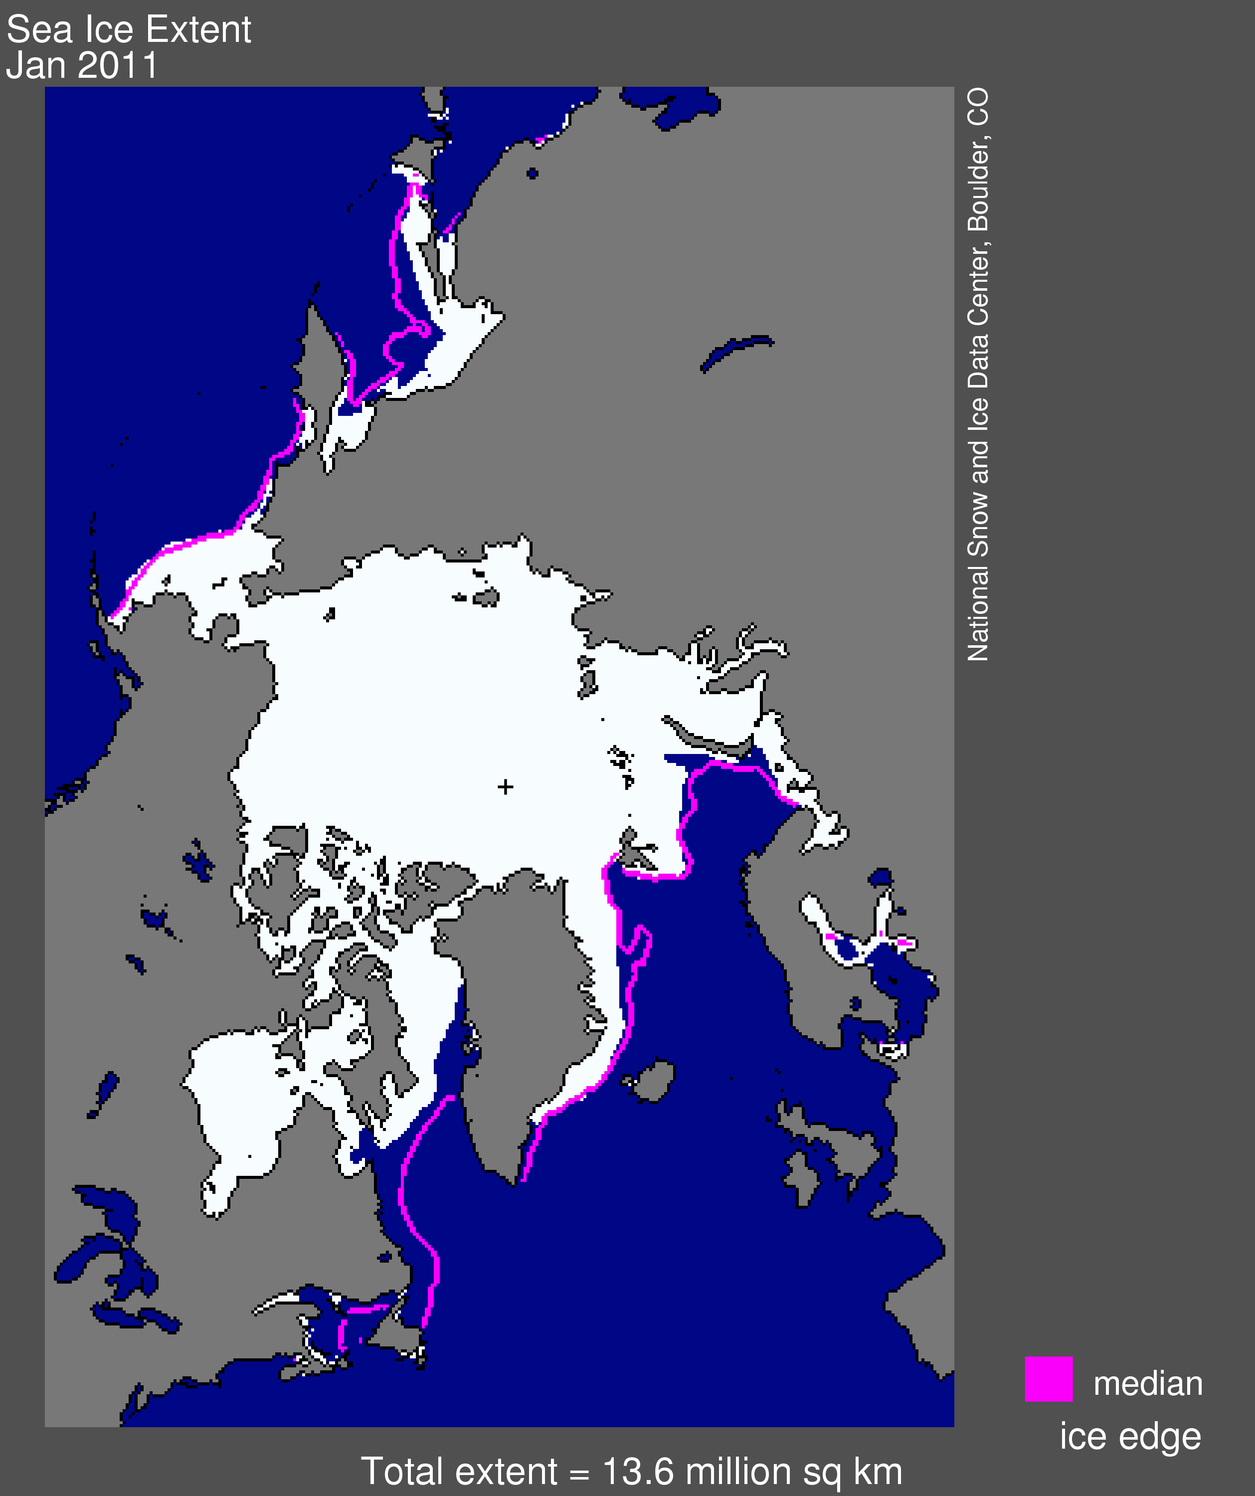
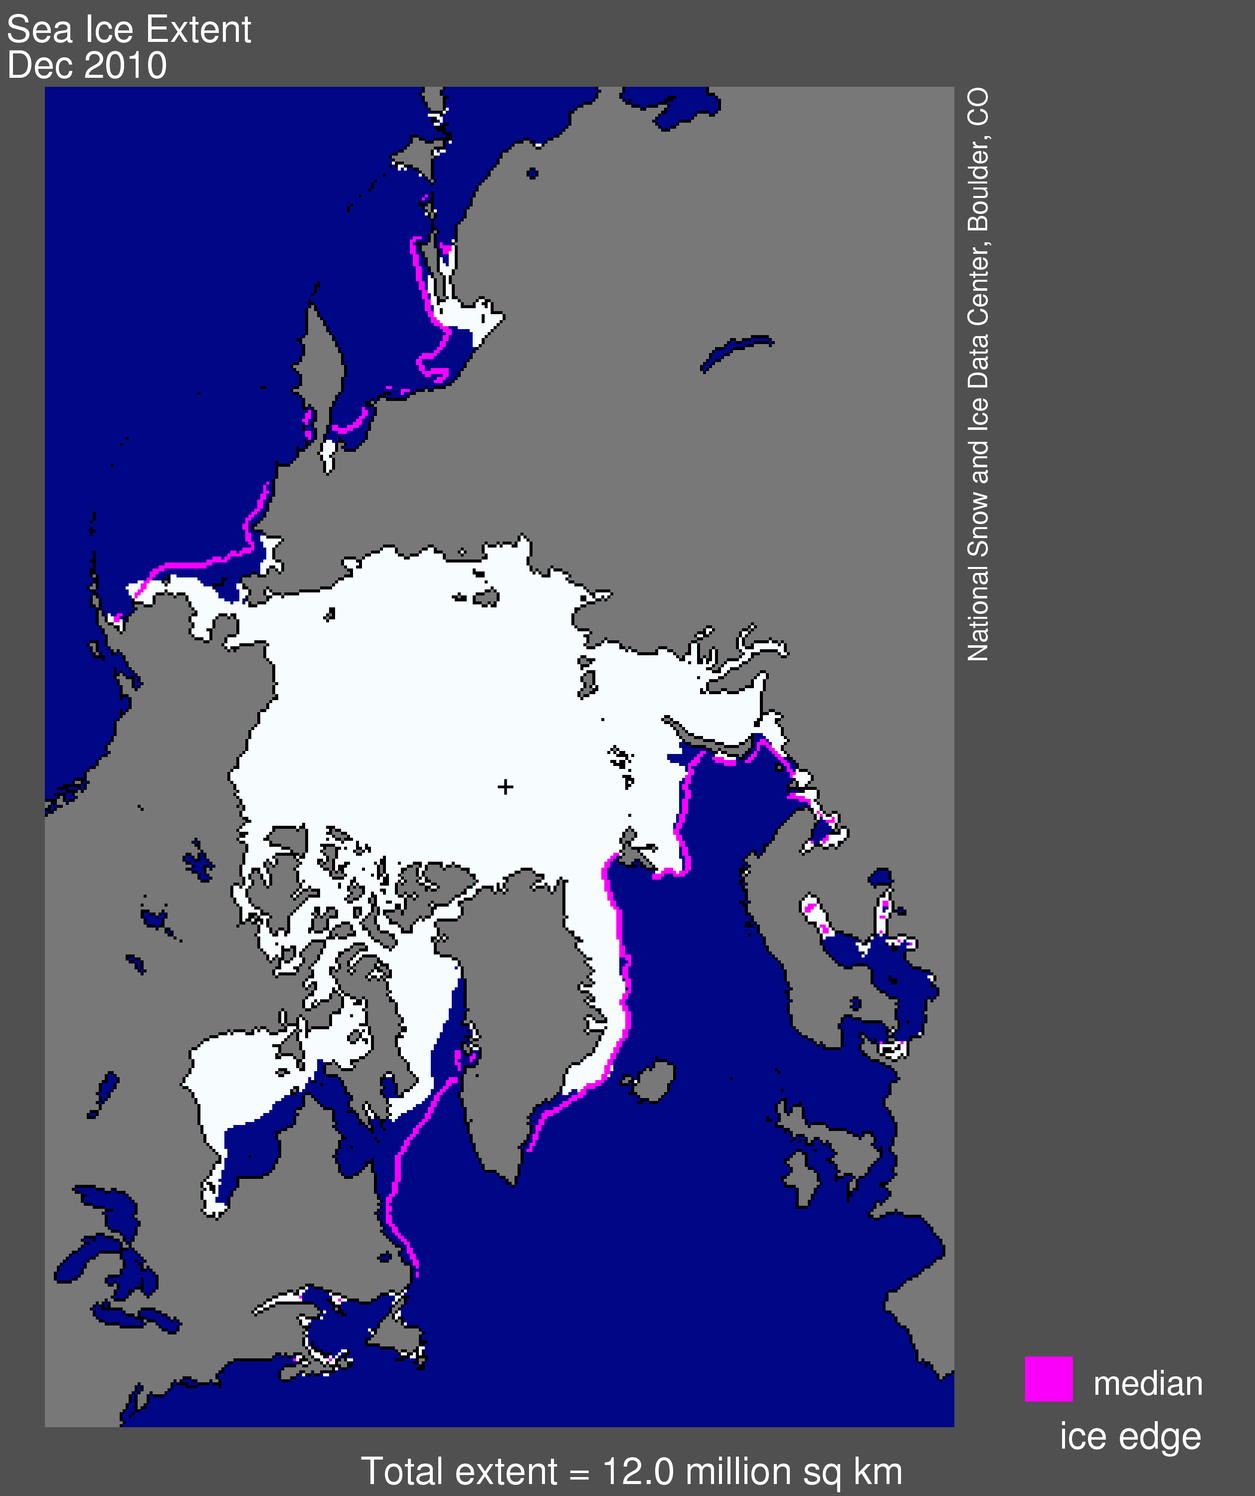
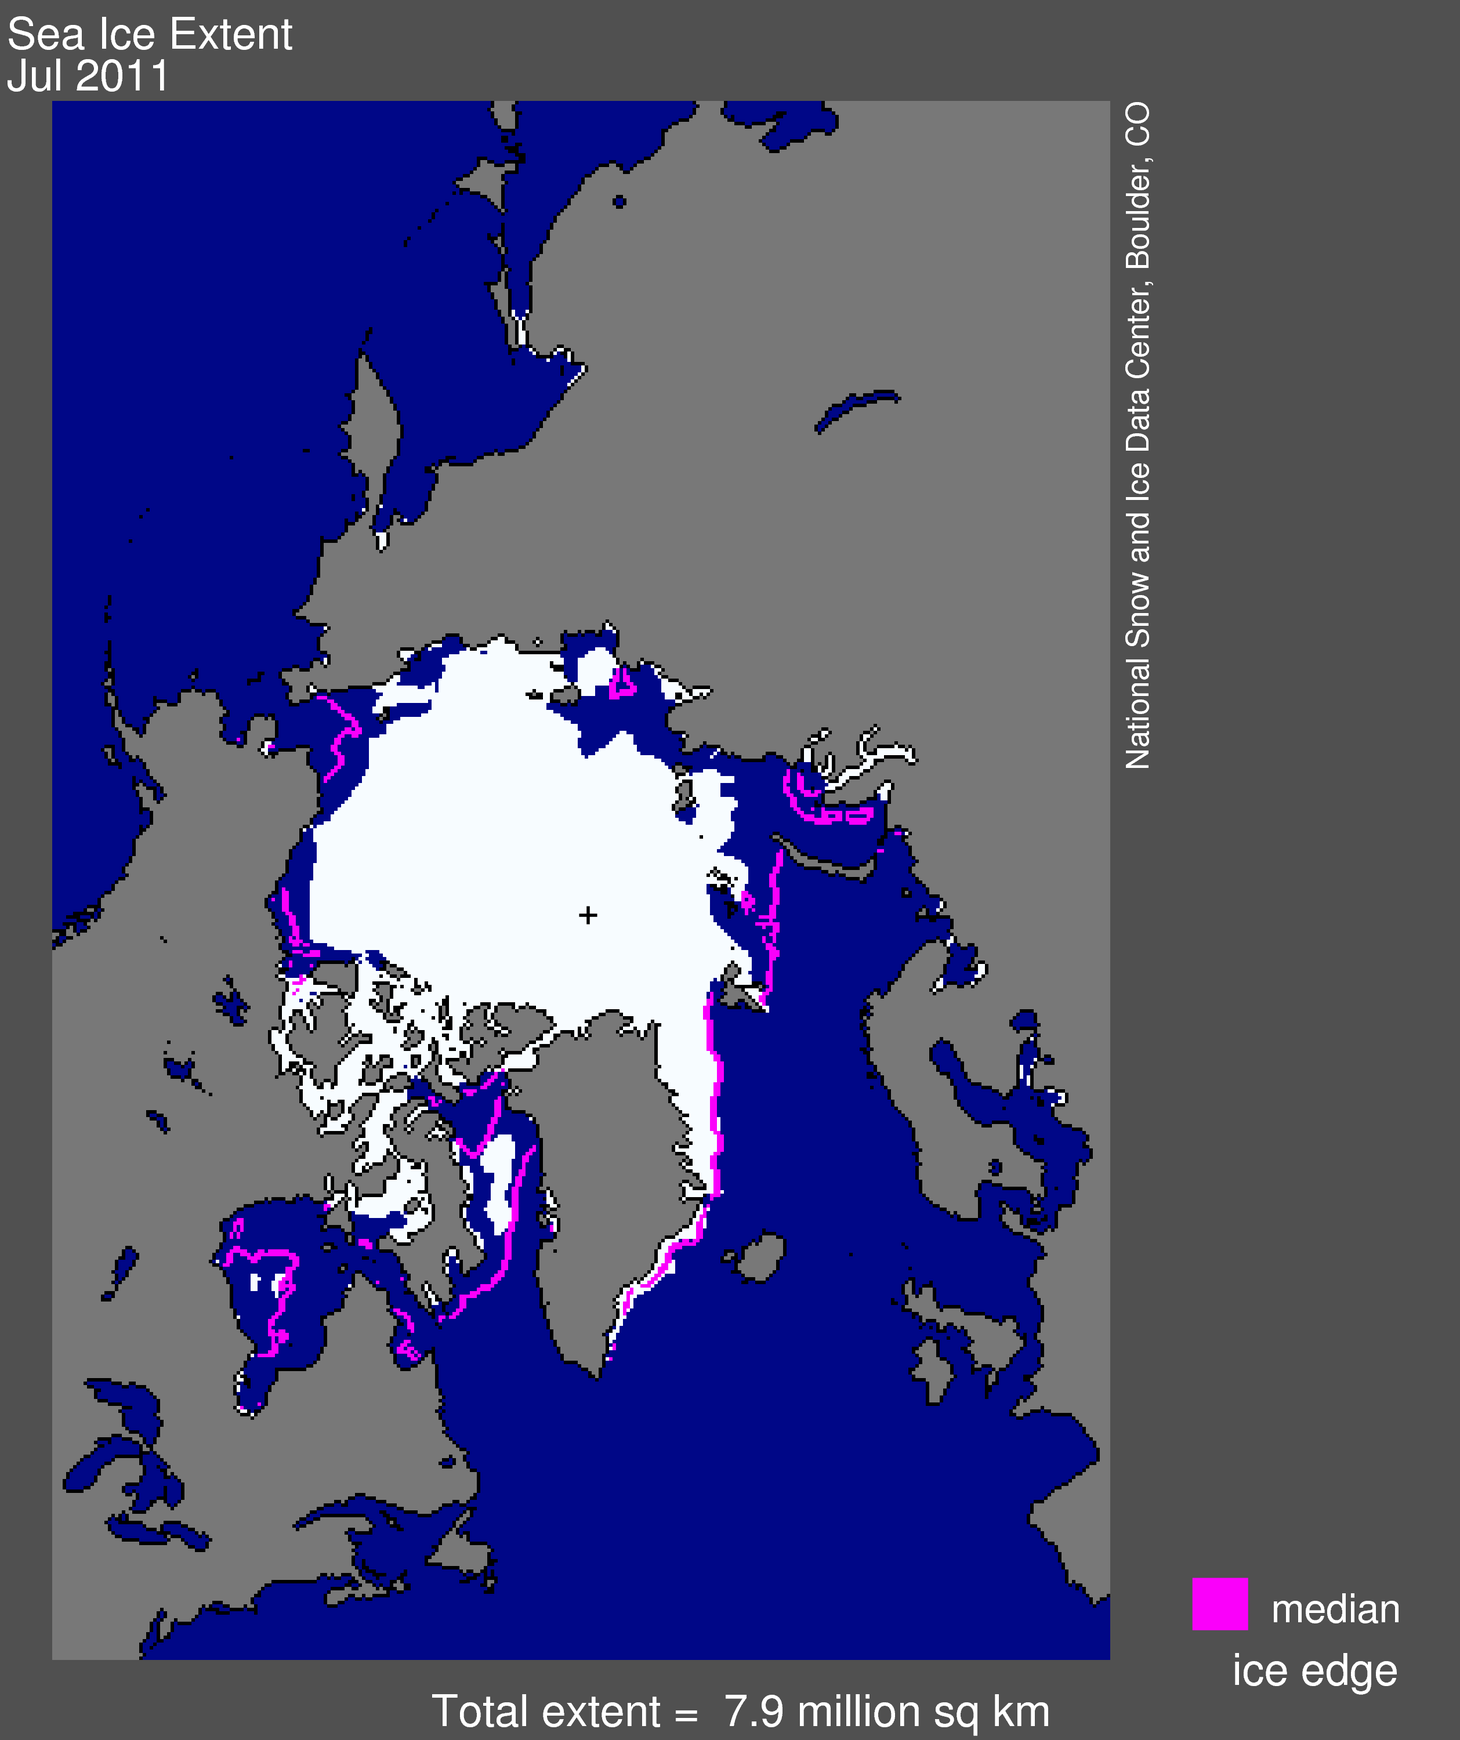
 Figure 1. Arctic sea ice extent for July 2011 was 7.92 million square kilometers (3.06 million square miles). The magenta line shows the 1979 to 2000 median extent for that month. The black cross indicates the geographic North Pole. Sea Ice Index data. About the data. —Credit: National Snow and Ice Data Center
High-resolution image
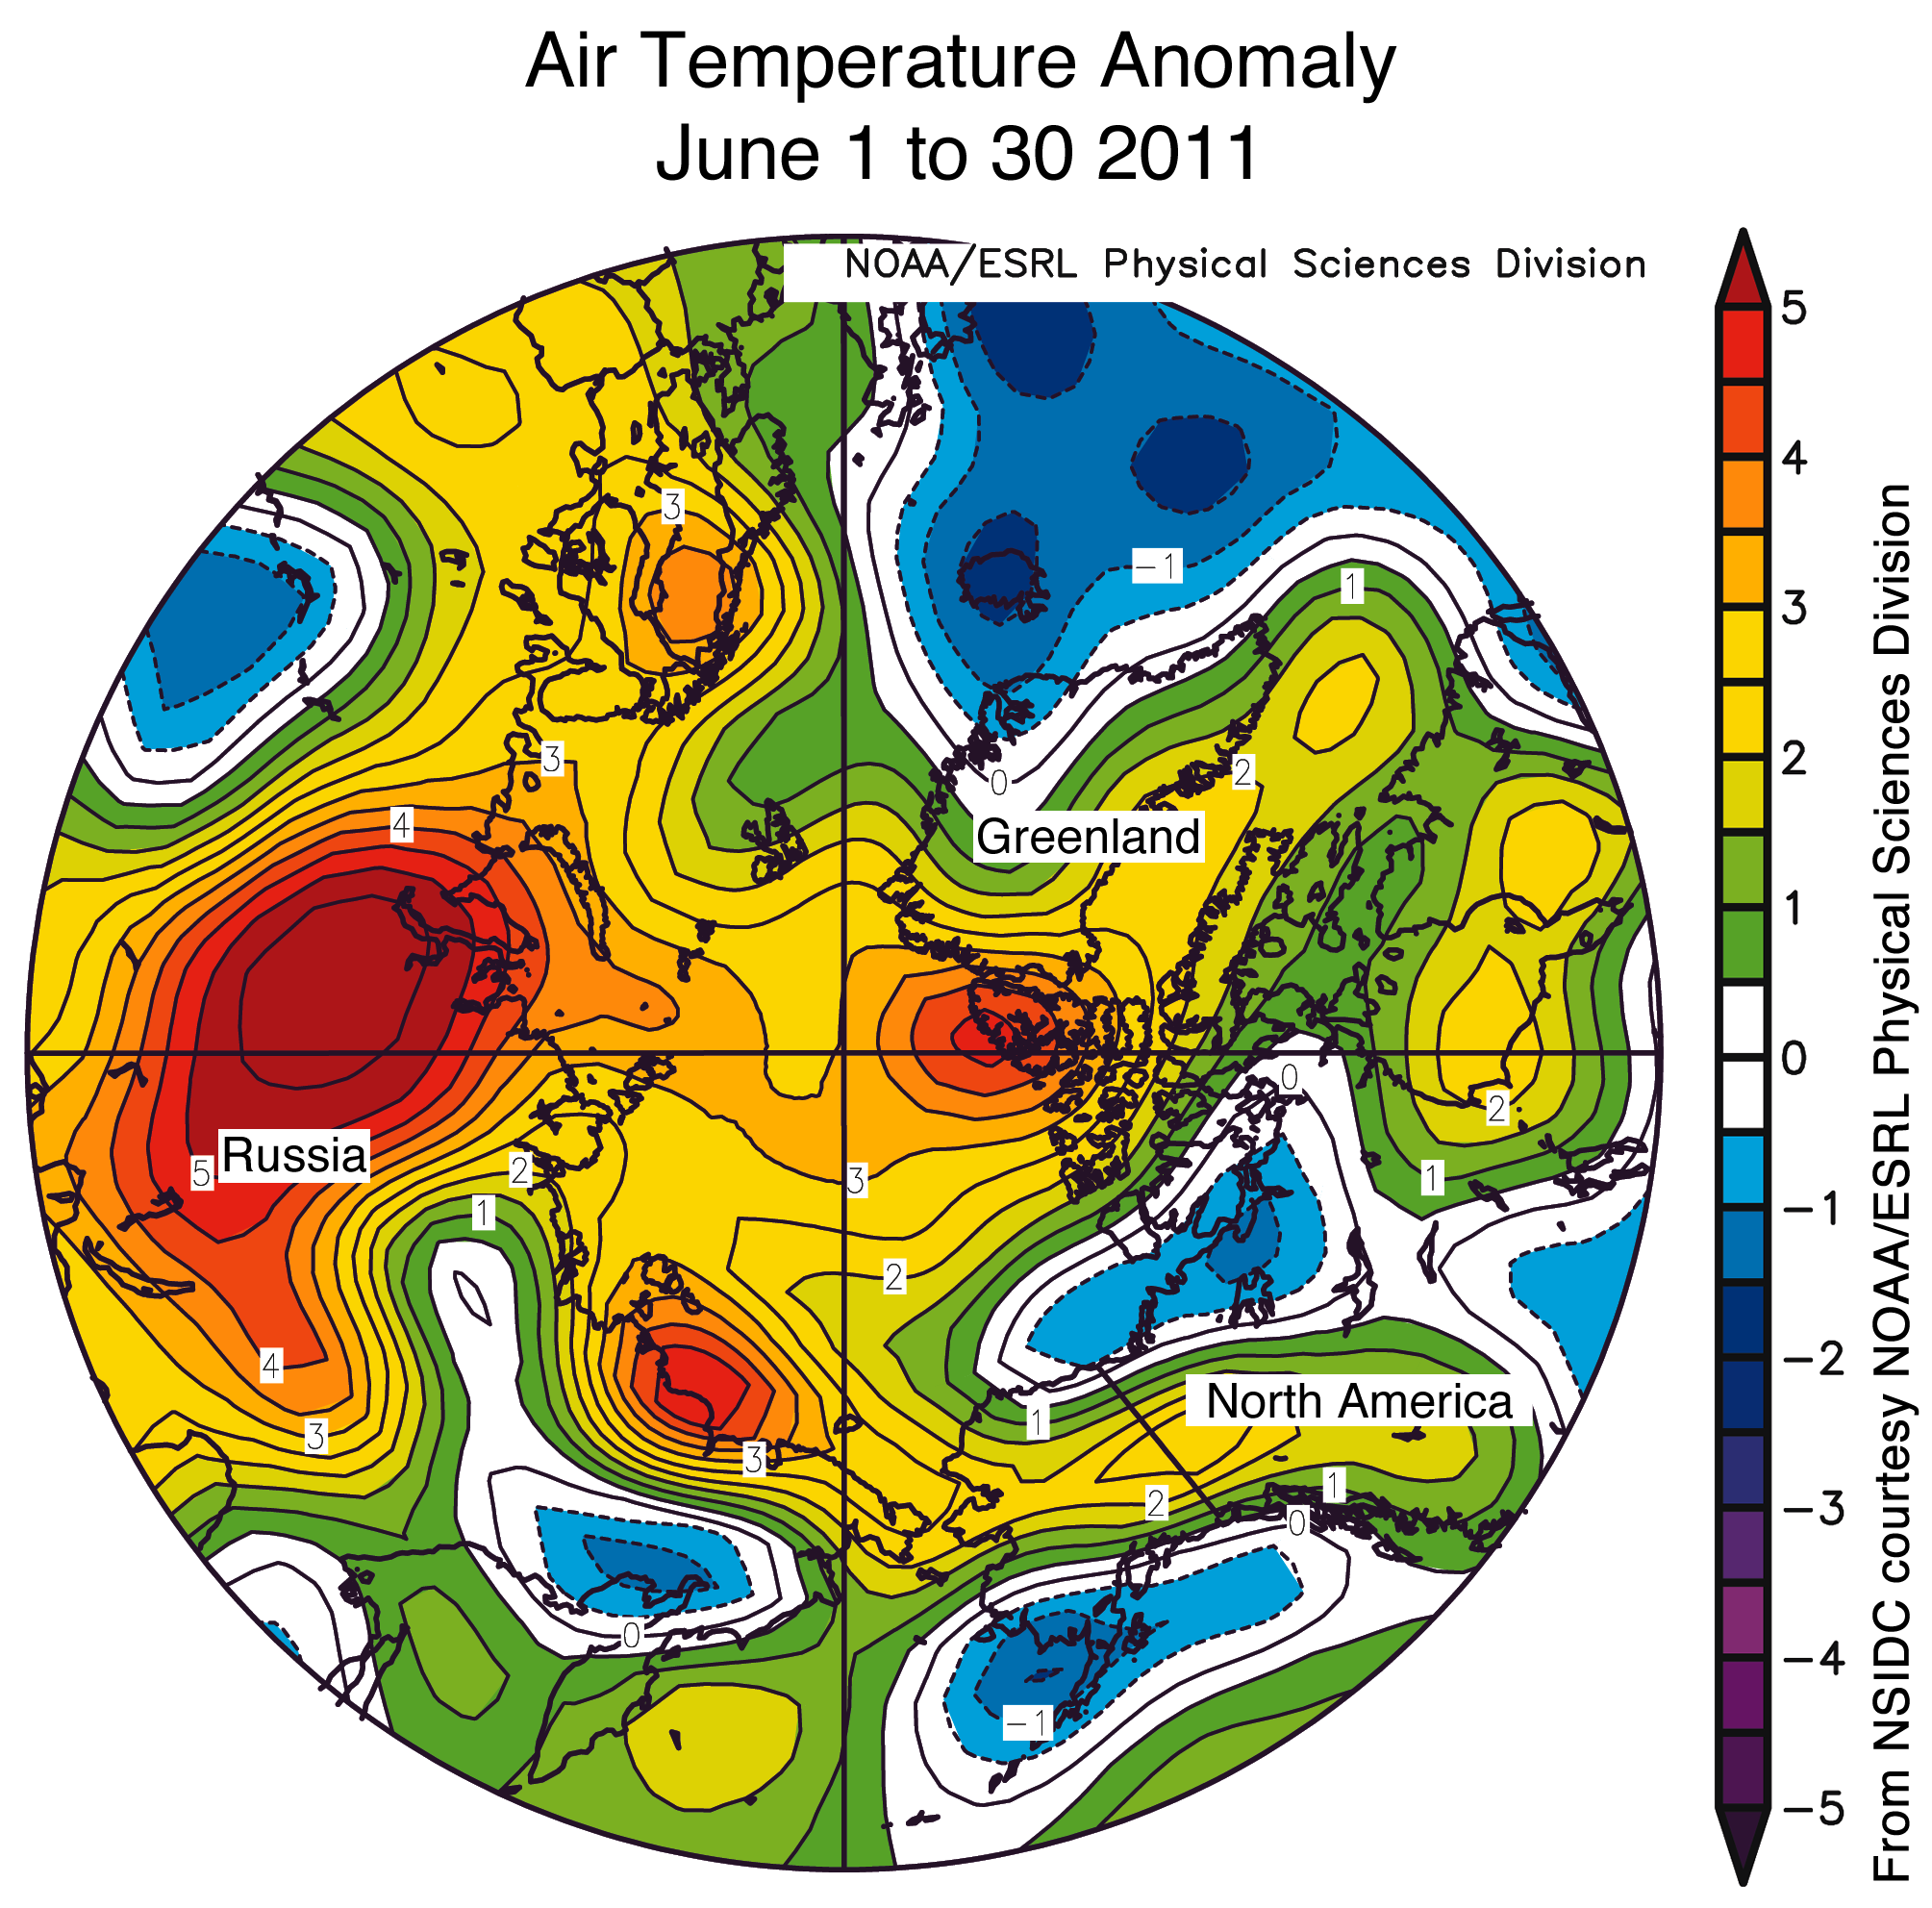
Overview of conditions
Average ice extent for July 2011 was 7.92 million square kilometers (3.06 million square miles). This is 210,000 square kilometers (81,000 square miles) below the previous record low for the month, set in July 2007, and 2.18 million square kilometers (842,000 square miles) below the average for 1979 to 2000.
On July 31, 2011 Arctic sea ice extent was 6.79 million square kilometers (2.62 million square miles). This was slightly higher than the previous record low for the same day of the year, set in 2007. Sea ice coverage remained below normal everywhere except the East Greenland Sea.
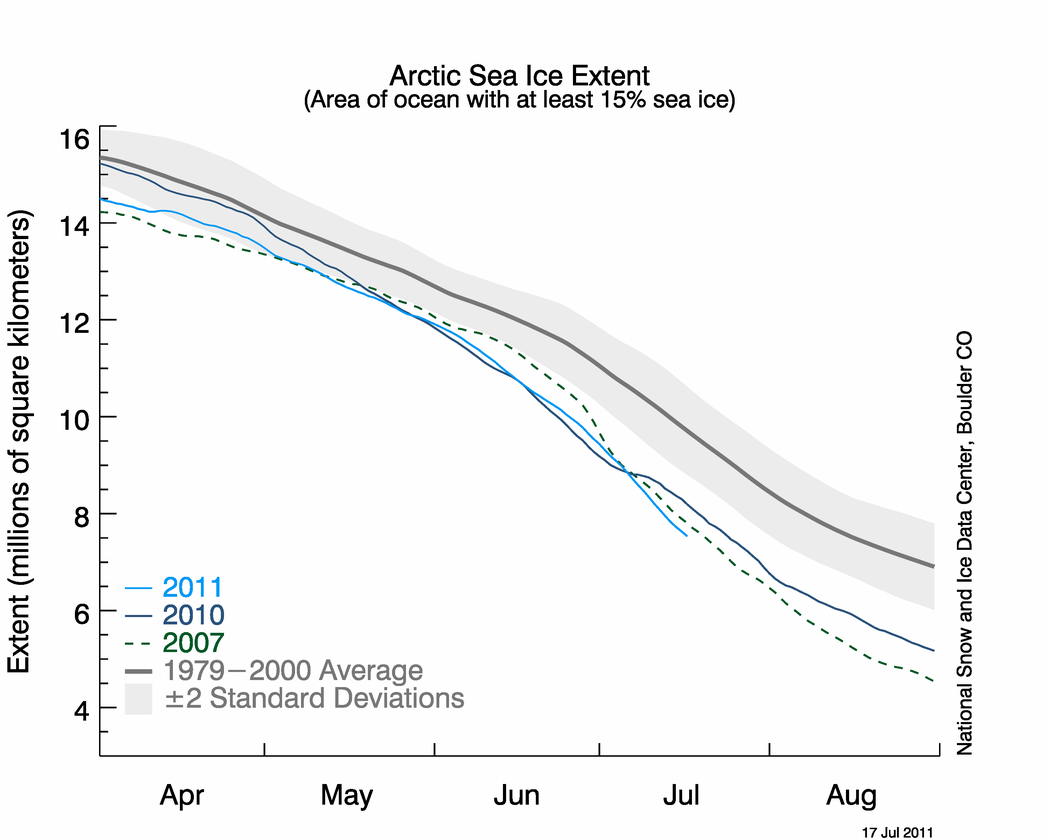
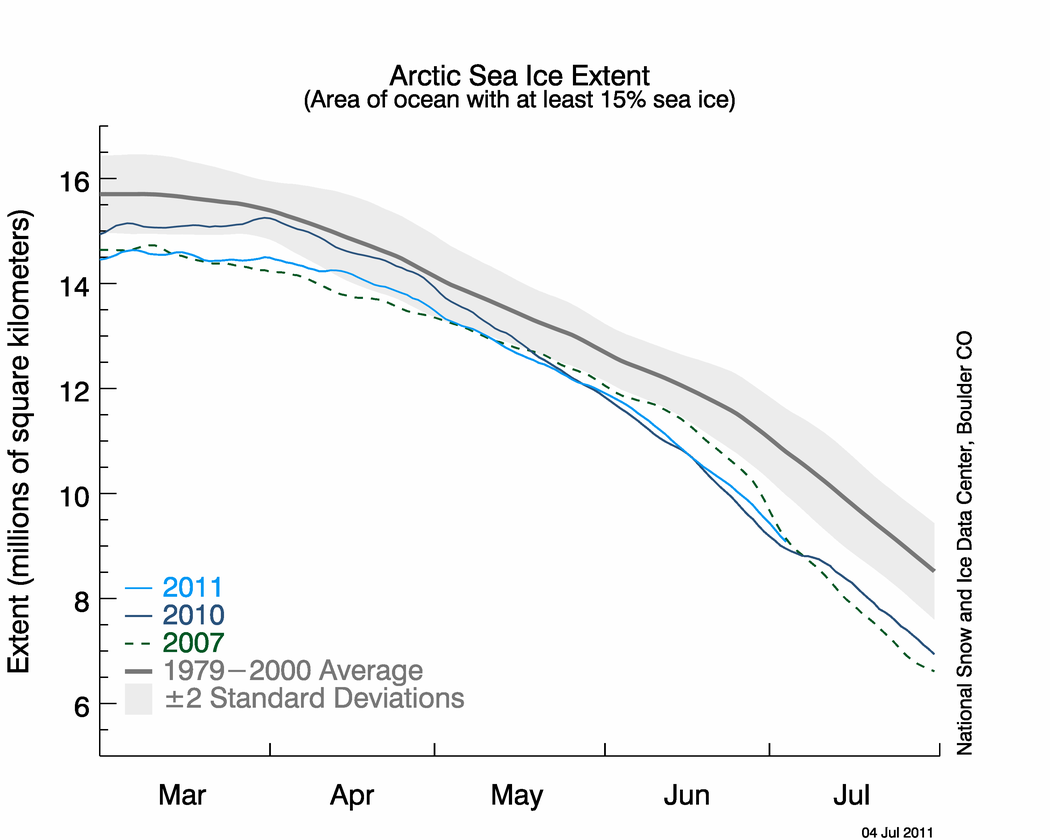
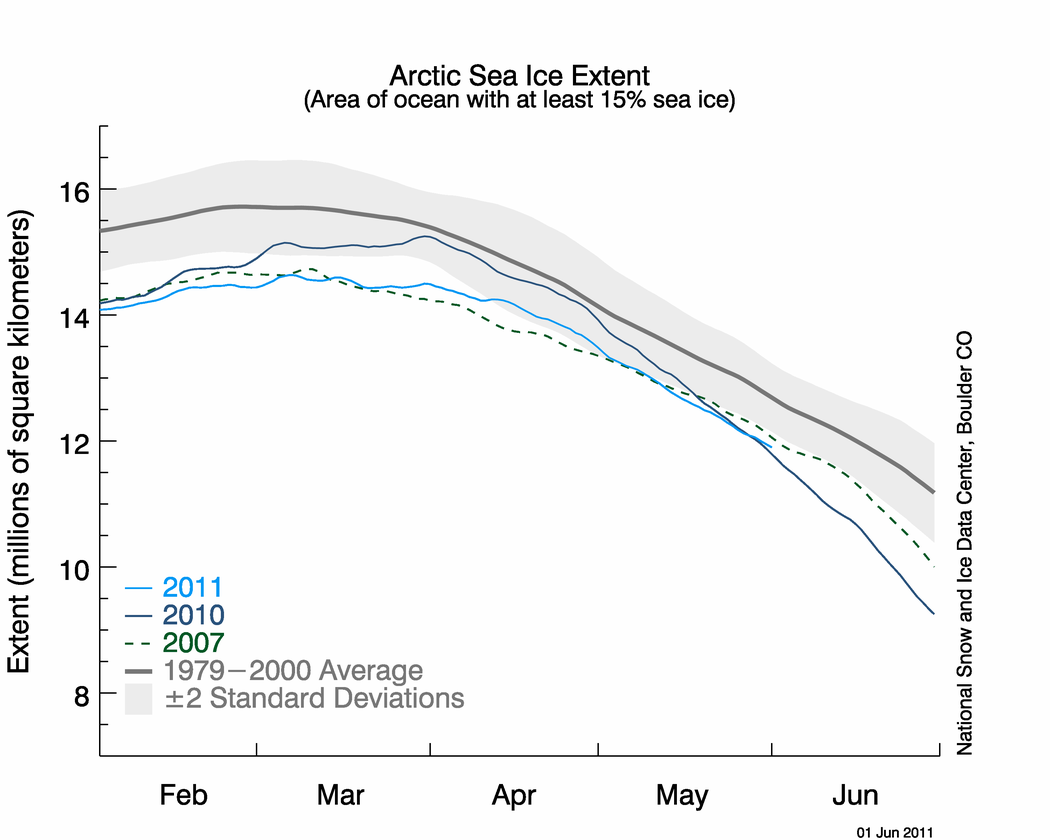
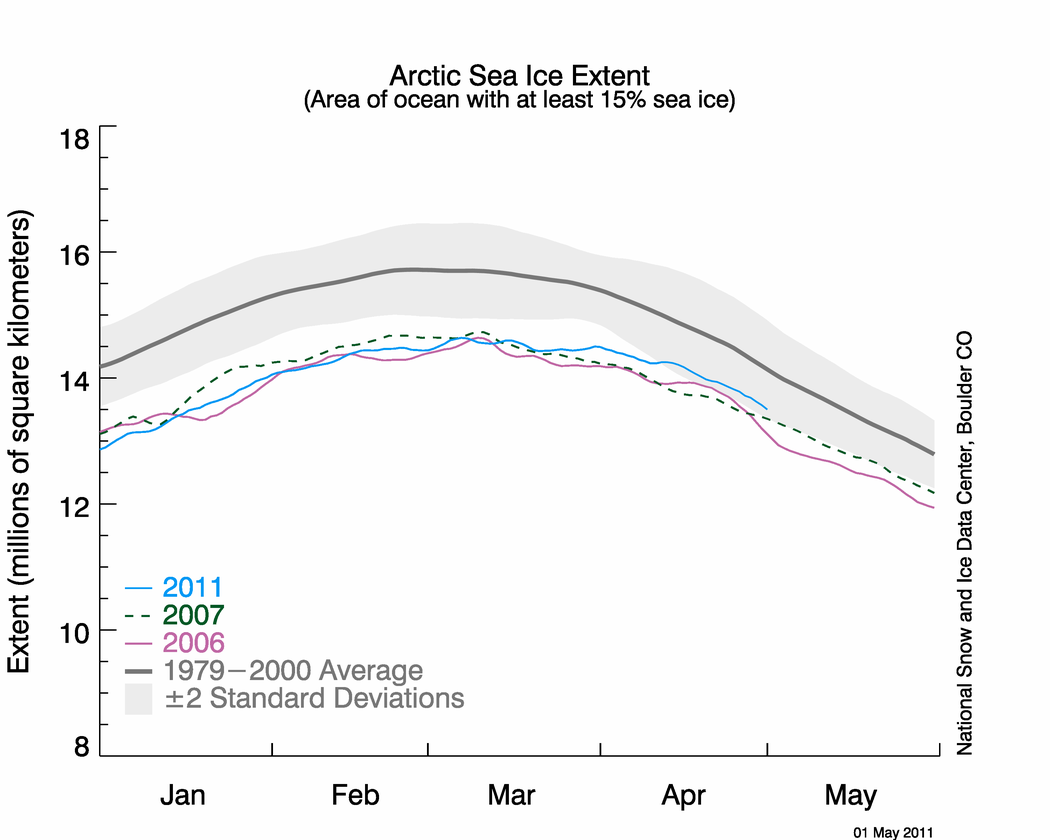
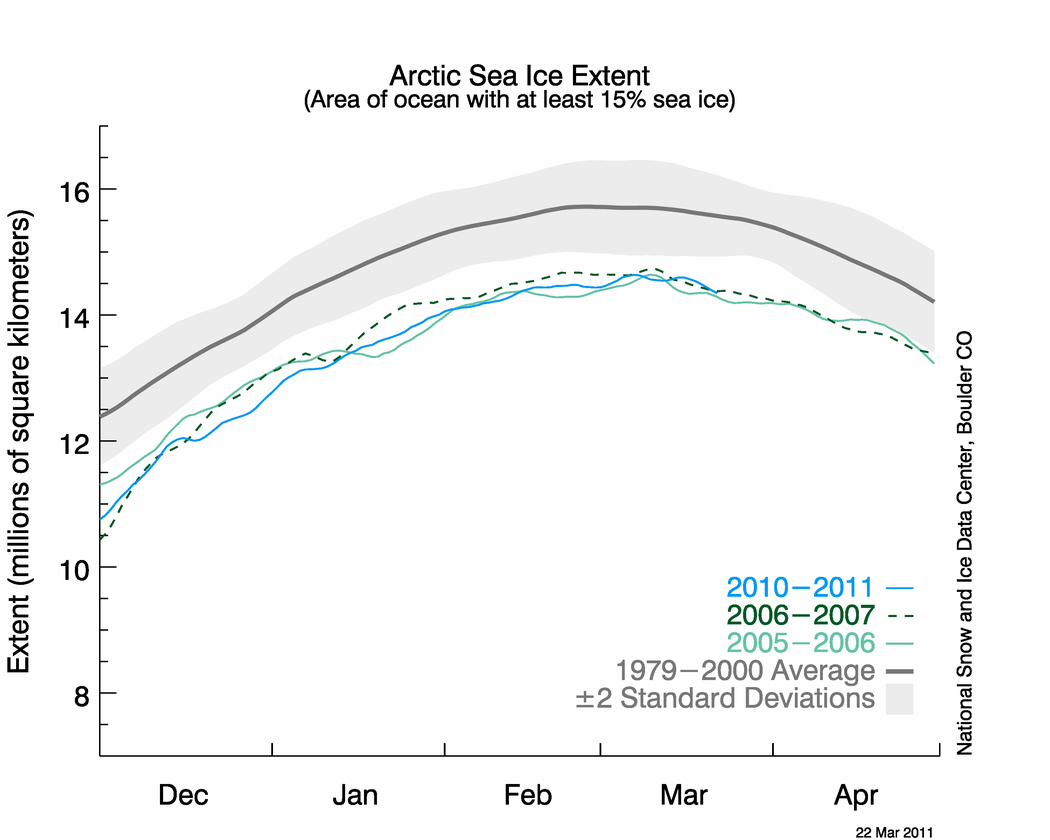
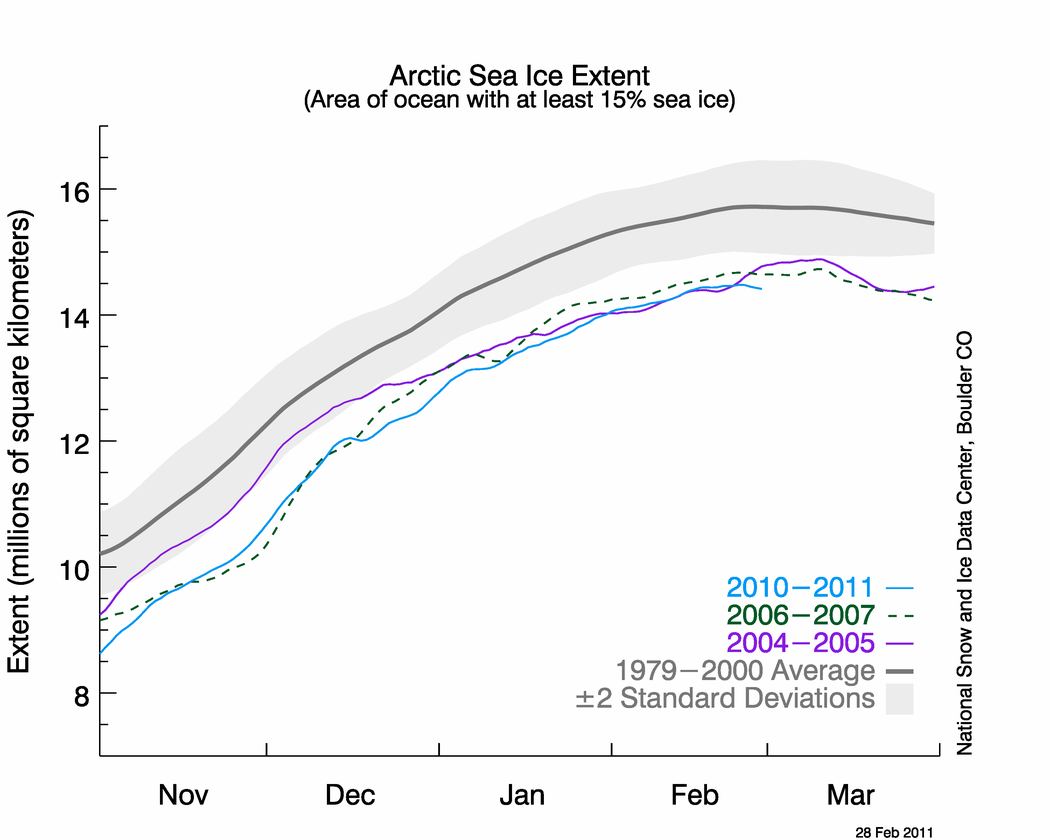
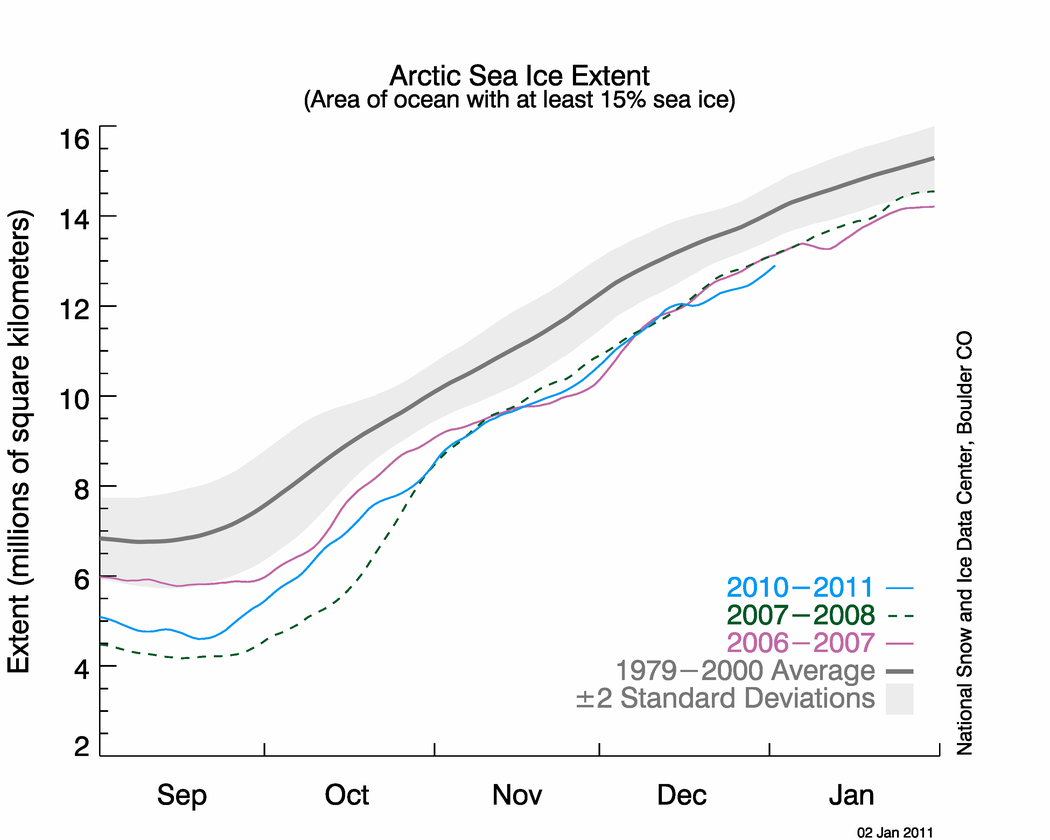
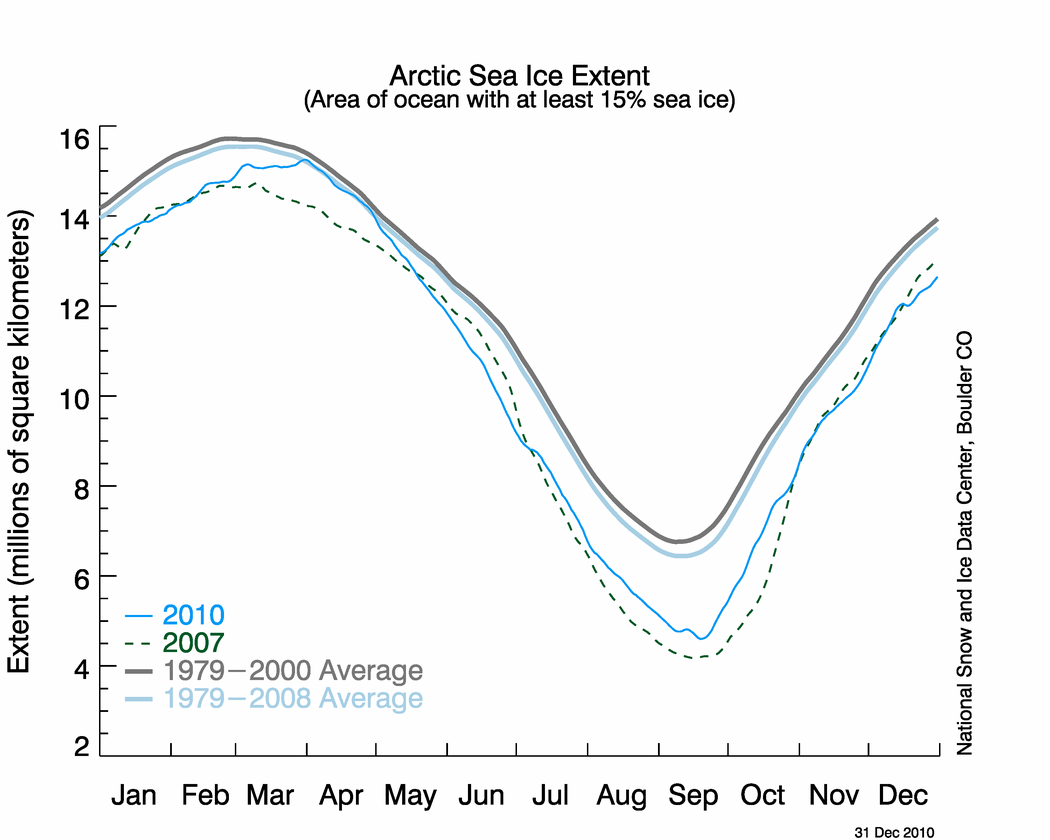
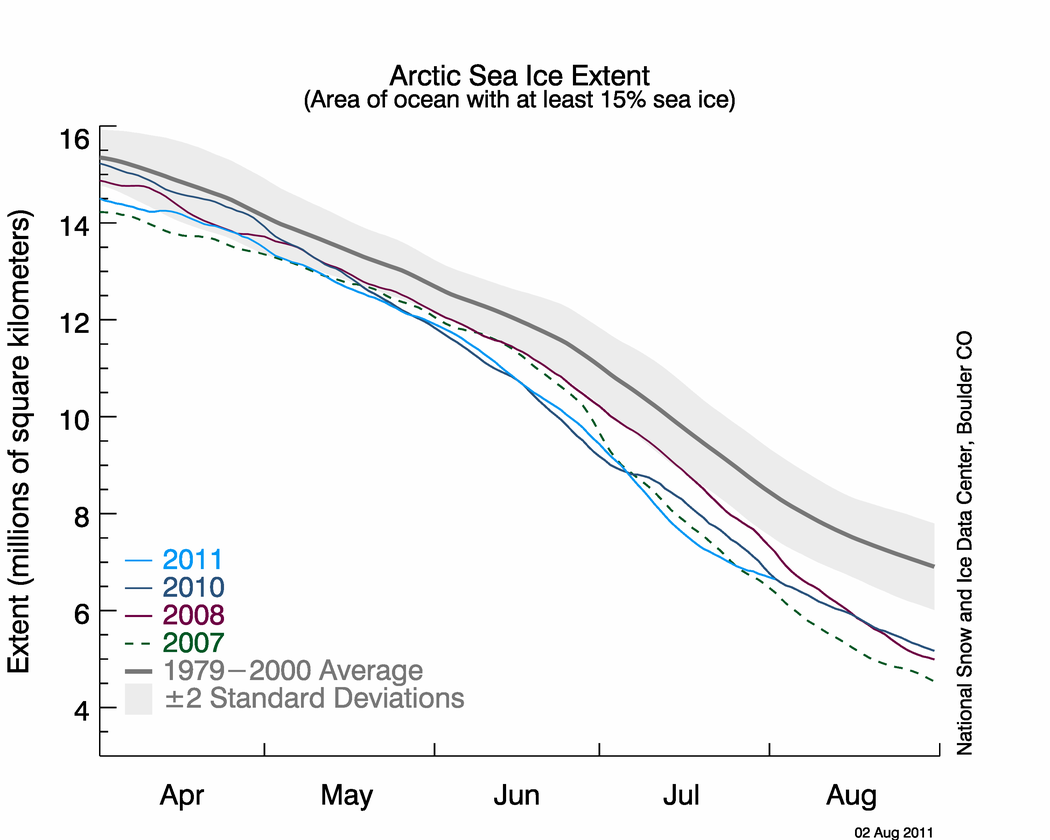 Figure 2. The graph above shows daily Arctic sea ice extent as of August 2, 2011, along with daily ice extents for previous low-ice-extent years. Light blue indicates 2011, dashed green shows 2007, dark blue shows 2010, purple shows 2008, and dark gray shows the 1979 to 2000 average. The gray area around the average line shows the two standard deviation range of the data. Sea Ice Index data.—Credit: National Snow and Ice Data Center
High-resolution image
Conditions in context
During the first half of July, Arctic sea ice extent declined at a relatively fast pace (see July 18 post). But ice loss slowed substantially over the latter half of the month as the weather changed.
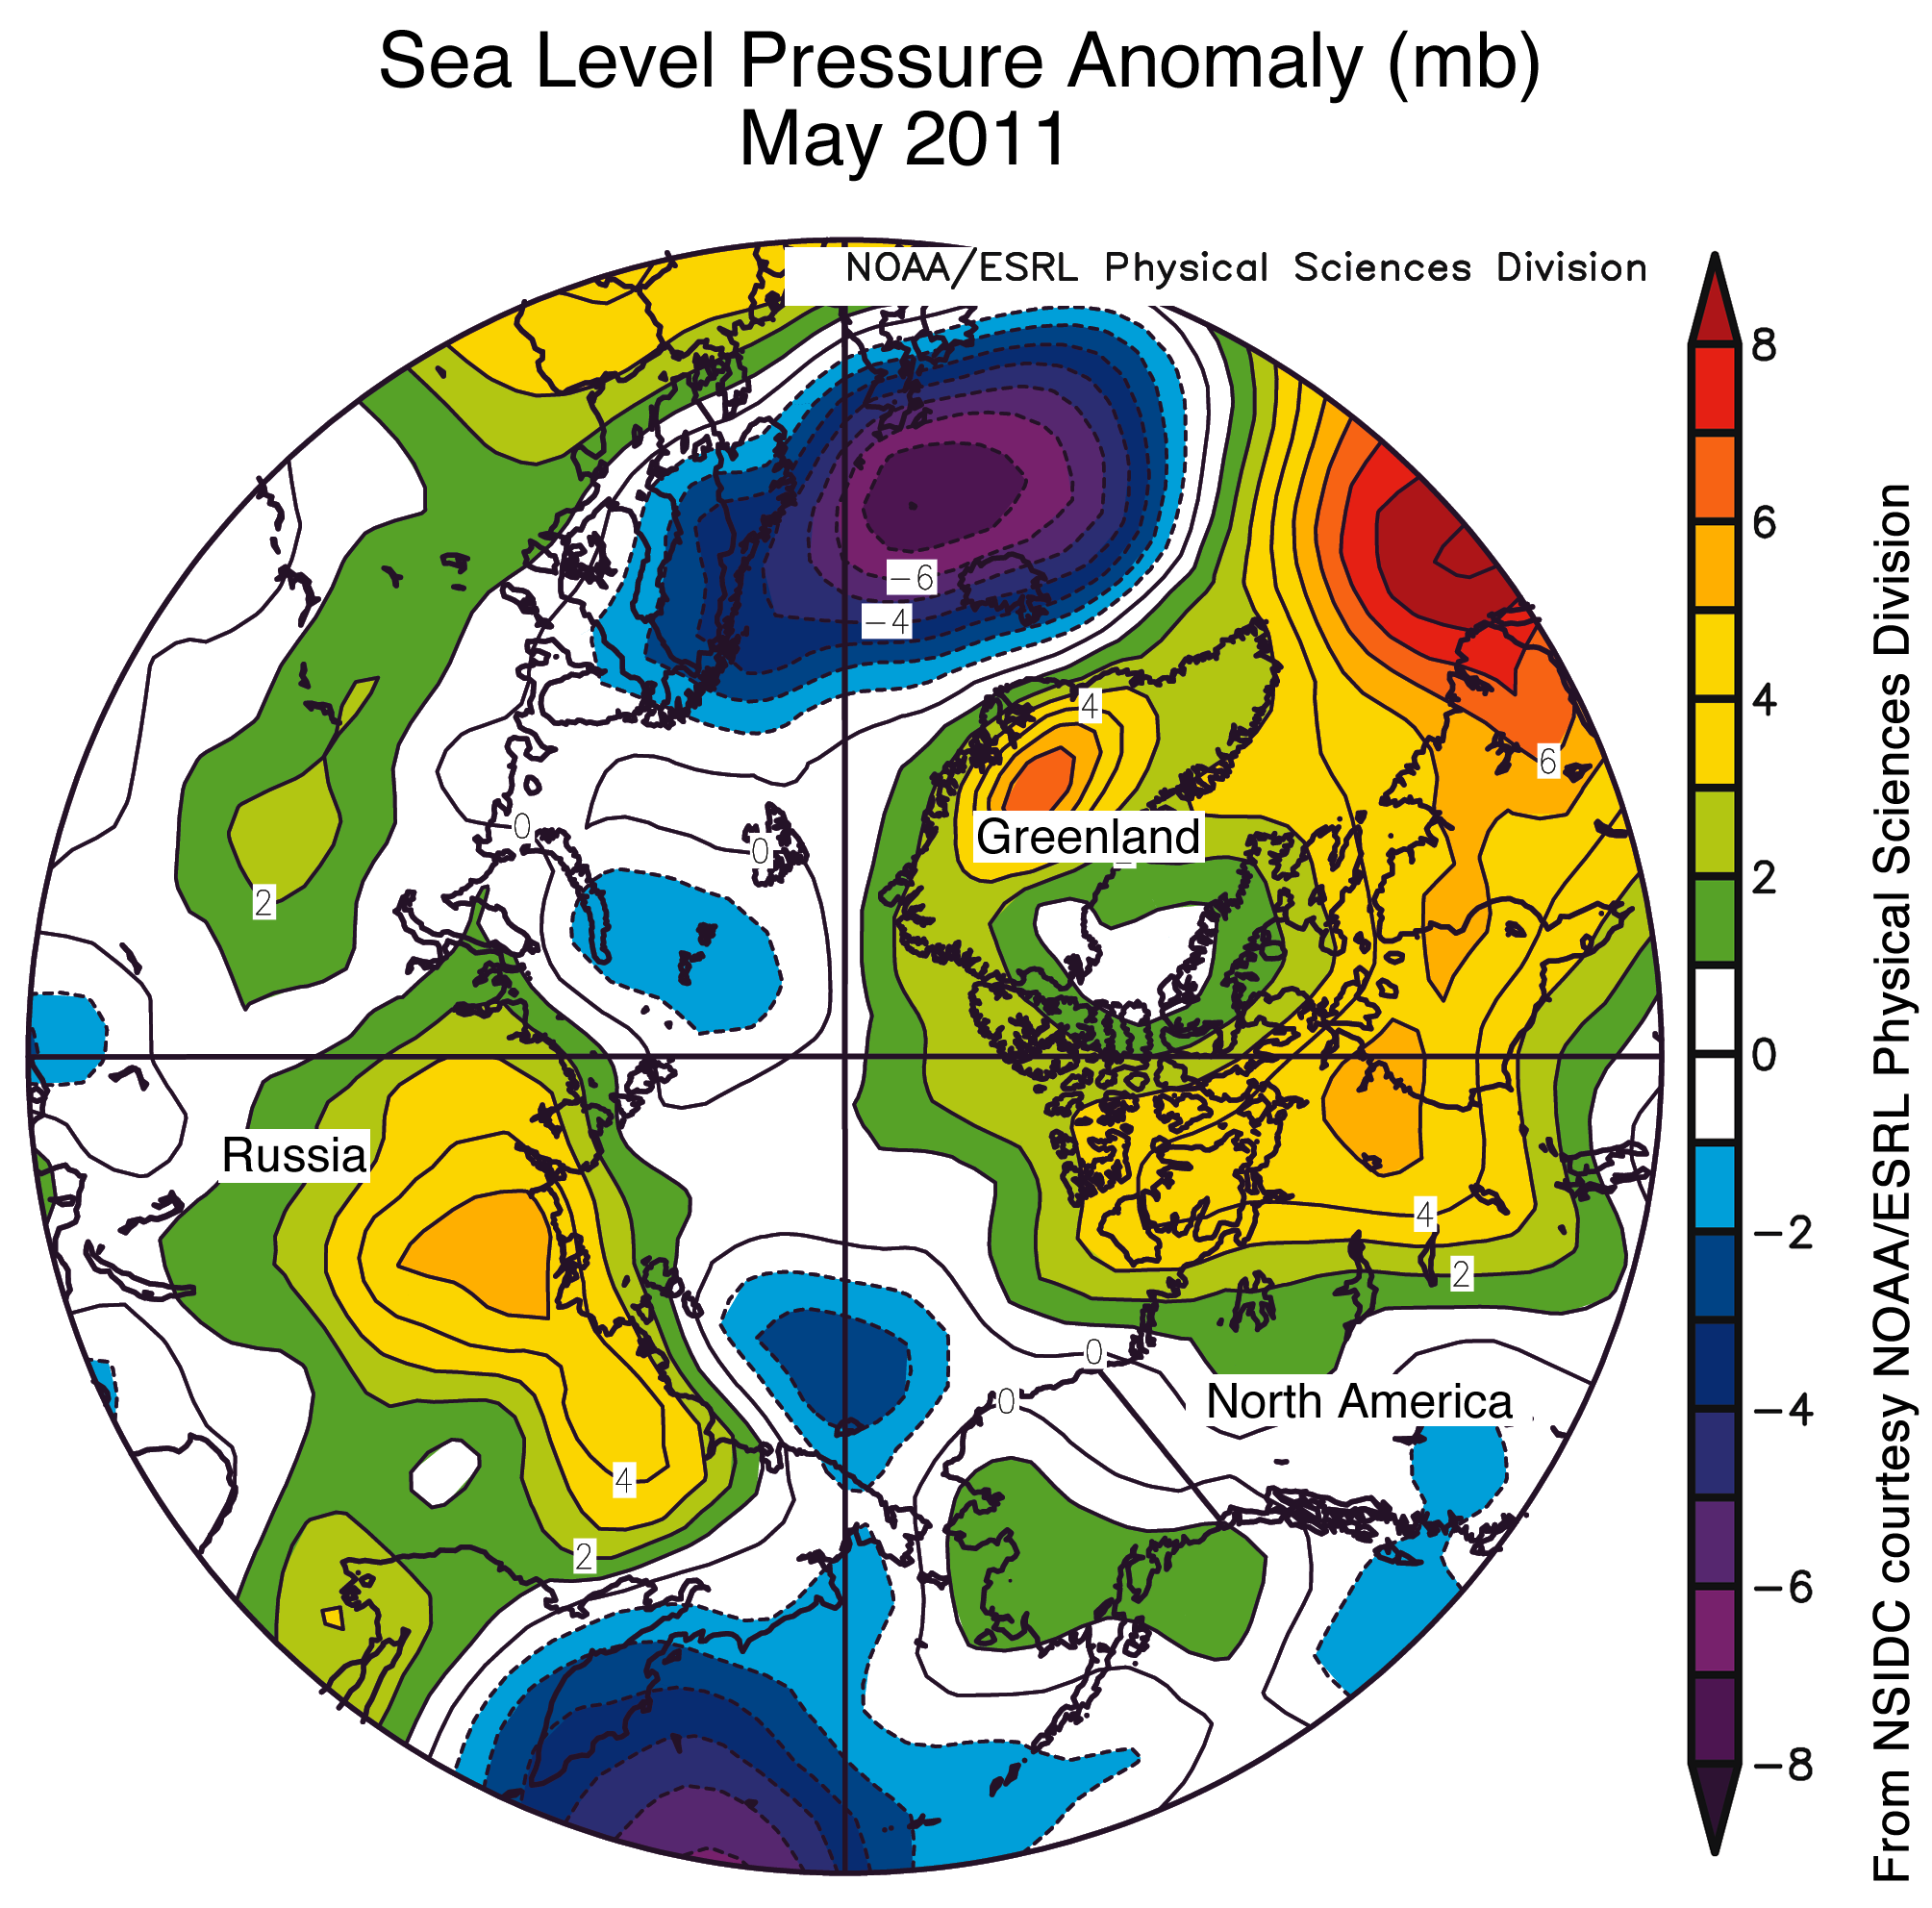
Through July, sea ice declined at an average pace of 90,200 square kilometers (34,800 square miles) per day, which is slightly faster than the average for 1979 to 2000 of 84,400 square kilometers (32,600 square miles) per day. Ice loss slowed towards the end of July as a high-pressure cell centered over the northern Beaufort Sea broke down and a series of low-pressure systems moved over the central Arctic Ocean. This change brought cooler conditions and likely pushed the ice apart into a thinner but more extensive ice cover.
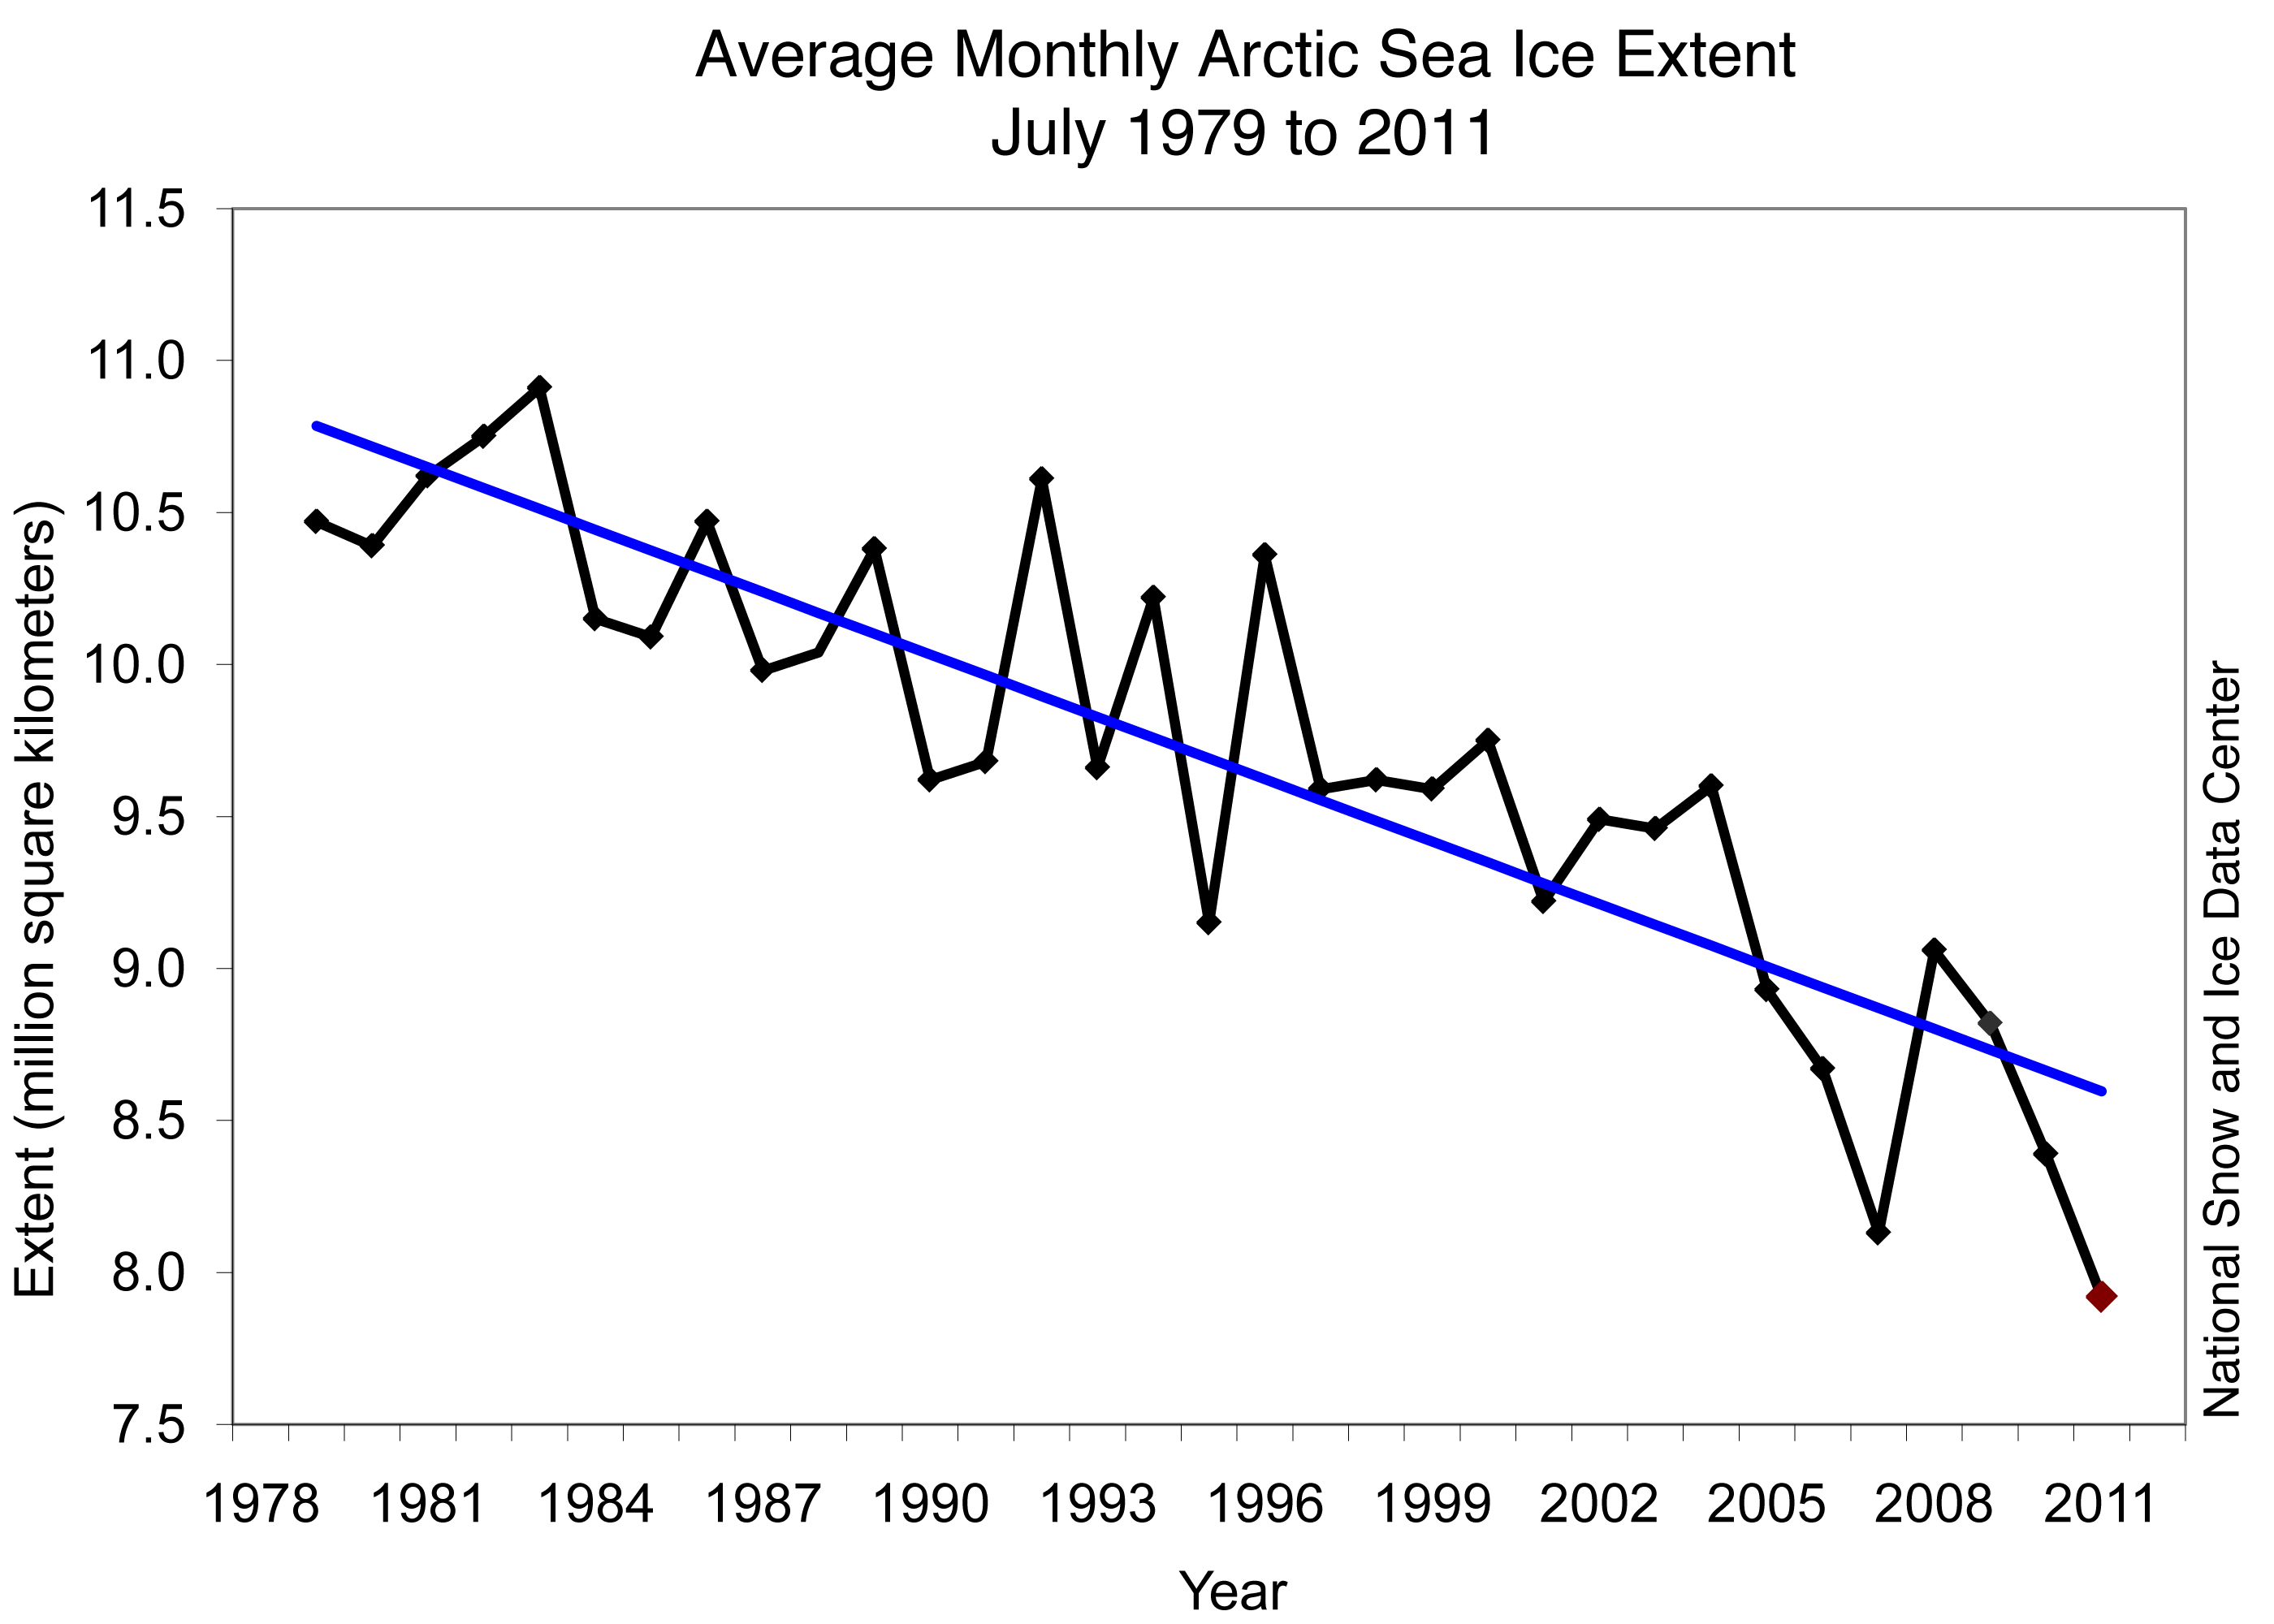
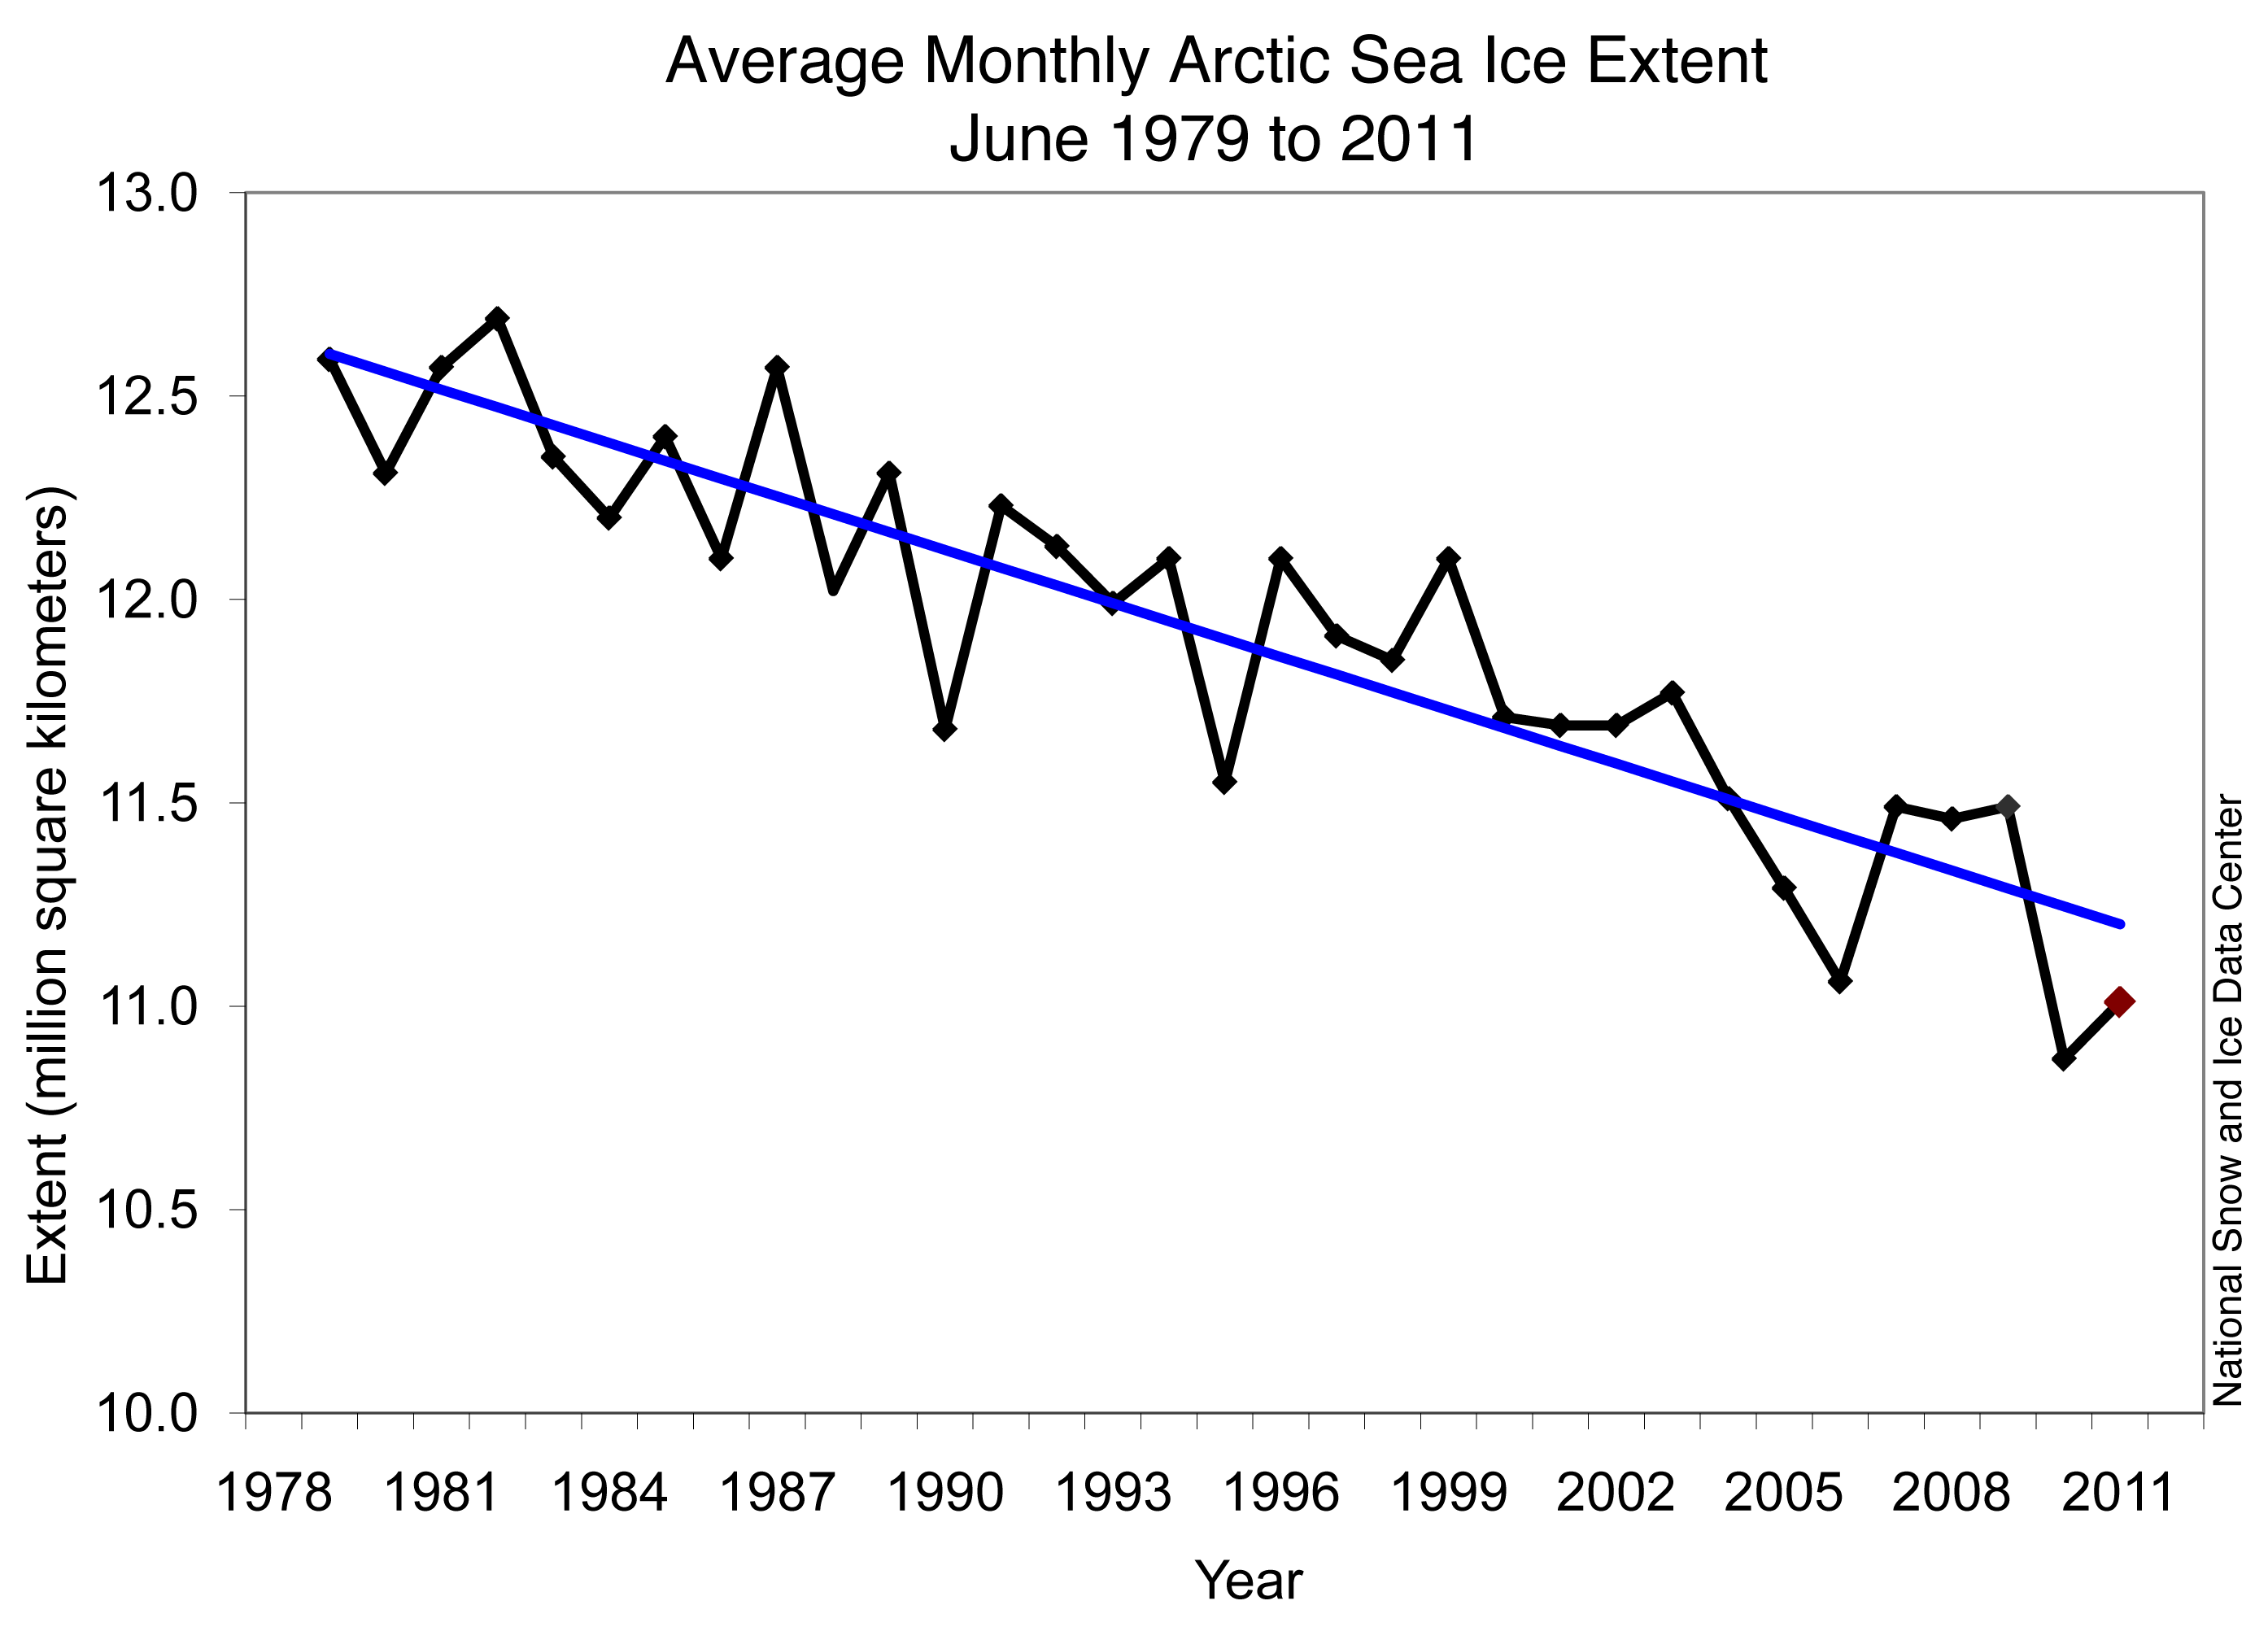
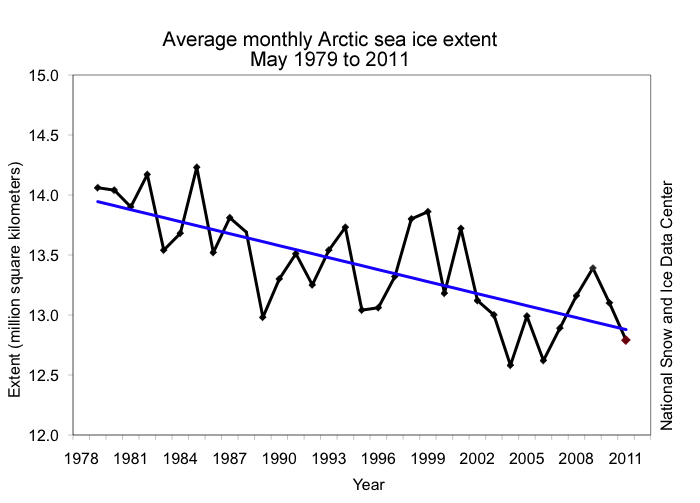
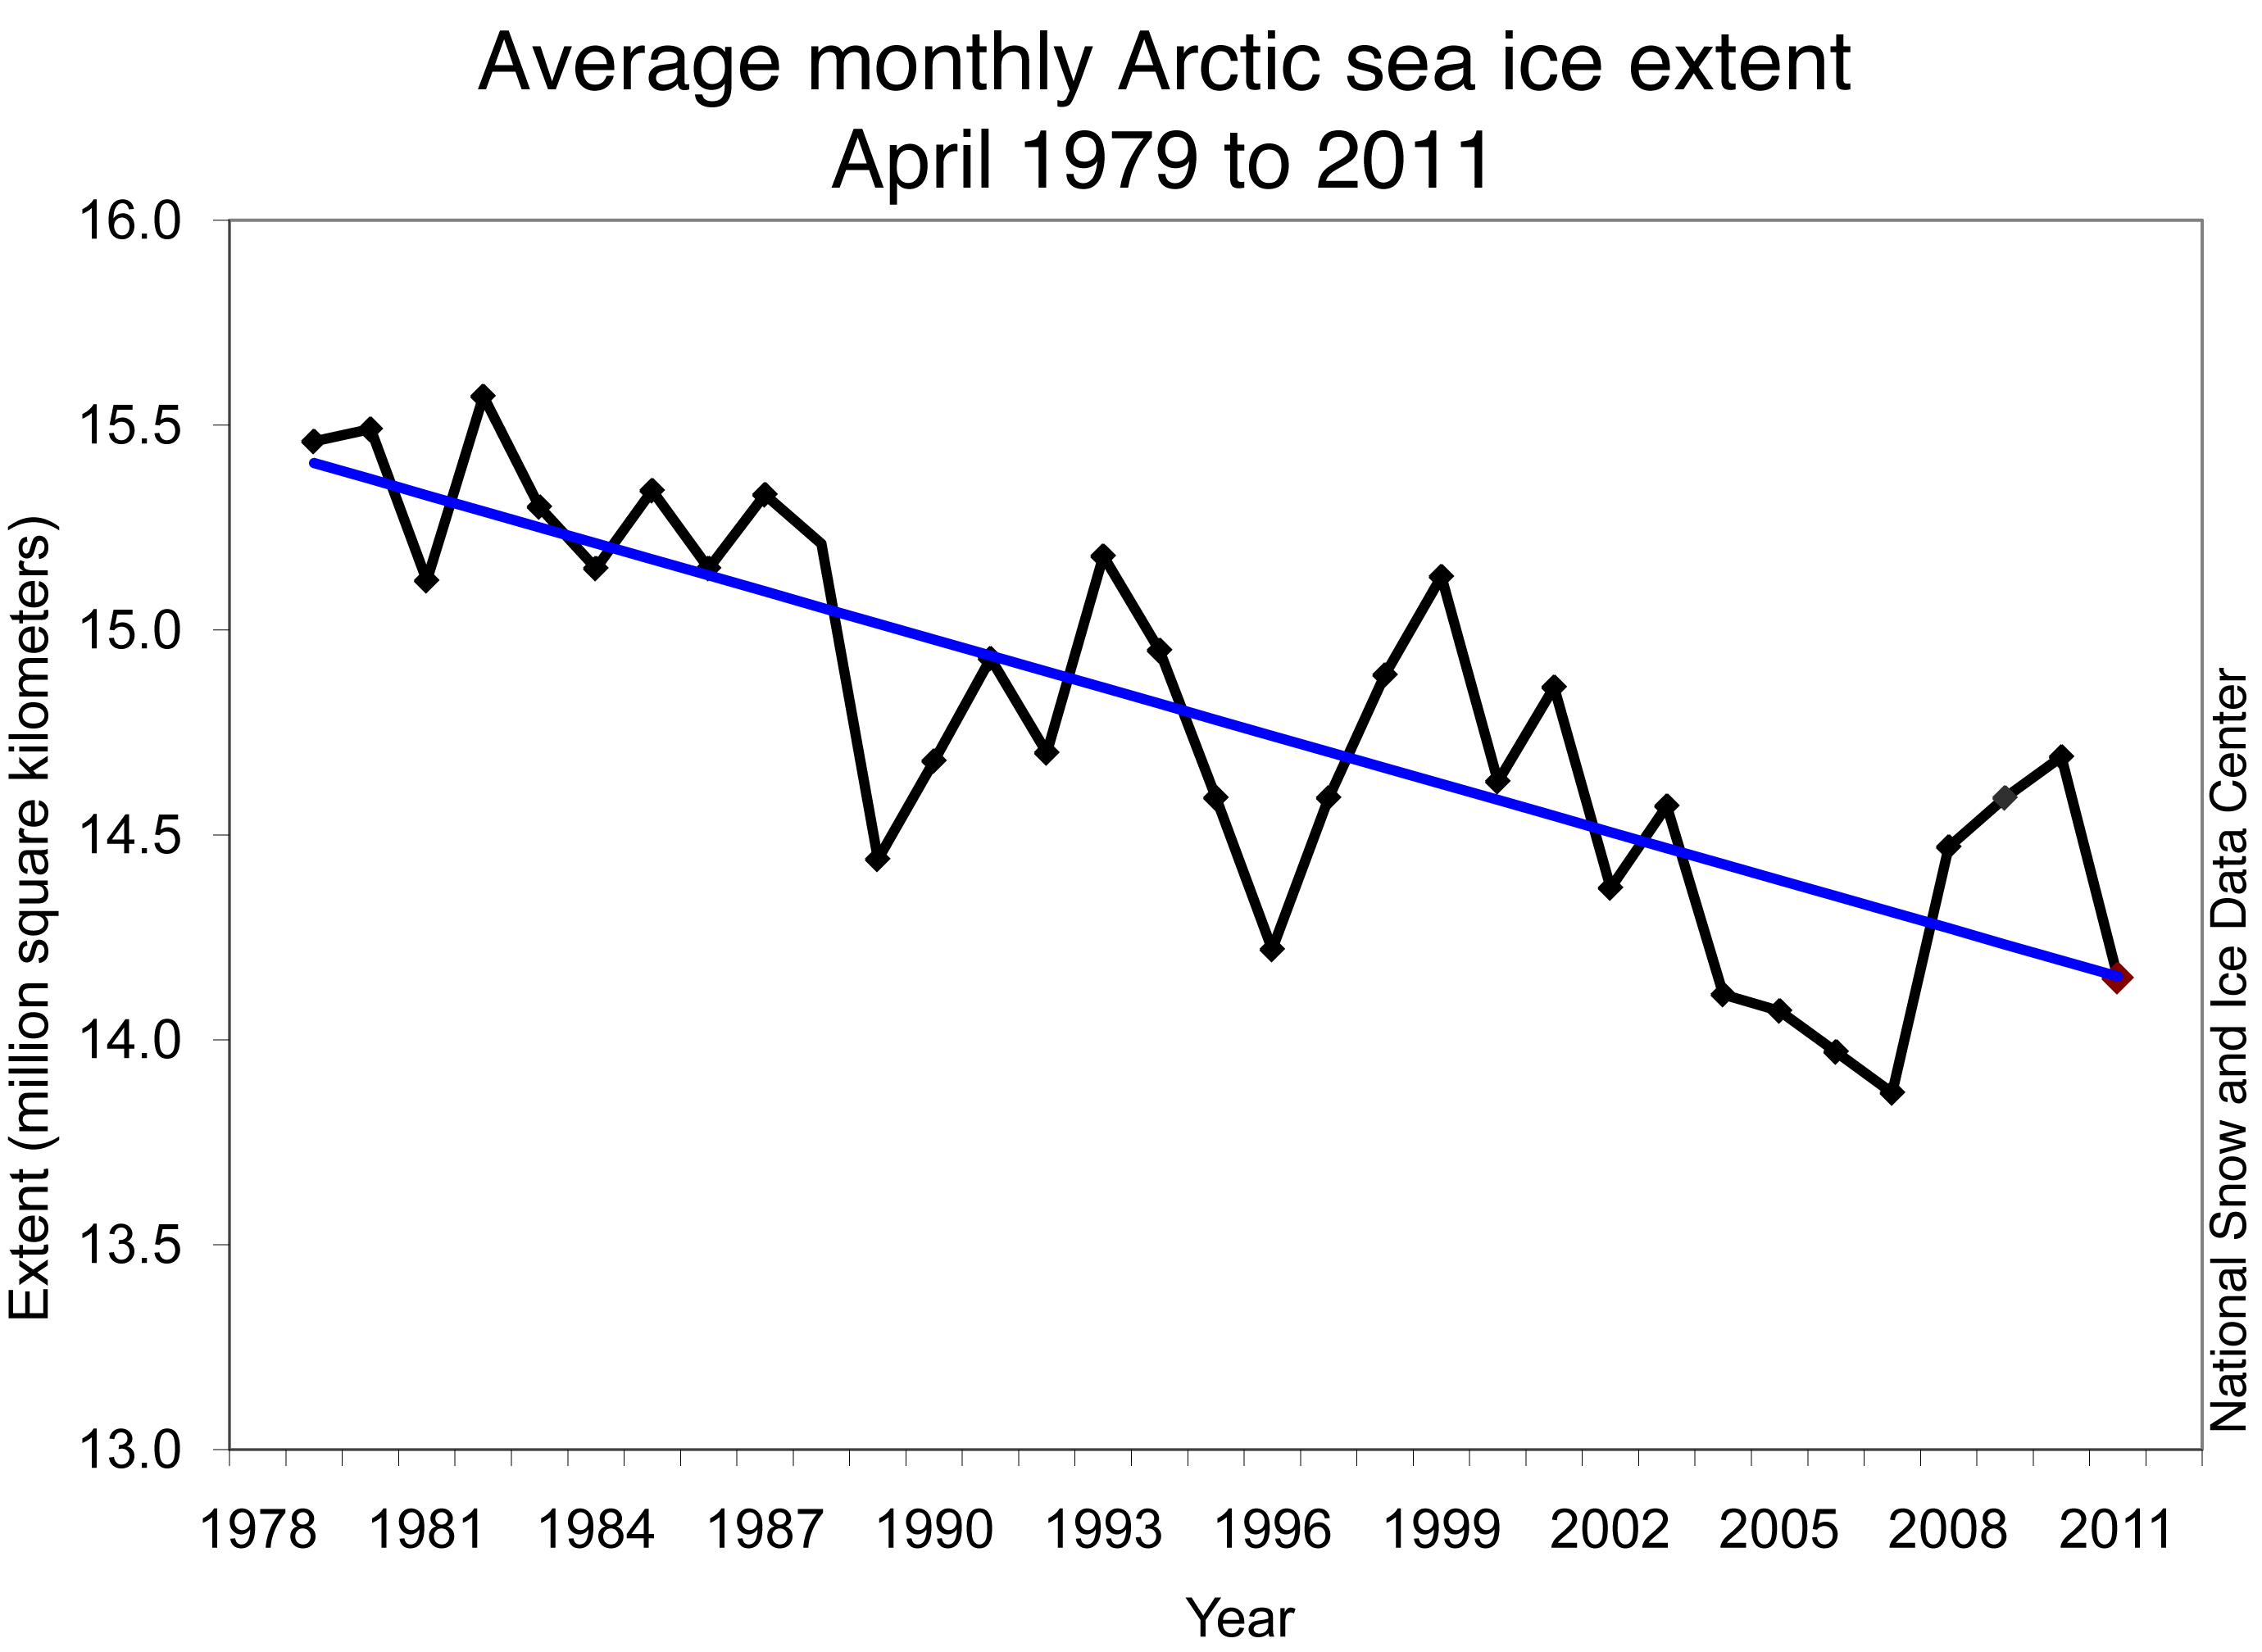
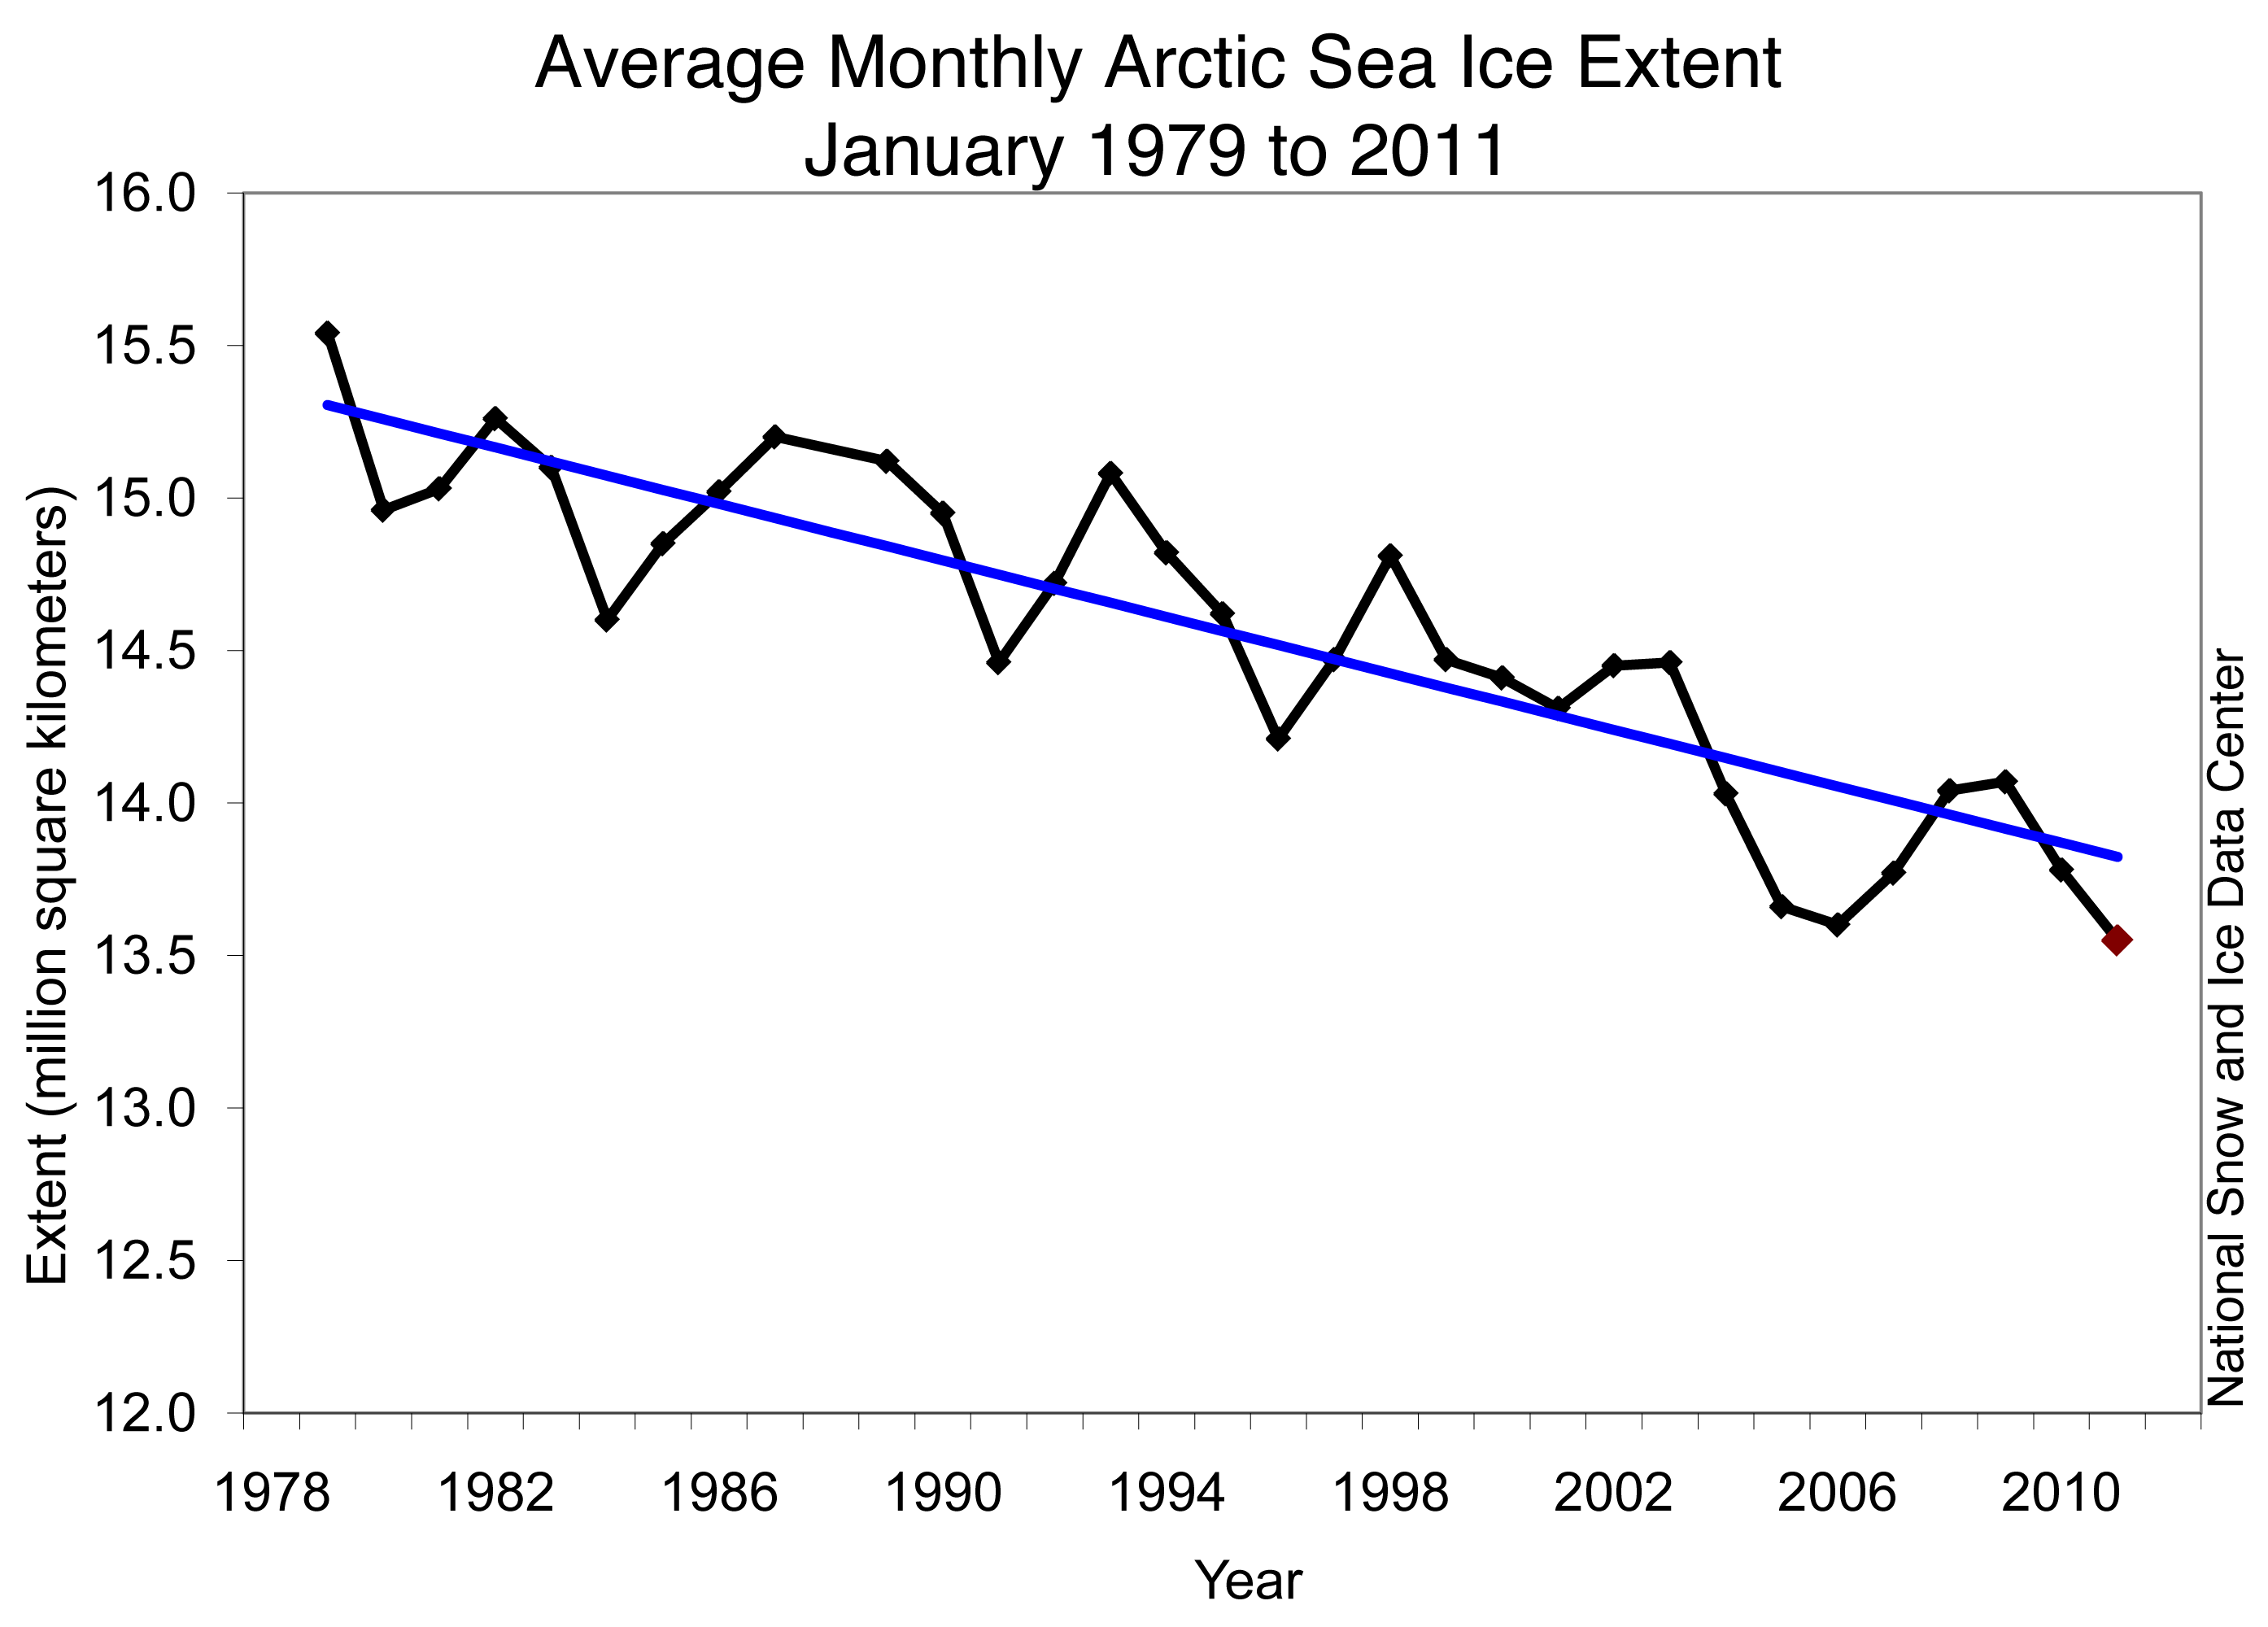
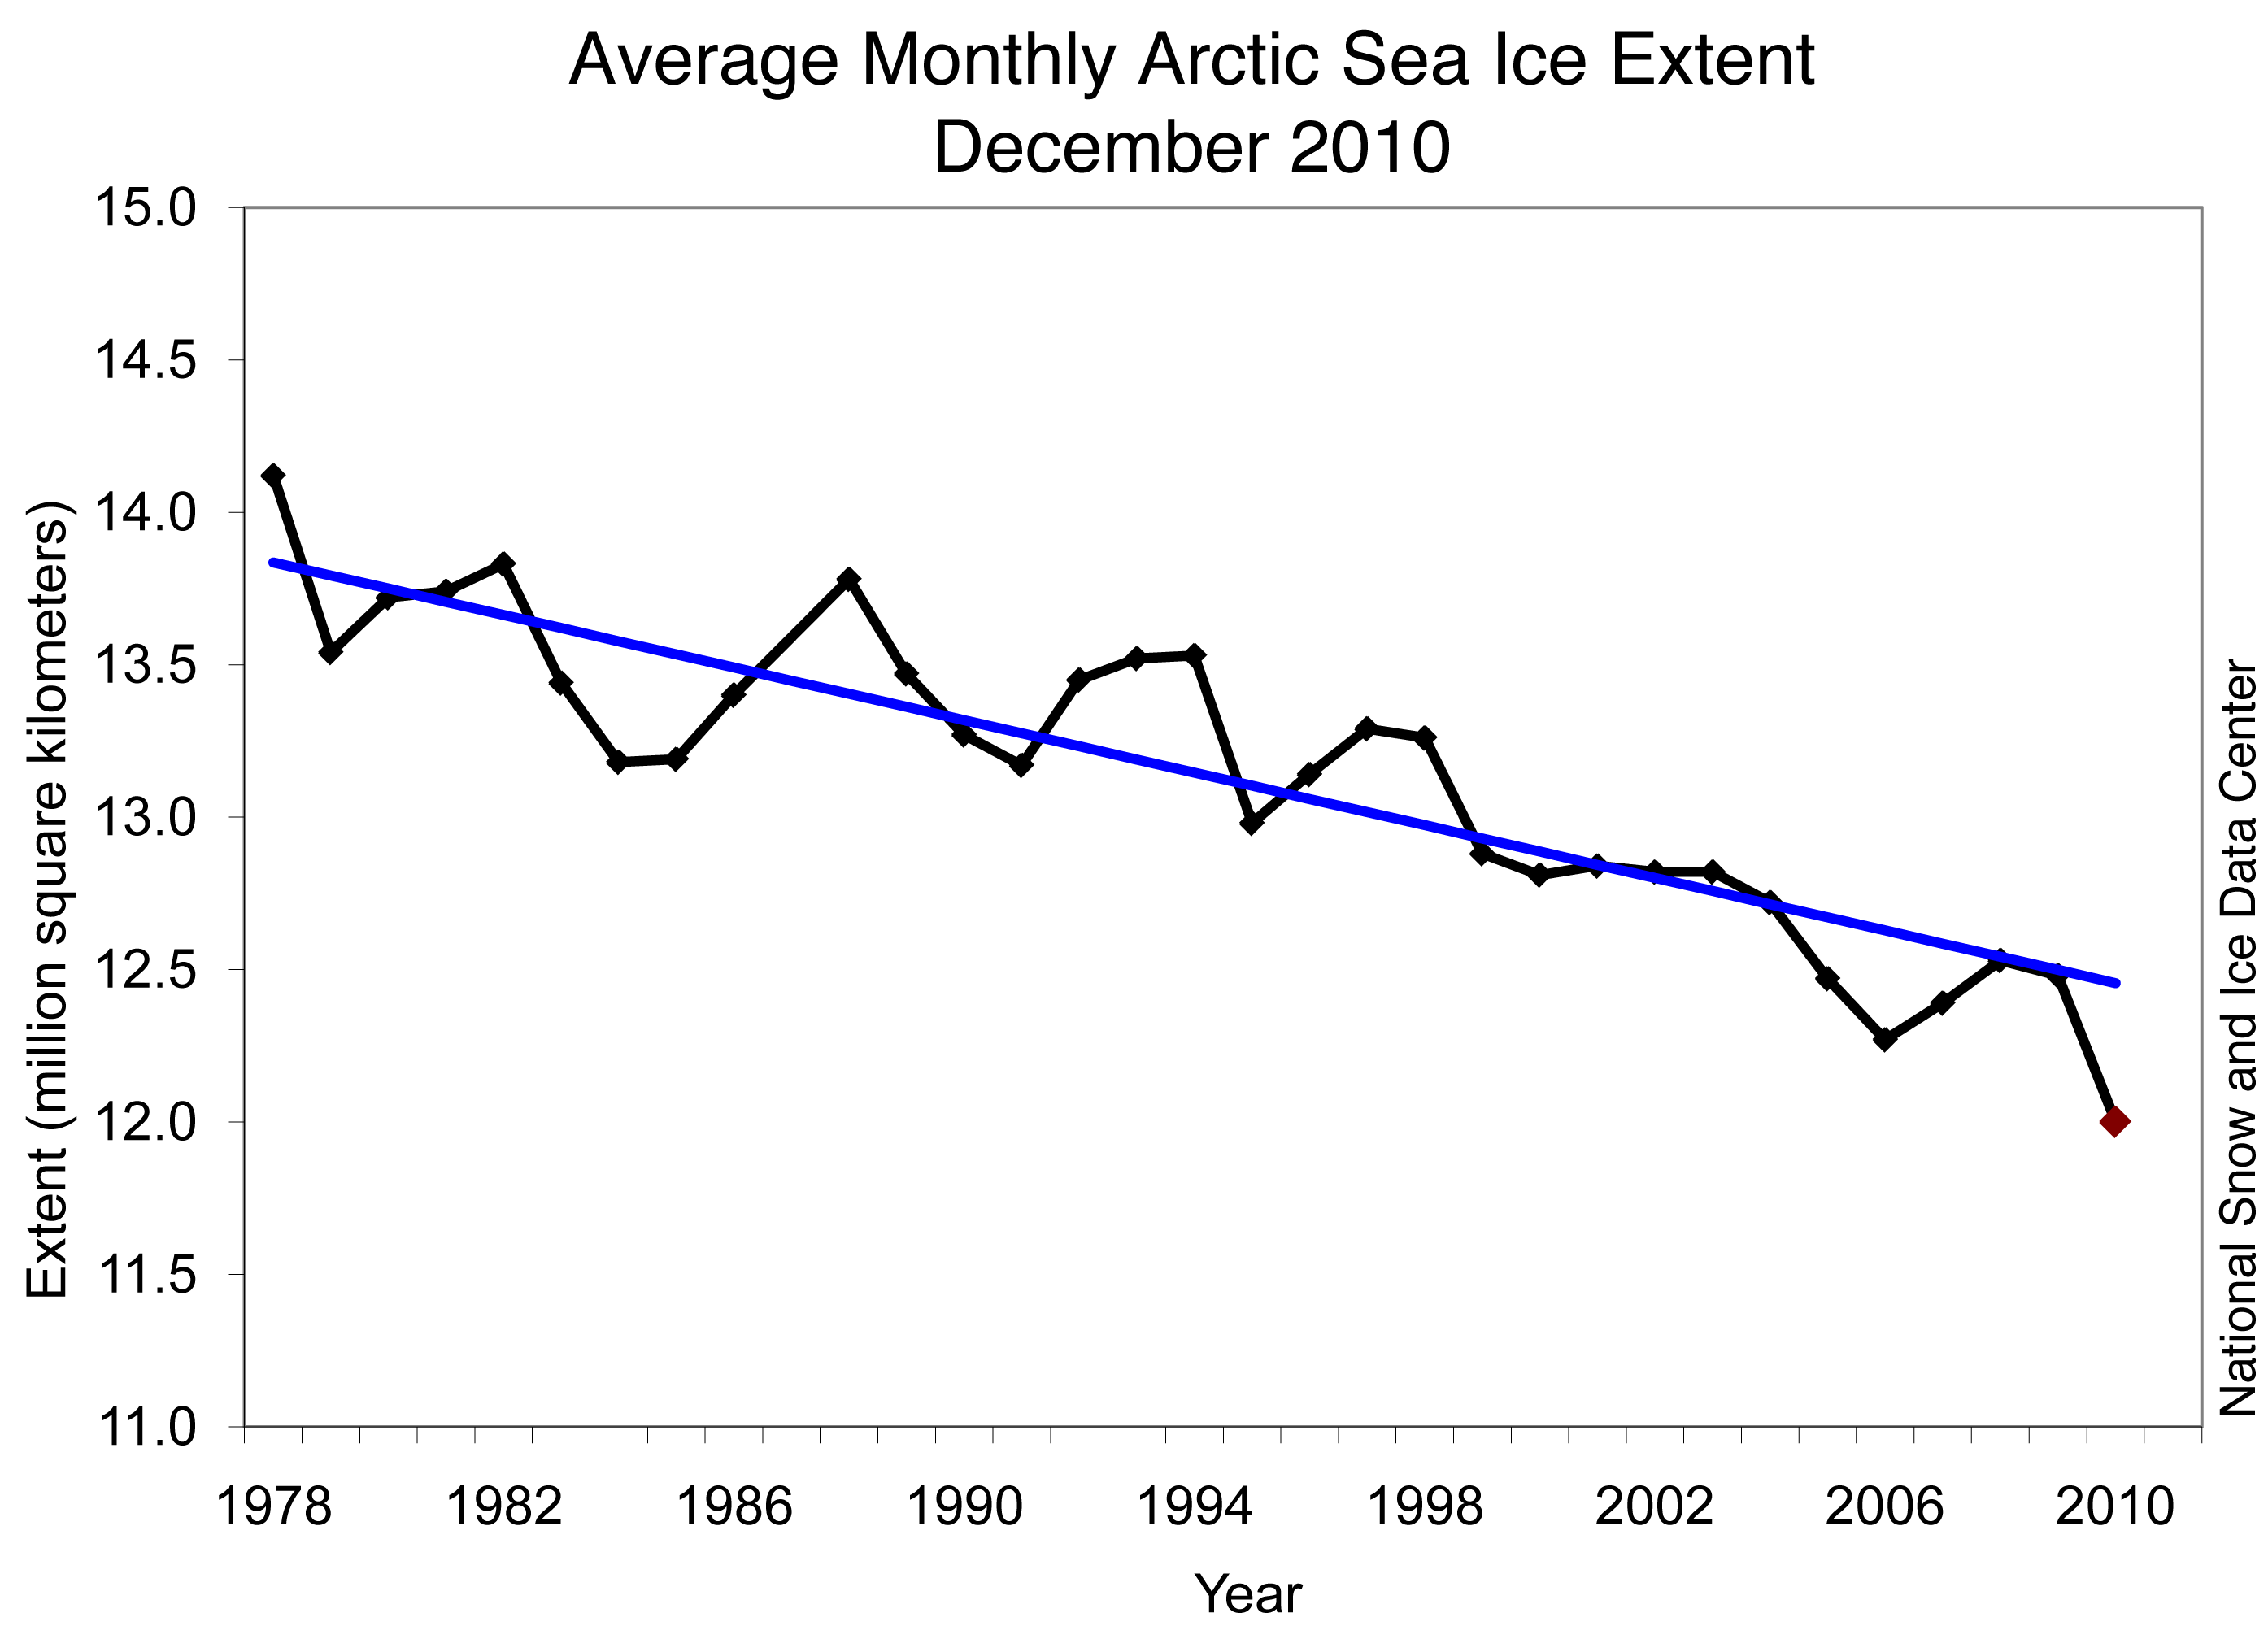
Figure 3. Monthly July ice extent for 1979 to 2011 shows a decline of 6.8% per decade. —Credit: National Snow and Ice Data Center
High-resolution image
July 2011 compared to previous years
Average Arctic sea ice extent for July 2011 was the lowest for July in the satellite data record. The previous lowest year for July was 2007, which went on to break the record for the lowest ice extent at the end of the melt season. Including 2011 the linear trend for July now stands at -6.8% per decade.
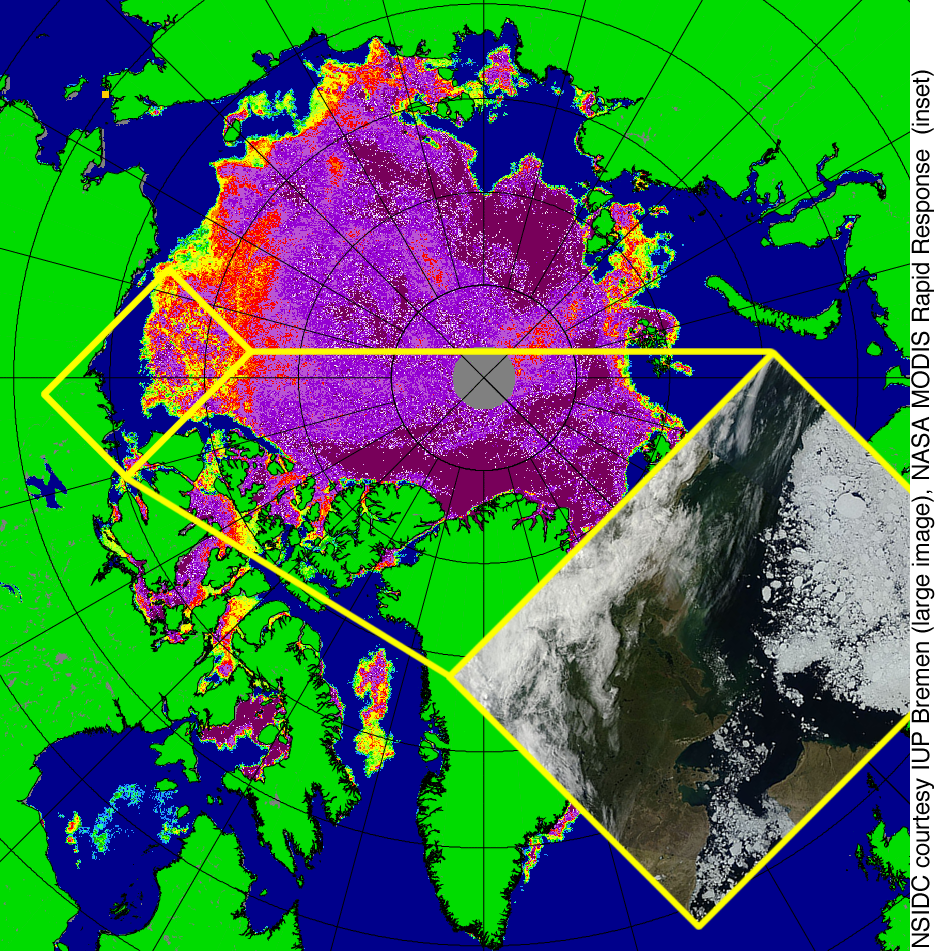
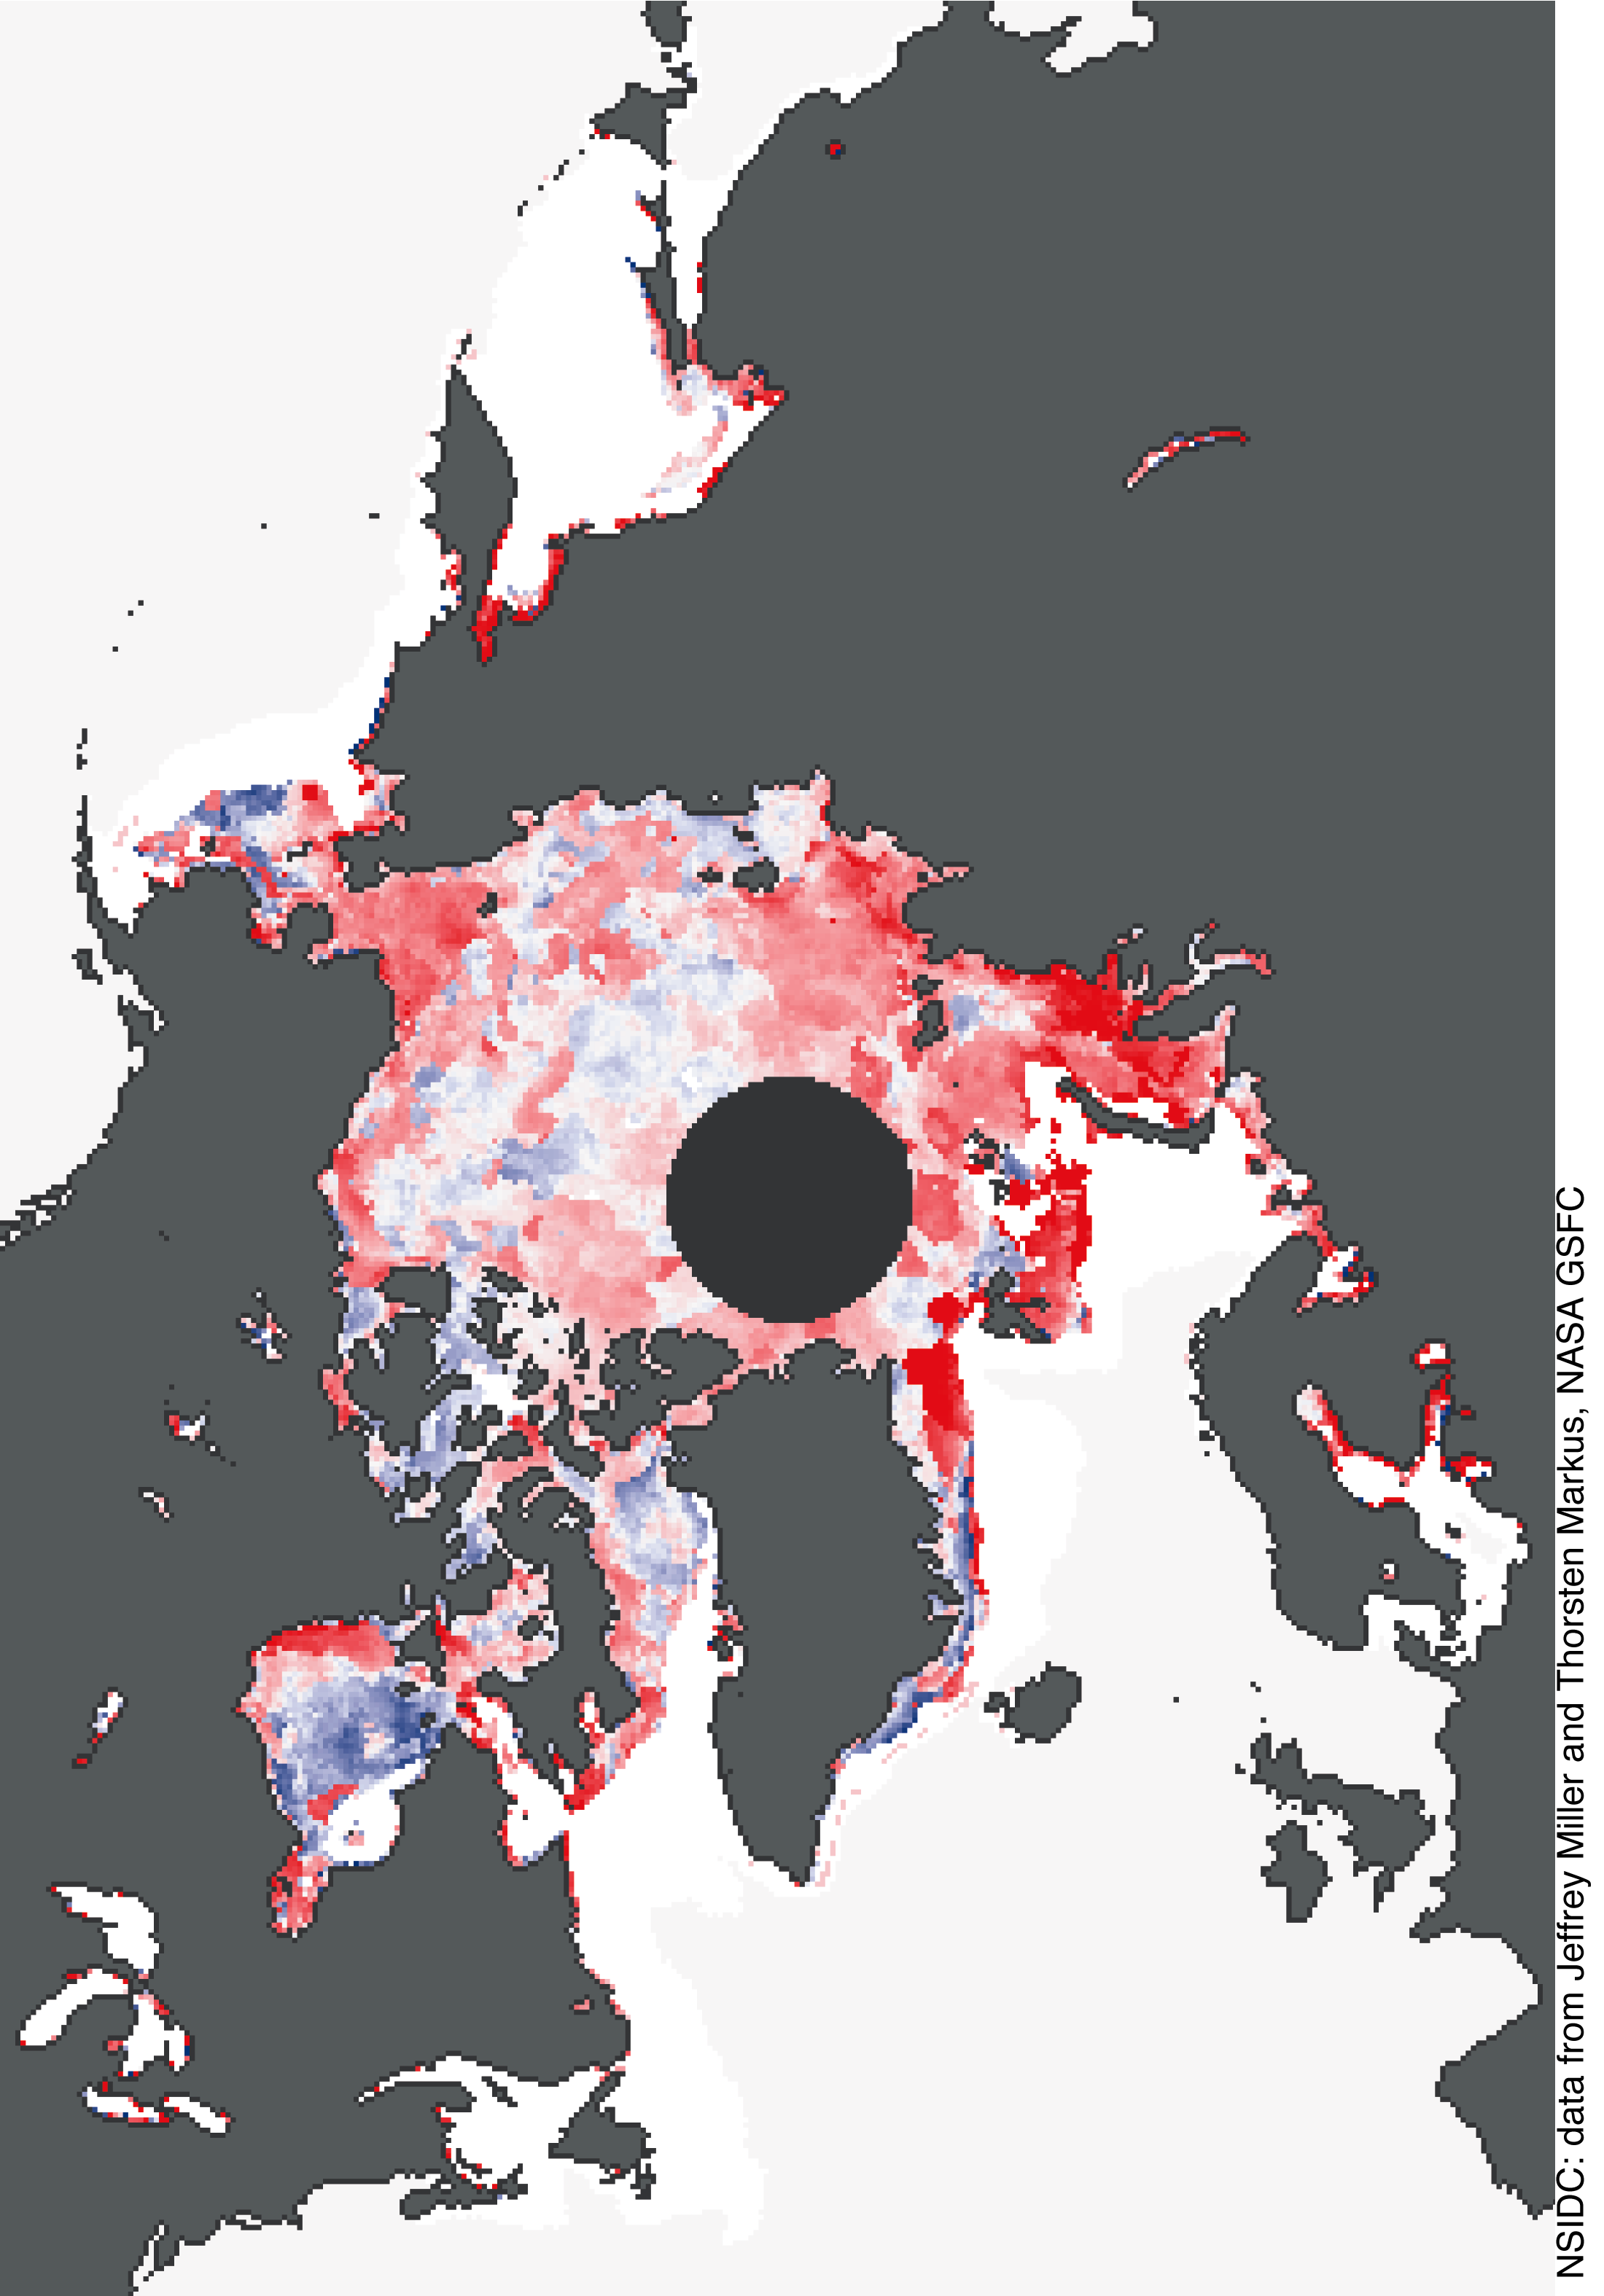
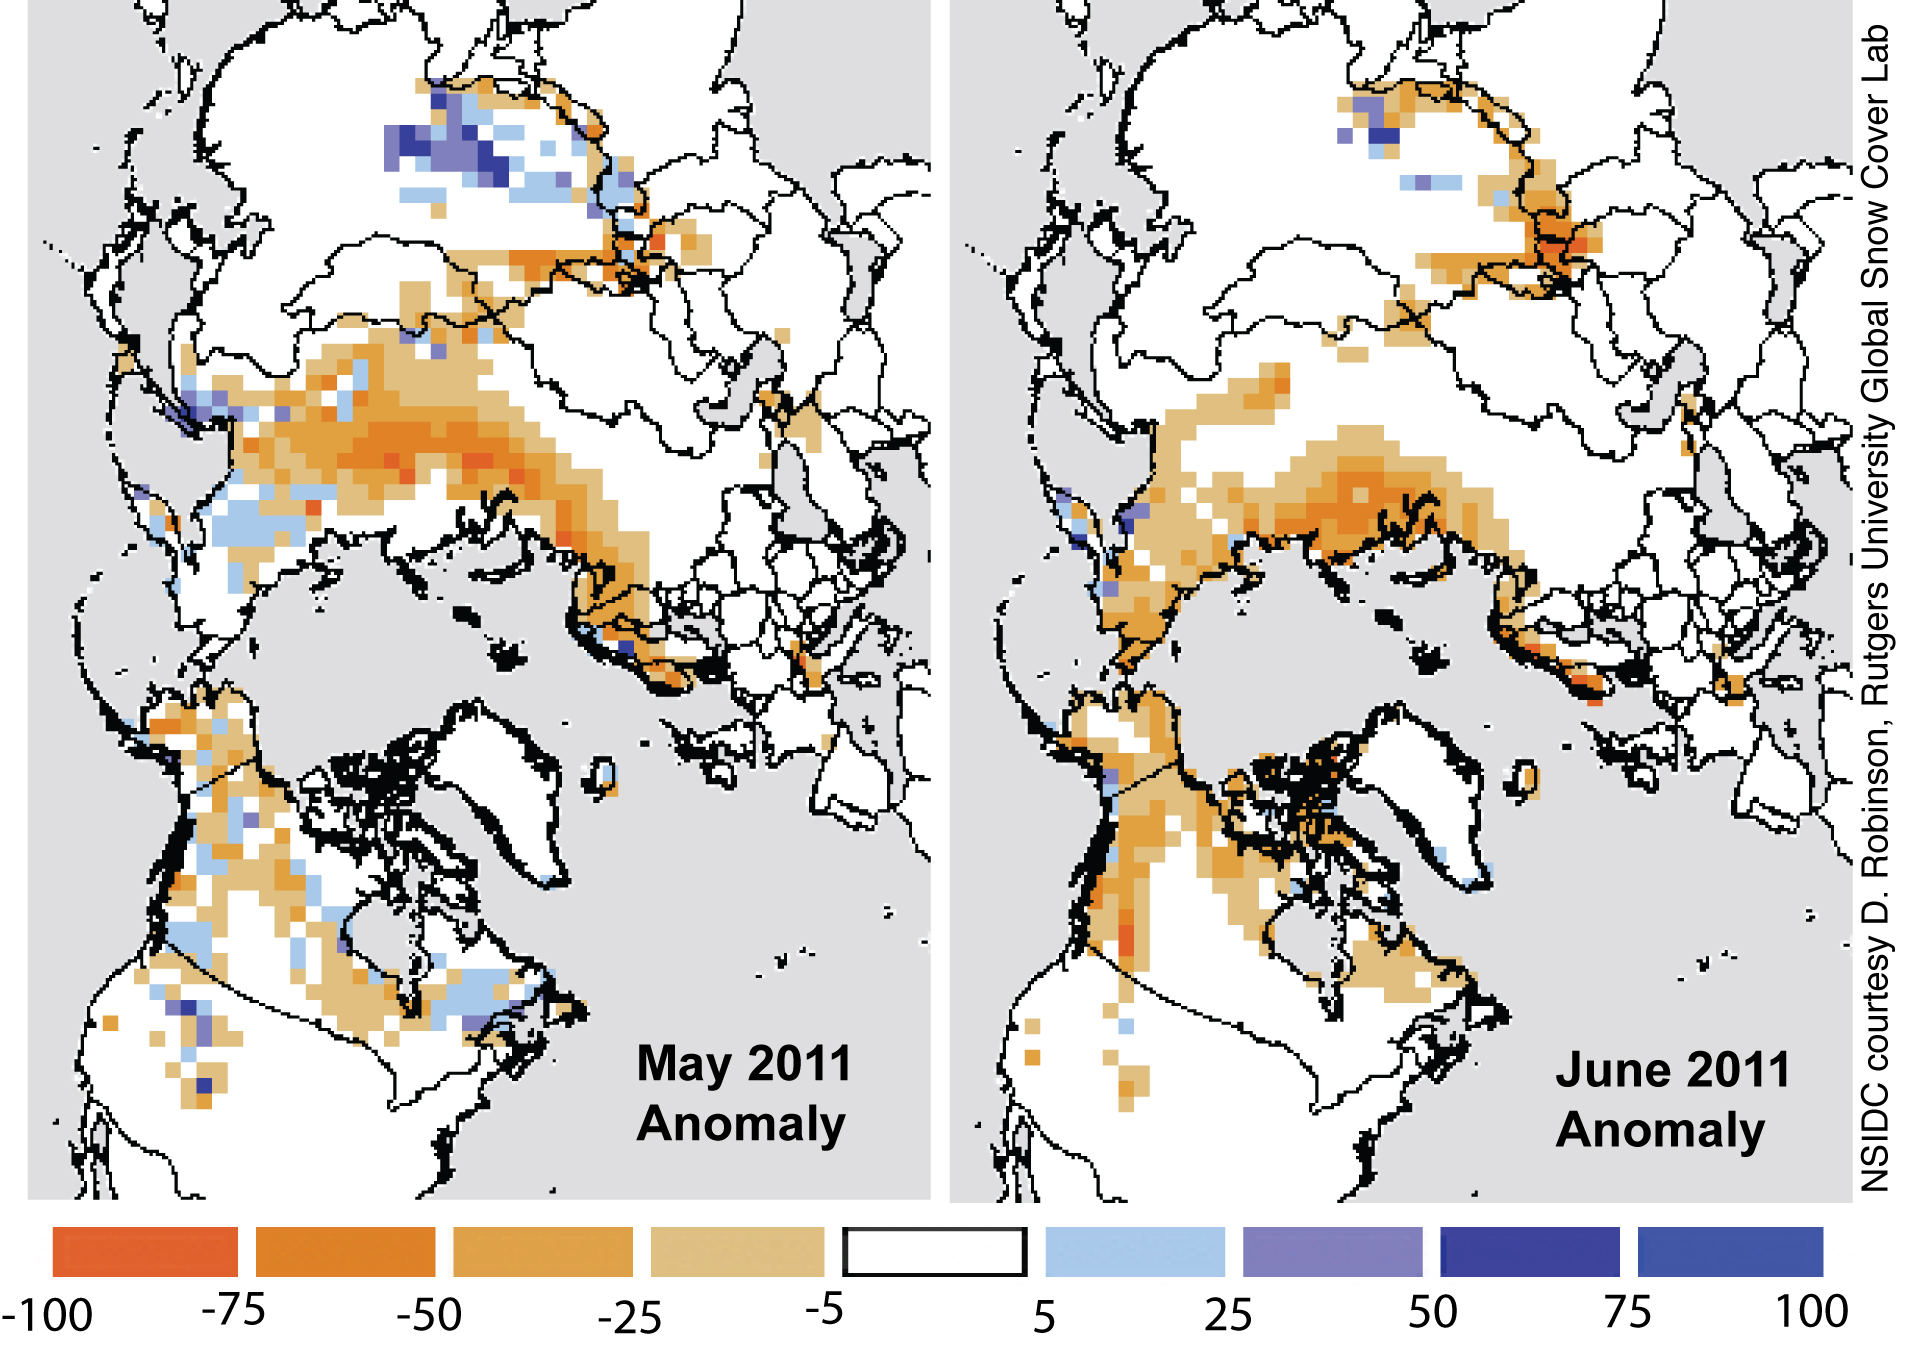
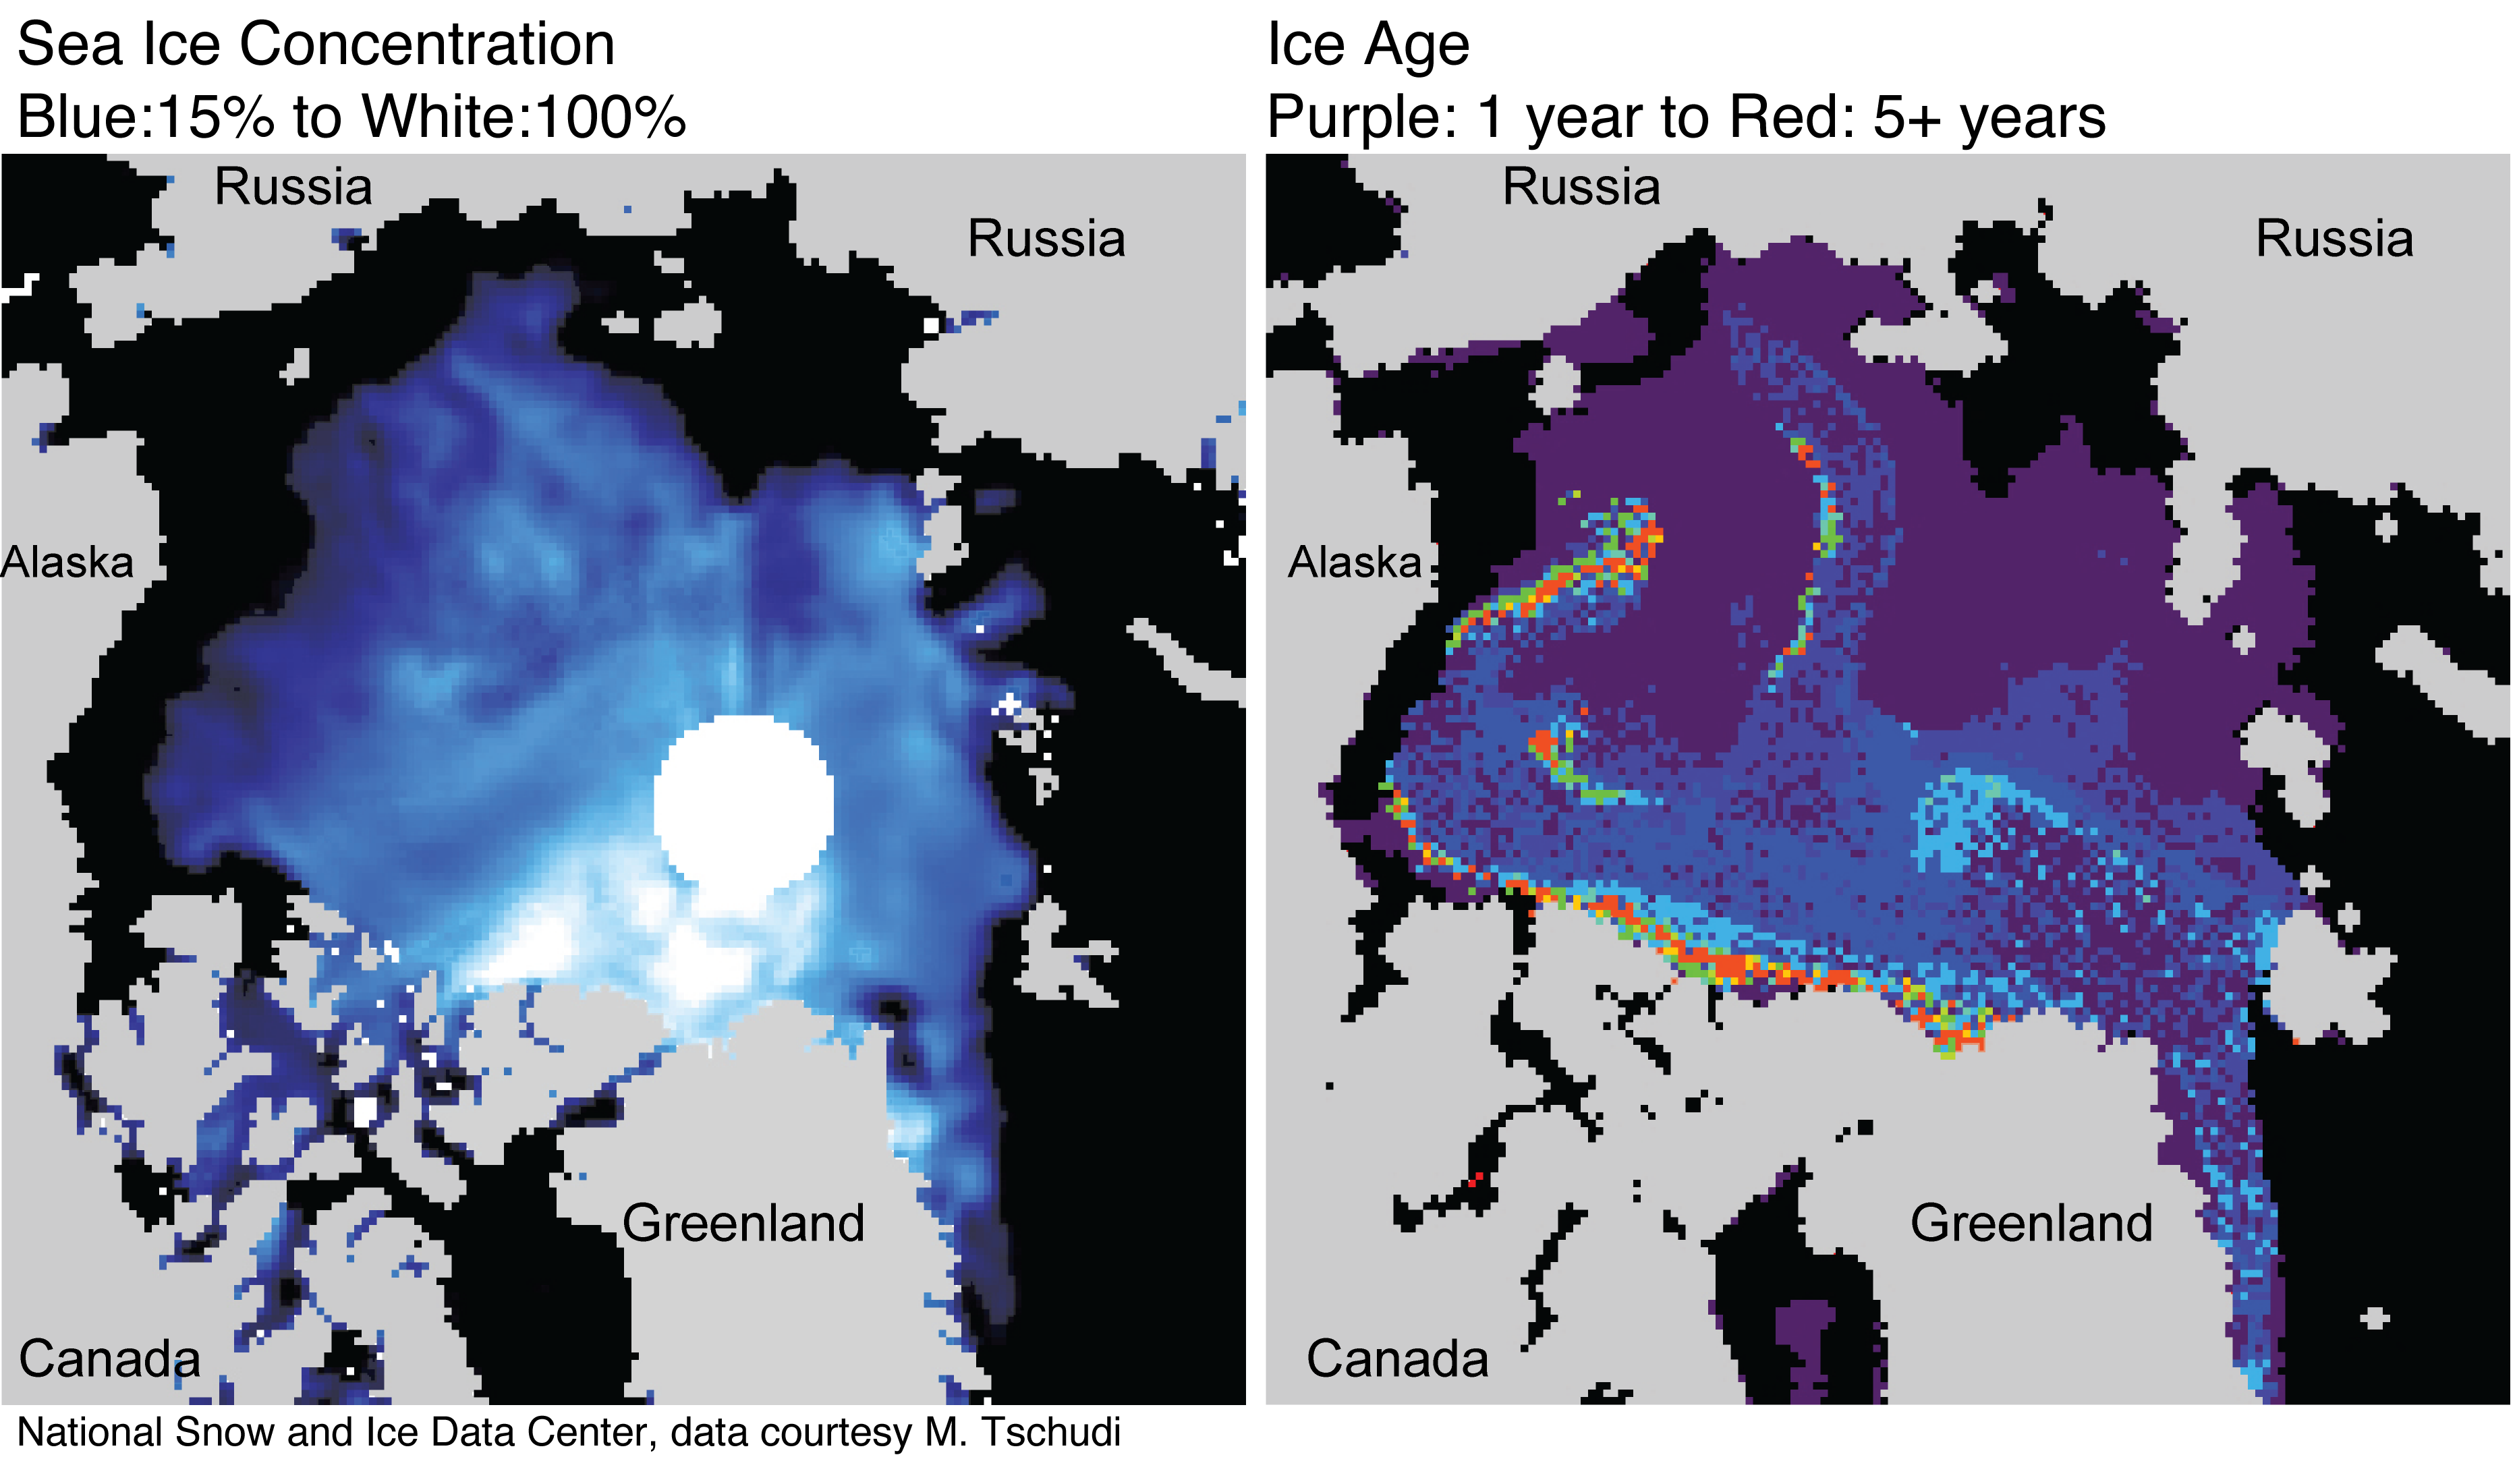 Figure 4. These maps show sea ice concentration (left) and ice age (right) over the Arctic Ocean. In the Beaufort Sea off the coast of Alaska, ice has melted back to the edge of a tongue of older, thicker ice. In the ice age image, red shows ice 5 years old and older, green shows 4-year-old ice, light blue shows 3-year-old ice, dark blue is second-year ice, and purple shows first-year ice.
—Credit: NSIDC, data courtesy M. Tschudi
High-resolution image
New ice age measurements show decline in oldest, thickest ice
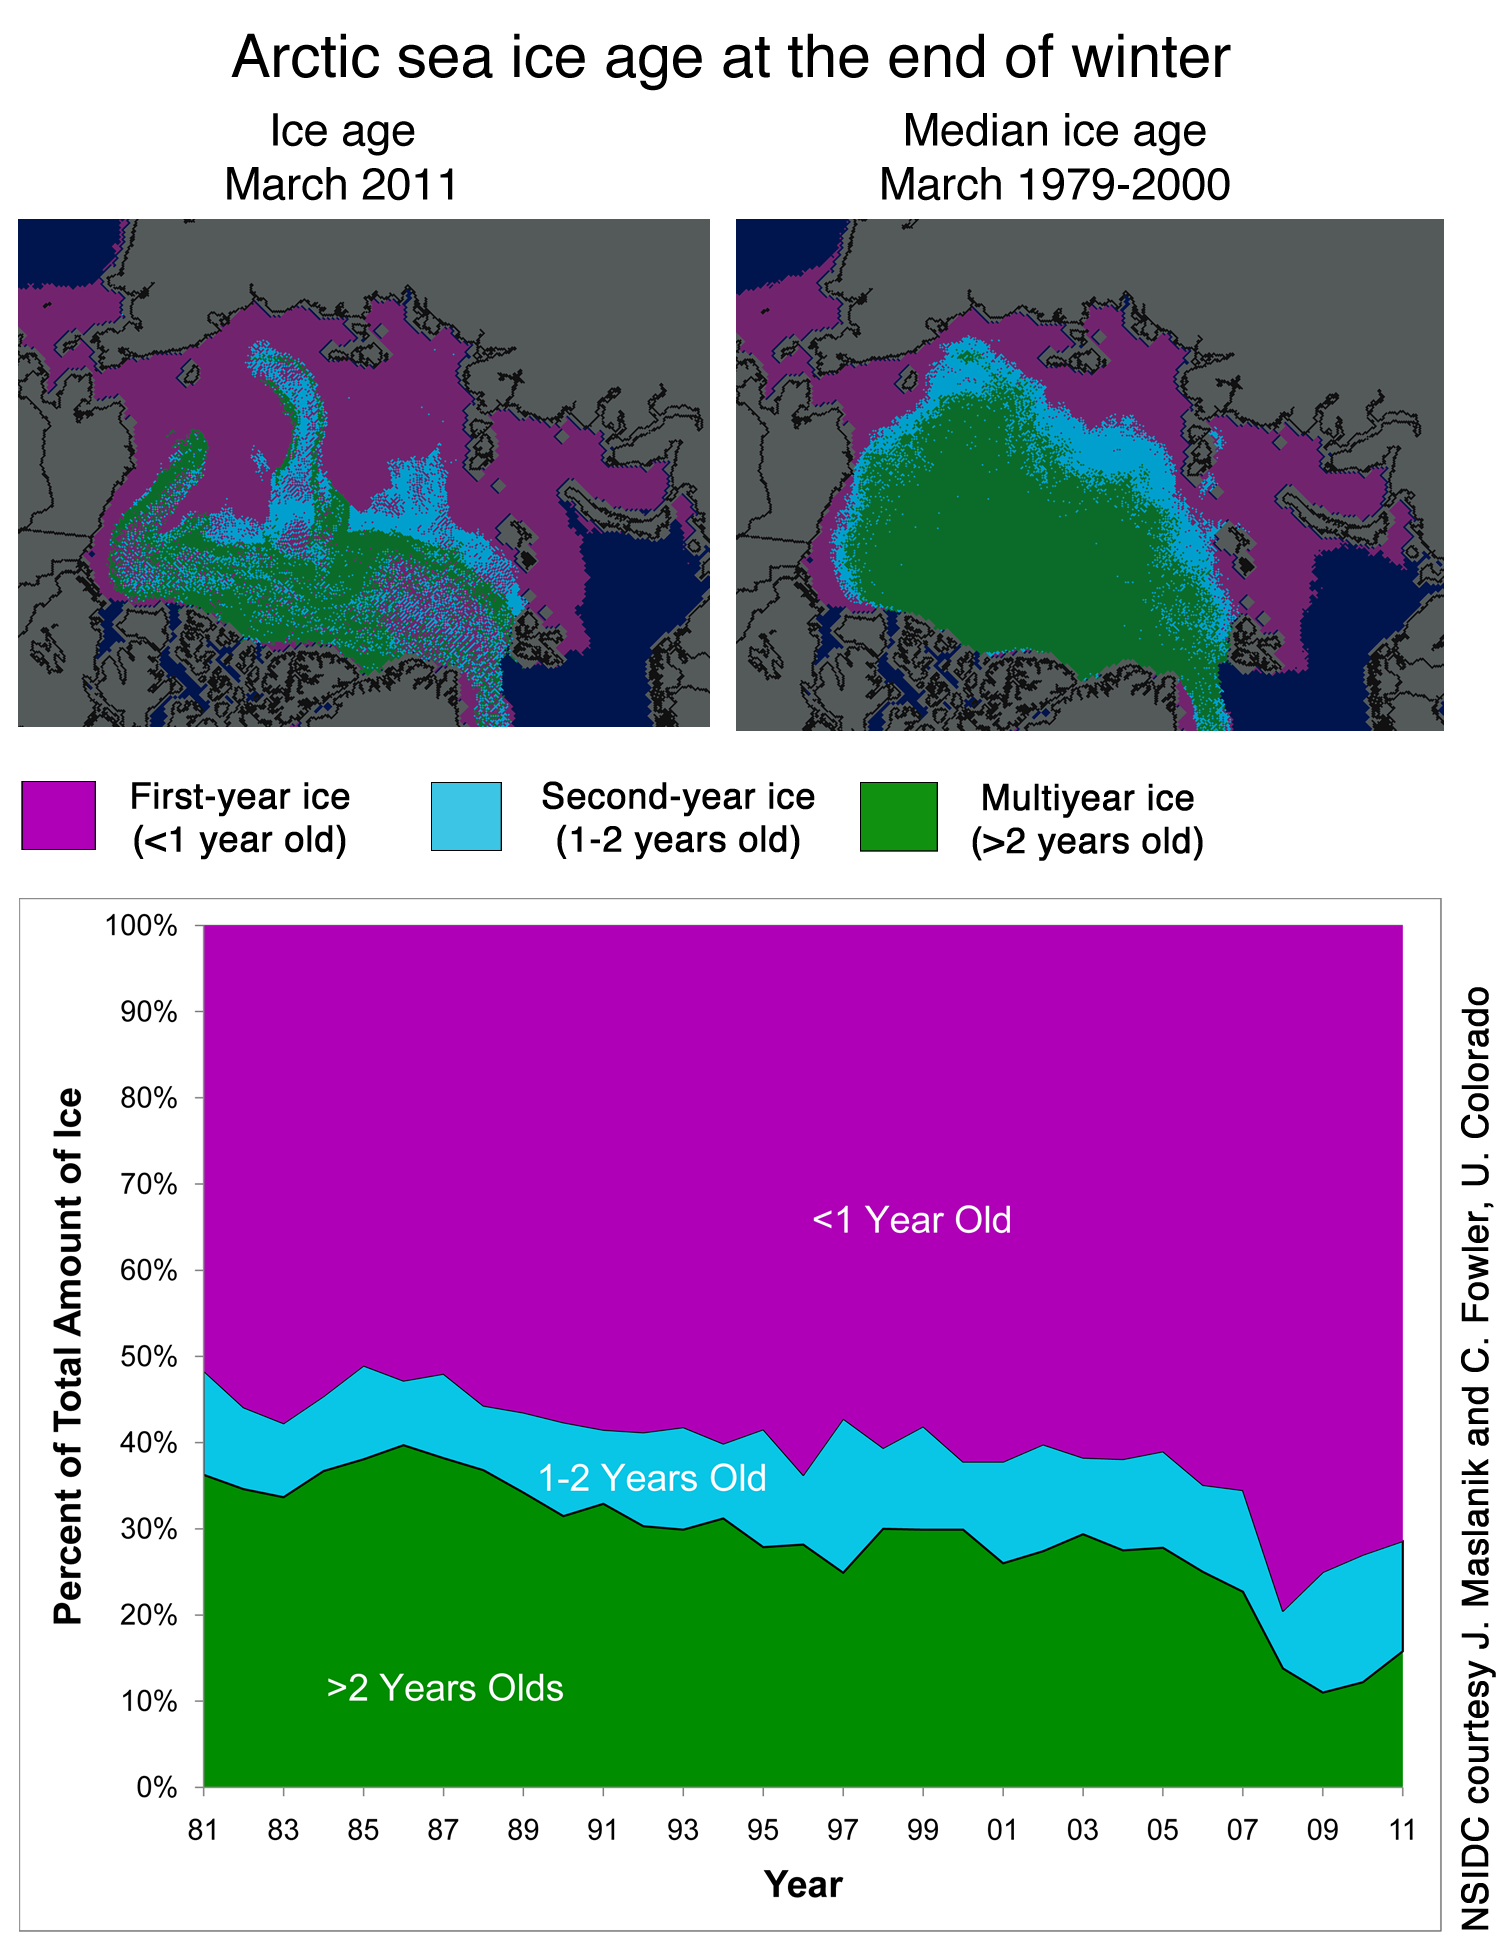
Researchers look at ice age as a way to estimate ice thickness. Ice thickness matters to the overall stability of the ice cover, because older ice grows thicker over multiple seasons, while newly formed ice tends to be thin and vulnerable to melt. While the amount of older sea ice has increased somewhat since September 2007, an updated analysis of satellite-derived sea ice age recently published by James Maslanik and co-authors show the oldest ice (ice older than five years) has continued to decline.
Until recently, the central Arctic Ocean and Canadian Archipelago served as refuges for some of the oldest, thickest ice. However, the new data show that ice age is now declining in these areas. A map of ice age for the third week of July, combined with sea ice concentration for July 31, 2011 (Figure 4) shows that in the eastern Beaufort Sea, the ice has essentially melted back to the edge of the multi-year ice cover (ice older than one year). Multi-year ice is more resistant to melting completely in summer, so it is not yet clear how much more ice will melt. Another tongue of old ice extends from near the pole towards the New Siberian Islands.
Between late March and late July first-year (younger) Arctic sea ice has declined by 30%, multi-year ice has declined by 14%, and the oldest ice, or ice older than 5 years, has declined by 16% . For background information on ice thickness, see the new post on NSIDC’s Icelights.
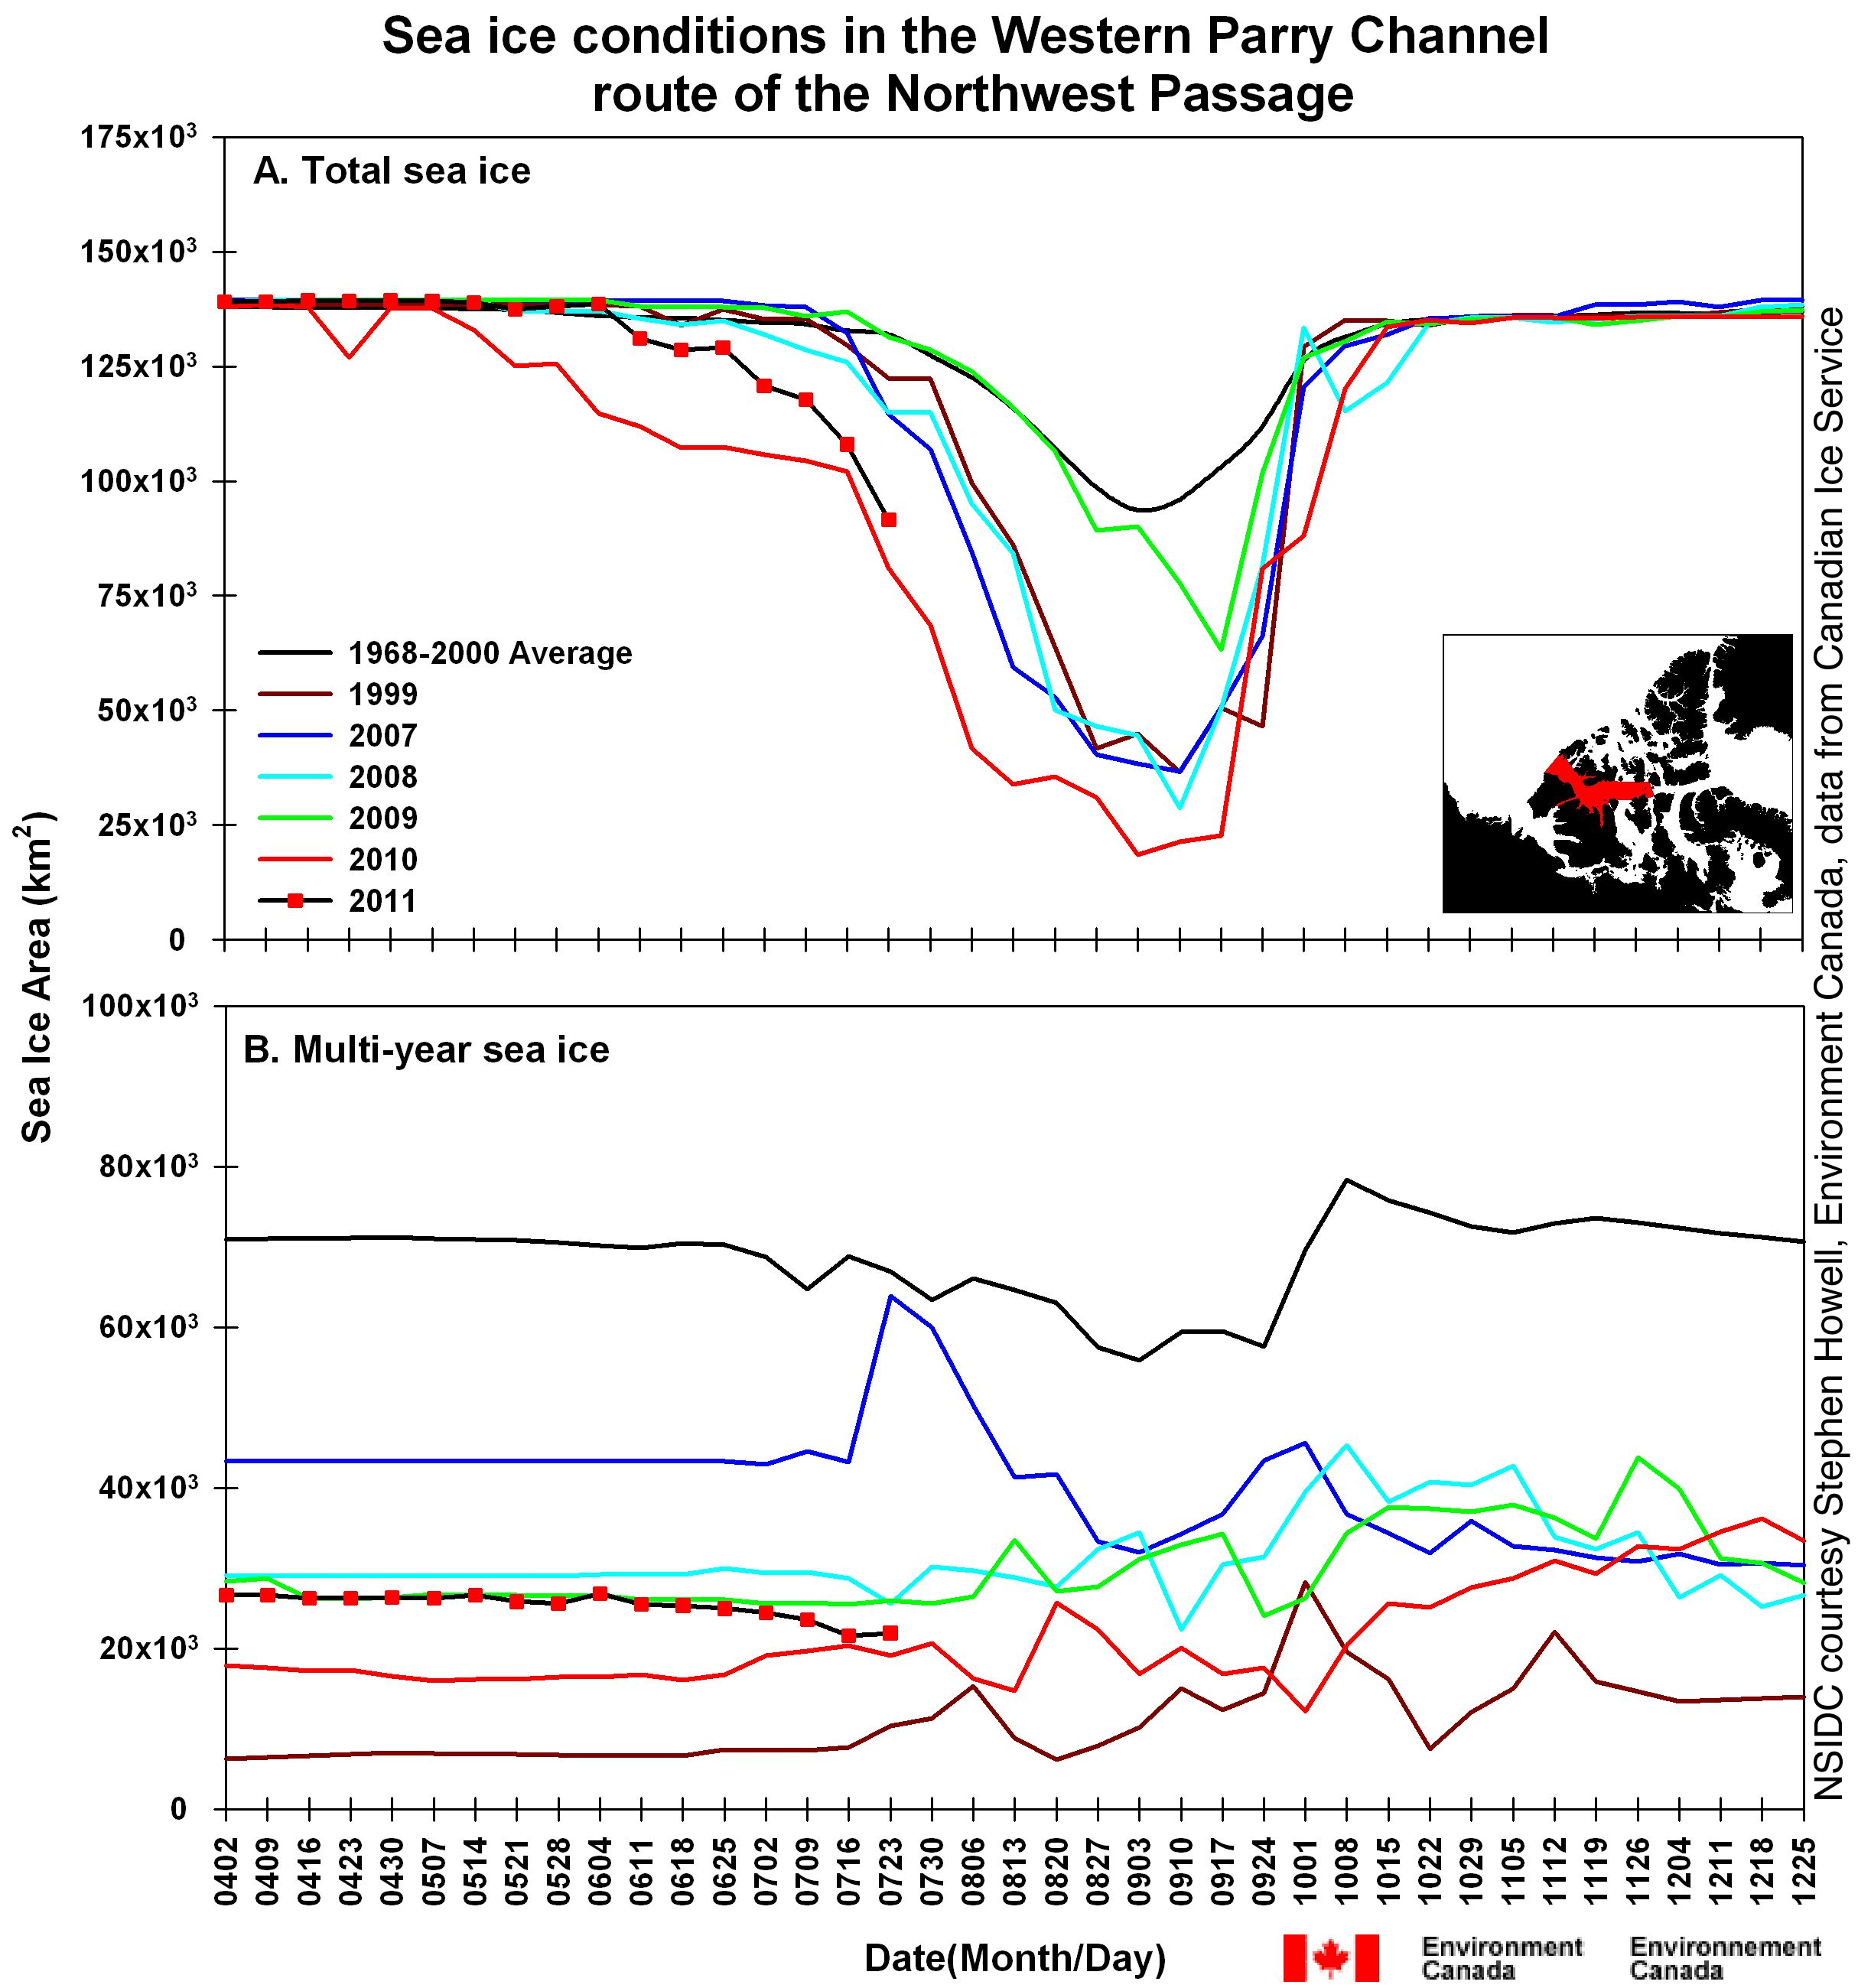
Figure 5. This time series shows total sea ice area (top) and multi-year ice area (bottom) for selected years within the Western Parry Channel route of the Northwest Passage. The black line with red dots shows 2011, and other colors show ice conditions in different years.—Credit: NSIDC courtesy Stephen Howell, Environment Canada, from Canadian Ice Service data
High-resolution image
Ice loss in Arctic shipping routes
Over the past few weeks, the sea ice edge has retreated from the shores of Siberia and Eurasia, potentially opening up much of the Northern Sea Route, the shipping lane that runs along the Eurasian Arctic coast from Murmansk on the Barents Sea, along Siberia, and through the Bering Strait. Higher resolution data such as the Multisensor Analyzed Sea Ice Extent (MASIE) indicate that some ice remains, particularly in the East Siberian Sea, but the reduced ice cover in the region has already made the route feasible this year. Taking advantage of the early retreat of sea ice in the Kara and Barents seas, the tanker Perserverance set sail on June 29, 2011 from Murmansk, Russia, aided by two icebreakers and completed the passage on July 14. The company plans to send six to seven more ships through the Northern Sea Route this summer.
On the other side of the Arctic, the Northwest Passage is still choked with ice. However, data provided by Stephen Howell of Environment Canada show that ice loss in the Northwest Passage is well ahead of average (Figure 5), nearly matching last year when, according to Canadian Ice Service (CIS) analyses, sea ice in the Parry Channel (the northern part of the Northwest Passage) reached the lowest levels in the CIS records dating back to 1968. Whether a navigable channel does indeed open this year will depend on weather conditions through the next few weeks, but so far, it looks possible.
Please note that NSIDC is not an operational ice forecasting center. For shipping purposes, please consult the Canadian Ice Service or the US National Ice Center.
References
Maslanik, J., J. Stroeve, C. Fowler, and W. Emery. 2011. Distribution and trends in Arctic sea ice age through spring 2011, Geophysical Research Letters, 38, L13502, doi:10.1029/2011GL047735.
Tivy, A., S. E. L. Howell, B. Alt, S. McCourt, R. Chagnon, G. Crocker, T. Carrieres, and J. J. Yackel. 2011. Trends and variability in summer sea ice cover in the Canadian Arctic based on the Canadian Ice Service Digital Archive, 1960–2008 and 1968–2008, Journal of Geophysical Research, 116, C03007, doi:10.1029/2009JC005855.
For previous analyses, please see the drop-down menu under Archives in the right navigation at the top of this page.