On September 15, Arctic sea ice likely reached its annual minimum extent of 3.74 million square kilometers (1.44 million square miles). The minimum ice extent is the second lowest in the 42-year-old satellite record, reinforcing the long-term downward trend in Arctic ice extent. Sea ice extent will now begin its seasonal increase through autumn and winter. In the Antarctic, sea ice extent is now well above average and within the range of the ten largest ice extents on record, underscoring its high year-to-year variability. The annual maximum for Antarctic sea ice typically occurs in late September or early October.
Please note that this is a preliminary announcement. Changing winds or late-season melt could still reduce the Arctic ice extent, as happened in 2005 and 2010. NSIDC scientists will release a full analysis of the Arctic melt season, and discuss the Antarctic winter sea ice growth, in early October.
Overview of conditions
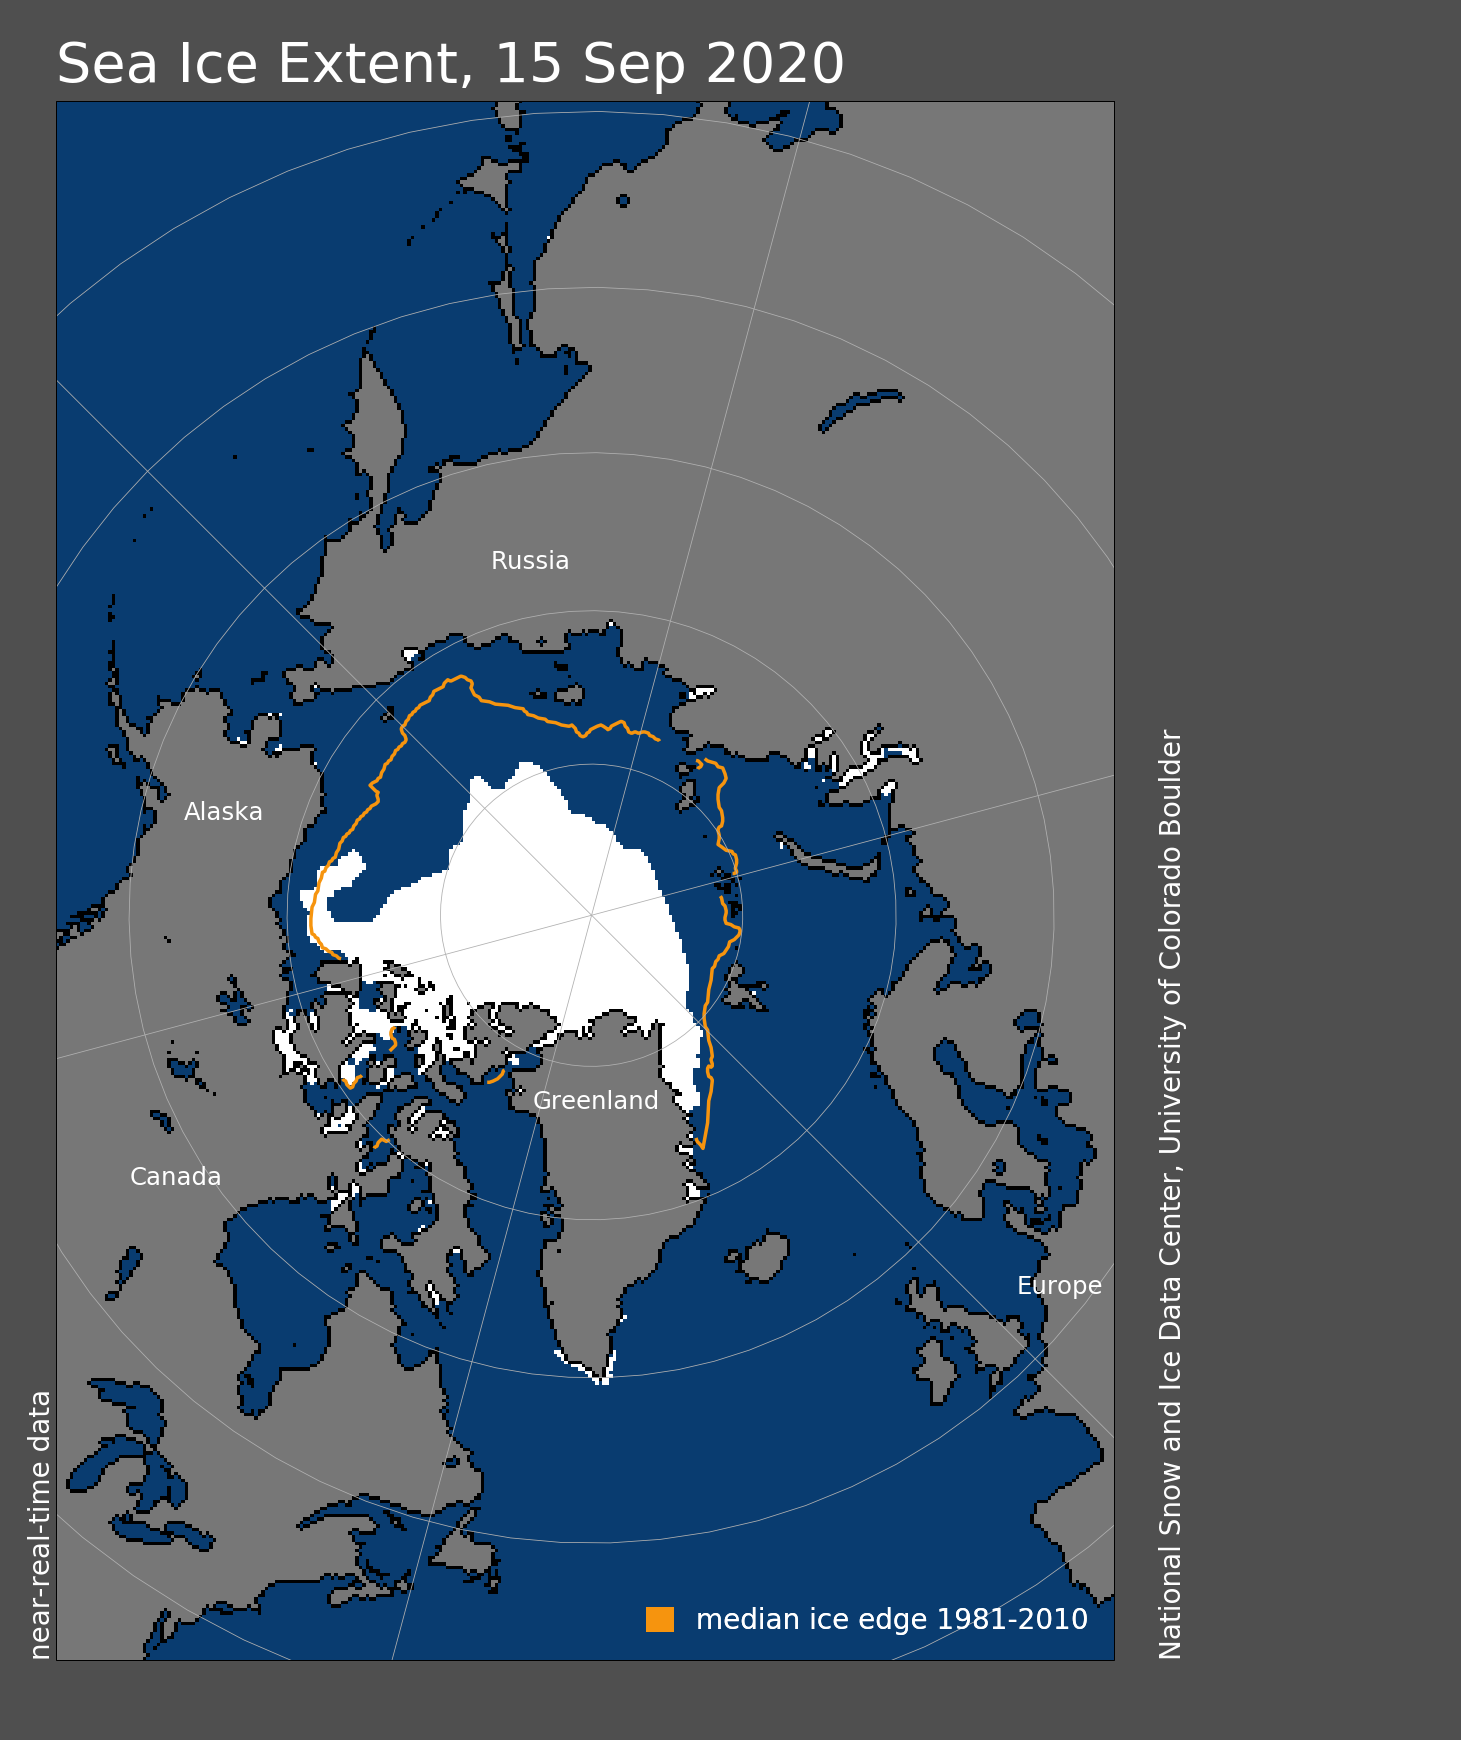
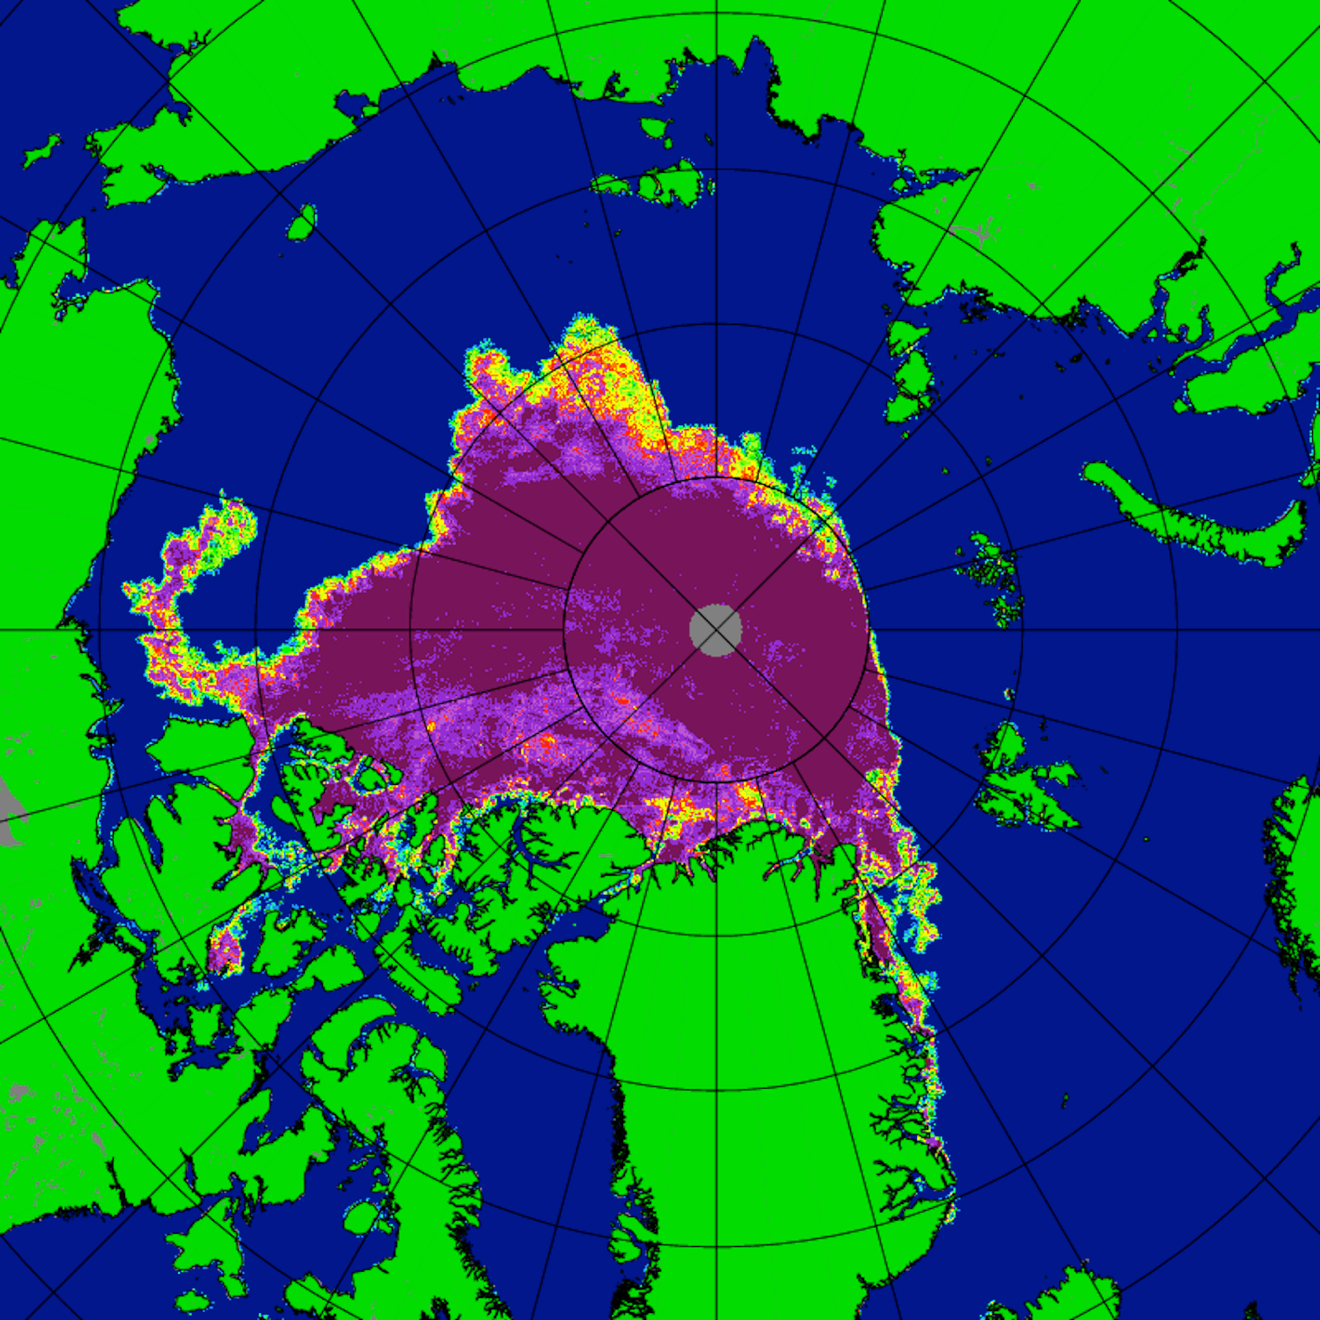
Figure 1a. Arctic sea ice extent for September 15, 2020 was 3.74 million square kilometers (1.44 million square miles). The orange line shows the 1981 to 2010 average extent for that day. Sea Ice Index data. About the data
Credit: National Snow and Ice Data Center
High-resolution image
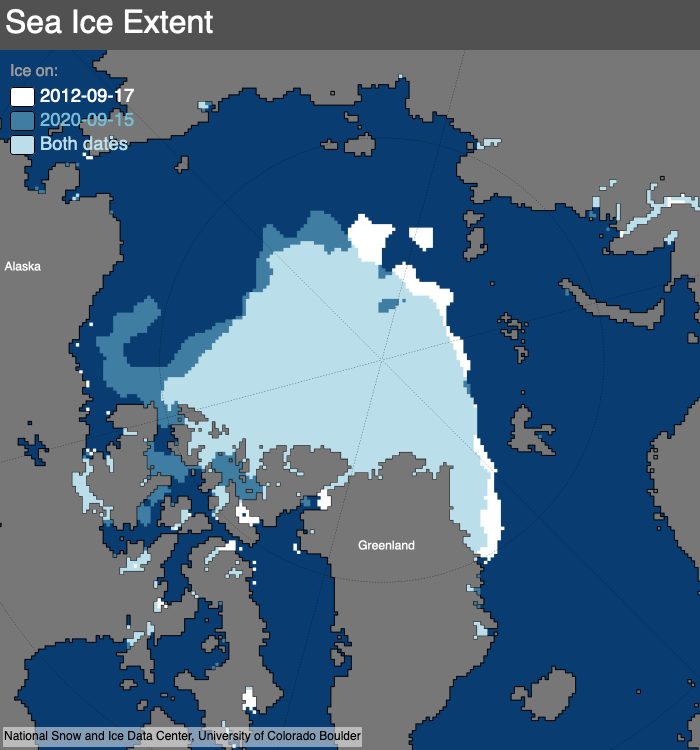
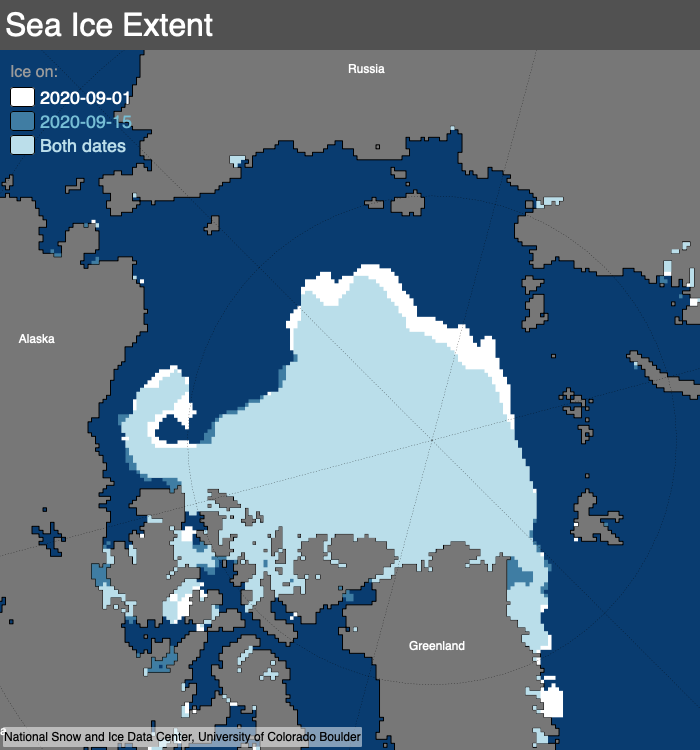
Figure 1b. The map above compares the 2012 Arctic sea ice minimum, reached on September 17, with the 2020 Arctic sea ice minimum, reached on September 15. Light blue shading indicates the region where ice occurred in both 2012 and 2020, while white and medium blue areas show ice cover unique to 2012 and to 2020, respectively. Sea Ice Index data. About the data
Credit: National Snow and Ice Data Center
High-resolution image
A sharp decline of Arctic sea ice at the beginning of September dropped the extent below 4.0 million square kilometers (1.54 million square miles) for only the second time since the beginning of the satellite record in 1979. After September 8, daily melt began leveling out, reaching its seasonal minimum extent of 3.74 million square kilometers (1.44 million square miles) on September 15 (Figure 1a). This appears to be the lowest extent of the year. In response to the setting sun and falling temperatures, ice extent will begin increasing through autumn and winter. However, a shift in wind patterns or a period of late season melt could still push the ice extent lower.
Compared to 2012, the minimum extent this year has more ice in the Beaufort Sea, but somewhat less ice in the Laptev and East Greenland Sea regions (Figure 1b). The minimum extent was reached one day later than the 1981 to 2010 median minimum date of September 14. The interquartile range of minimum dates is September 11 to September 19.
The 14 lowest extents in the satellite era have all occurred in the last 14 years.
Conditions in context
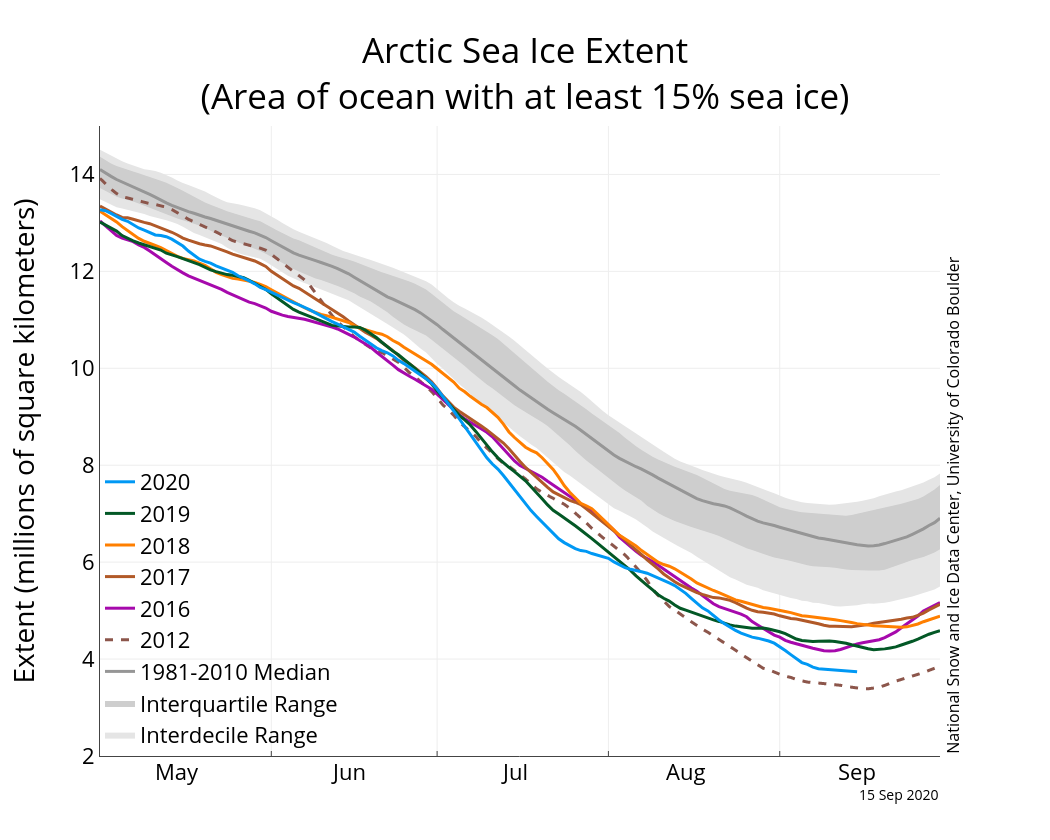
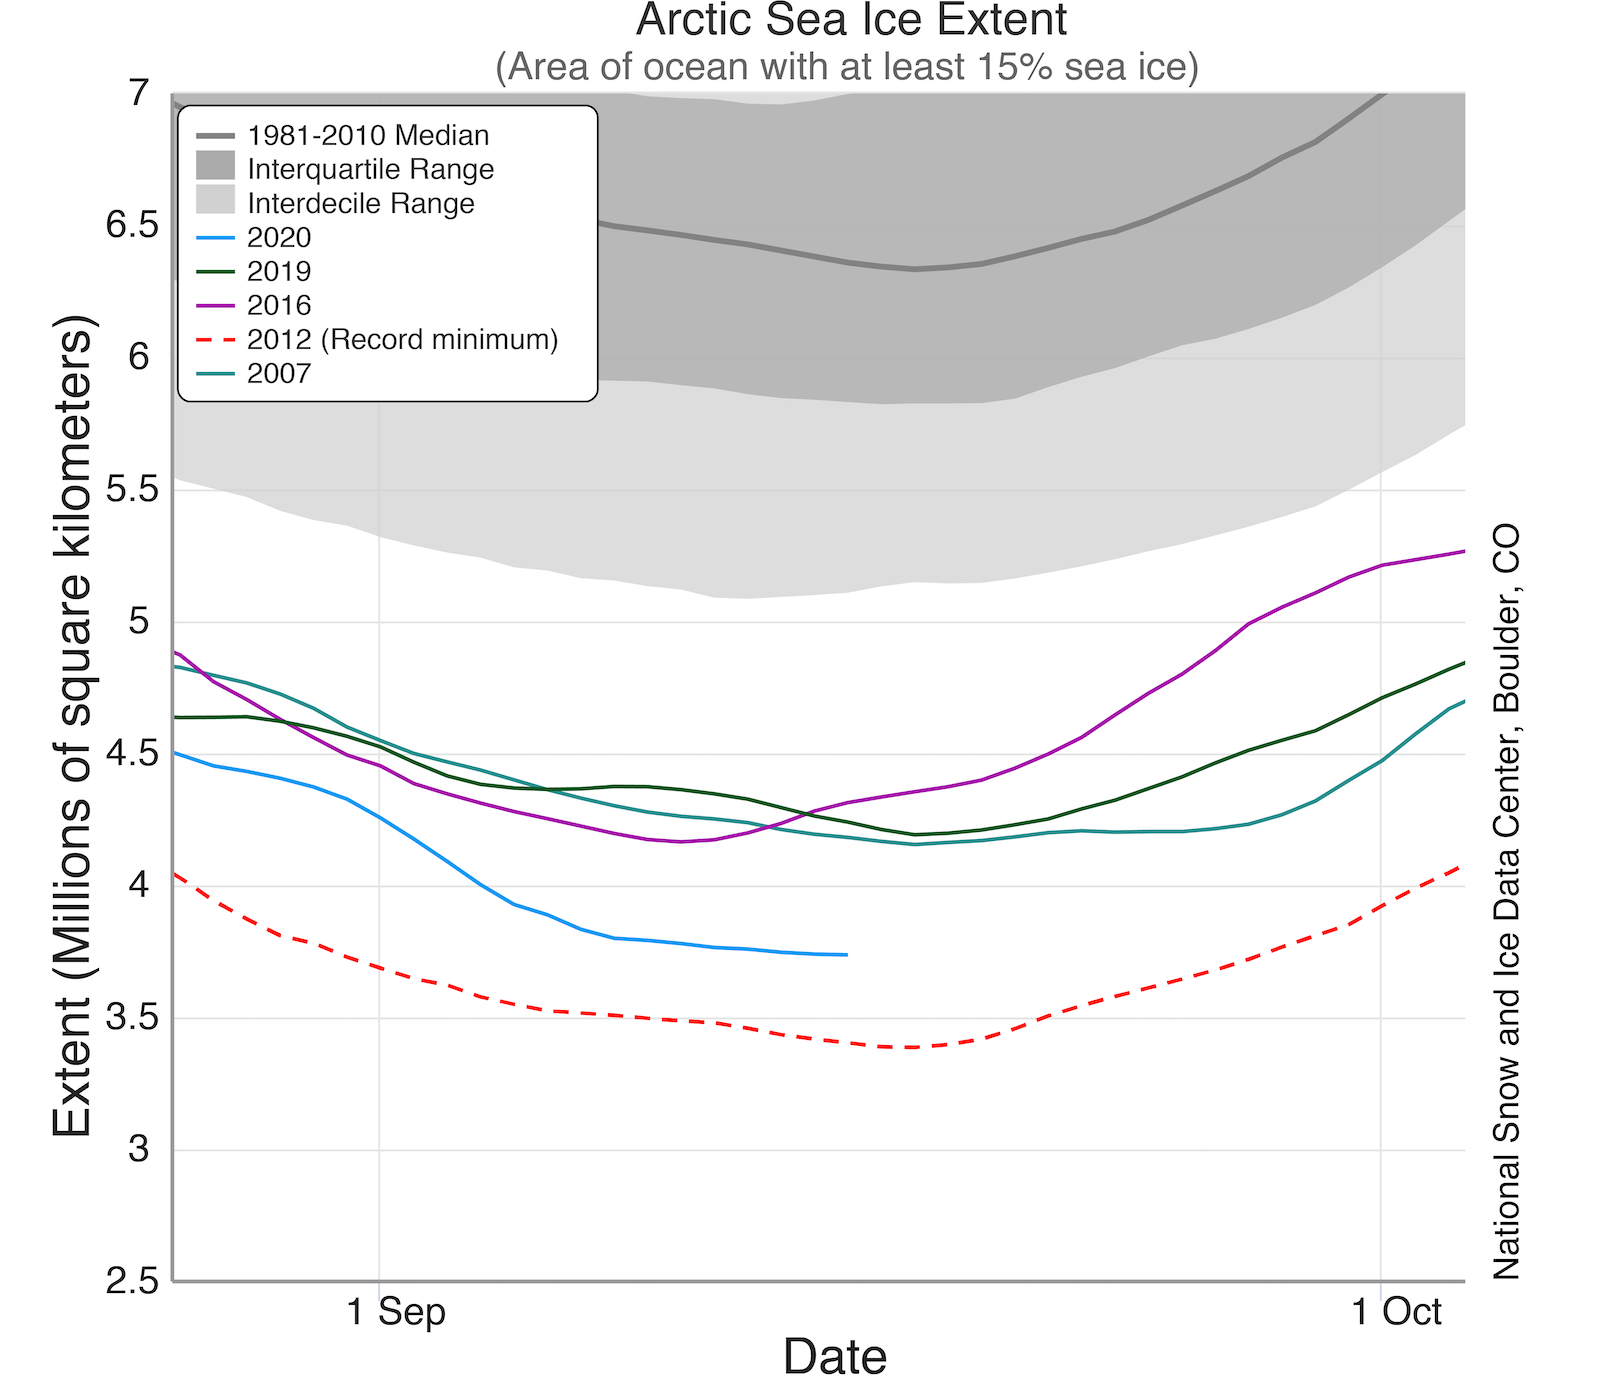
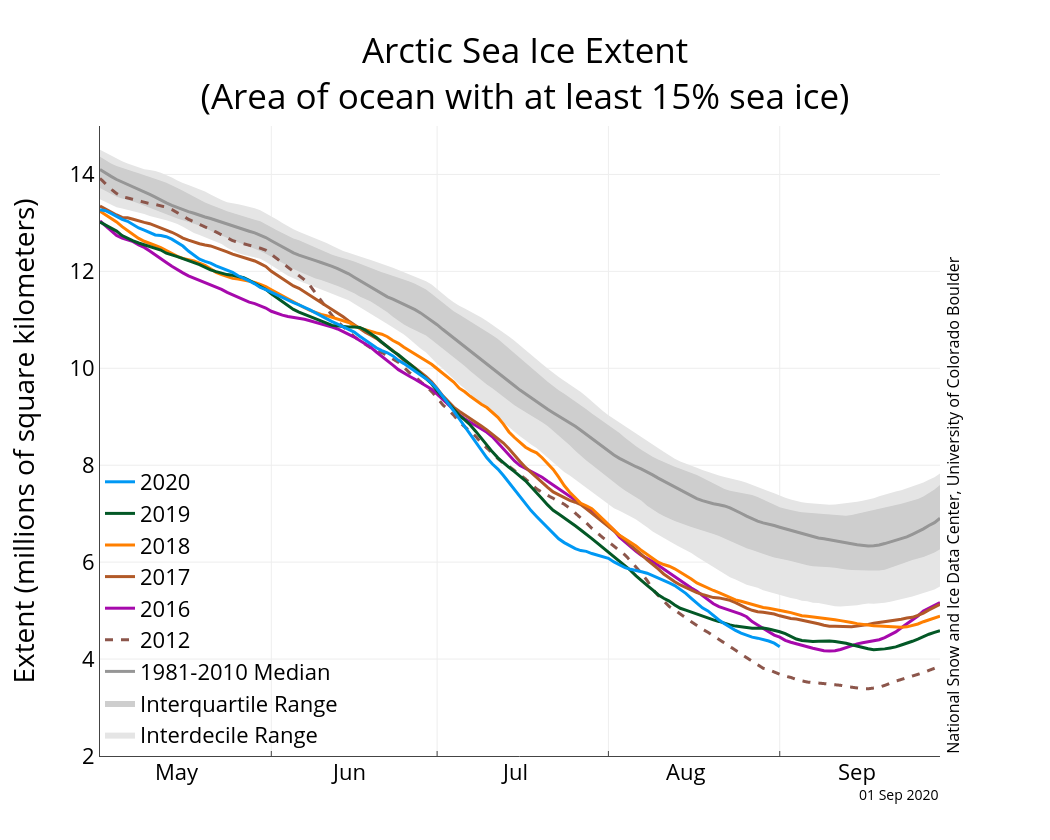
Figure 2a. The graph above shows Arctic sea ice extent on September 15, 2020, along with several other recent years and the record minimum set in 2012. 2019 is shown in green, 2018 in orange, 2017 in brown, 2016 in magenta, and 2012 in dashed brown. The 1981 to 2010 median is in dark gray. The gray areas around the median line show the interquartile and interdecile ranges of the data. Sea Ice Index data.
Credit: National Snow and Ice Data Center
High-resolution image
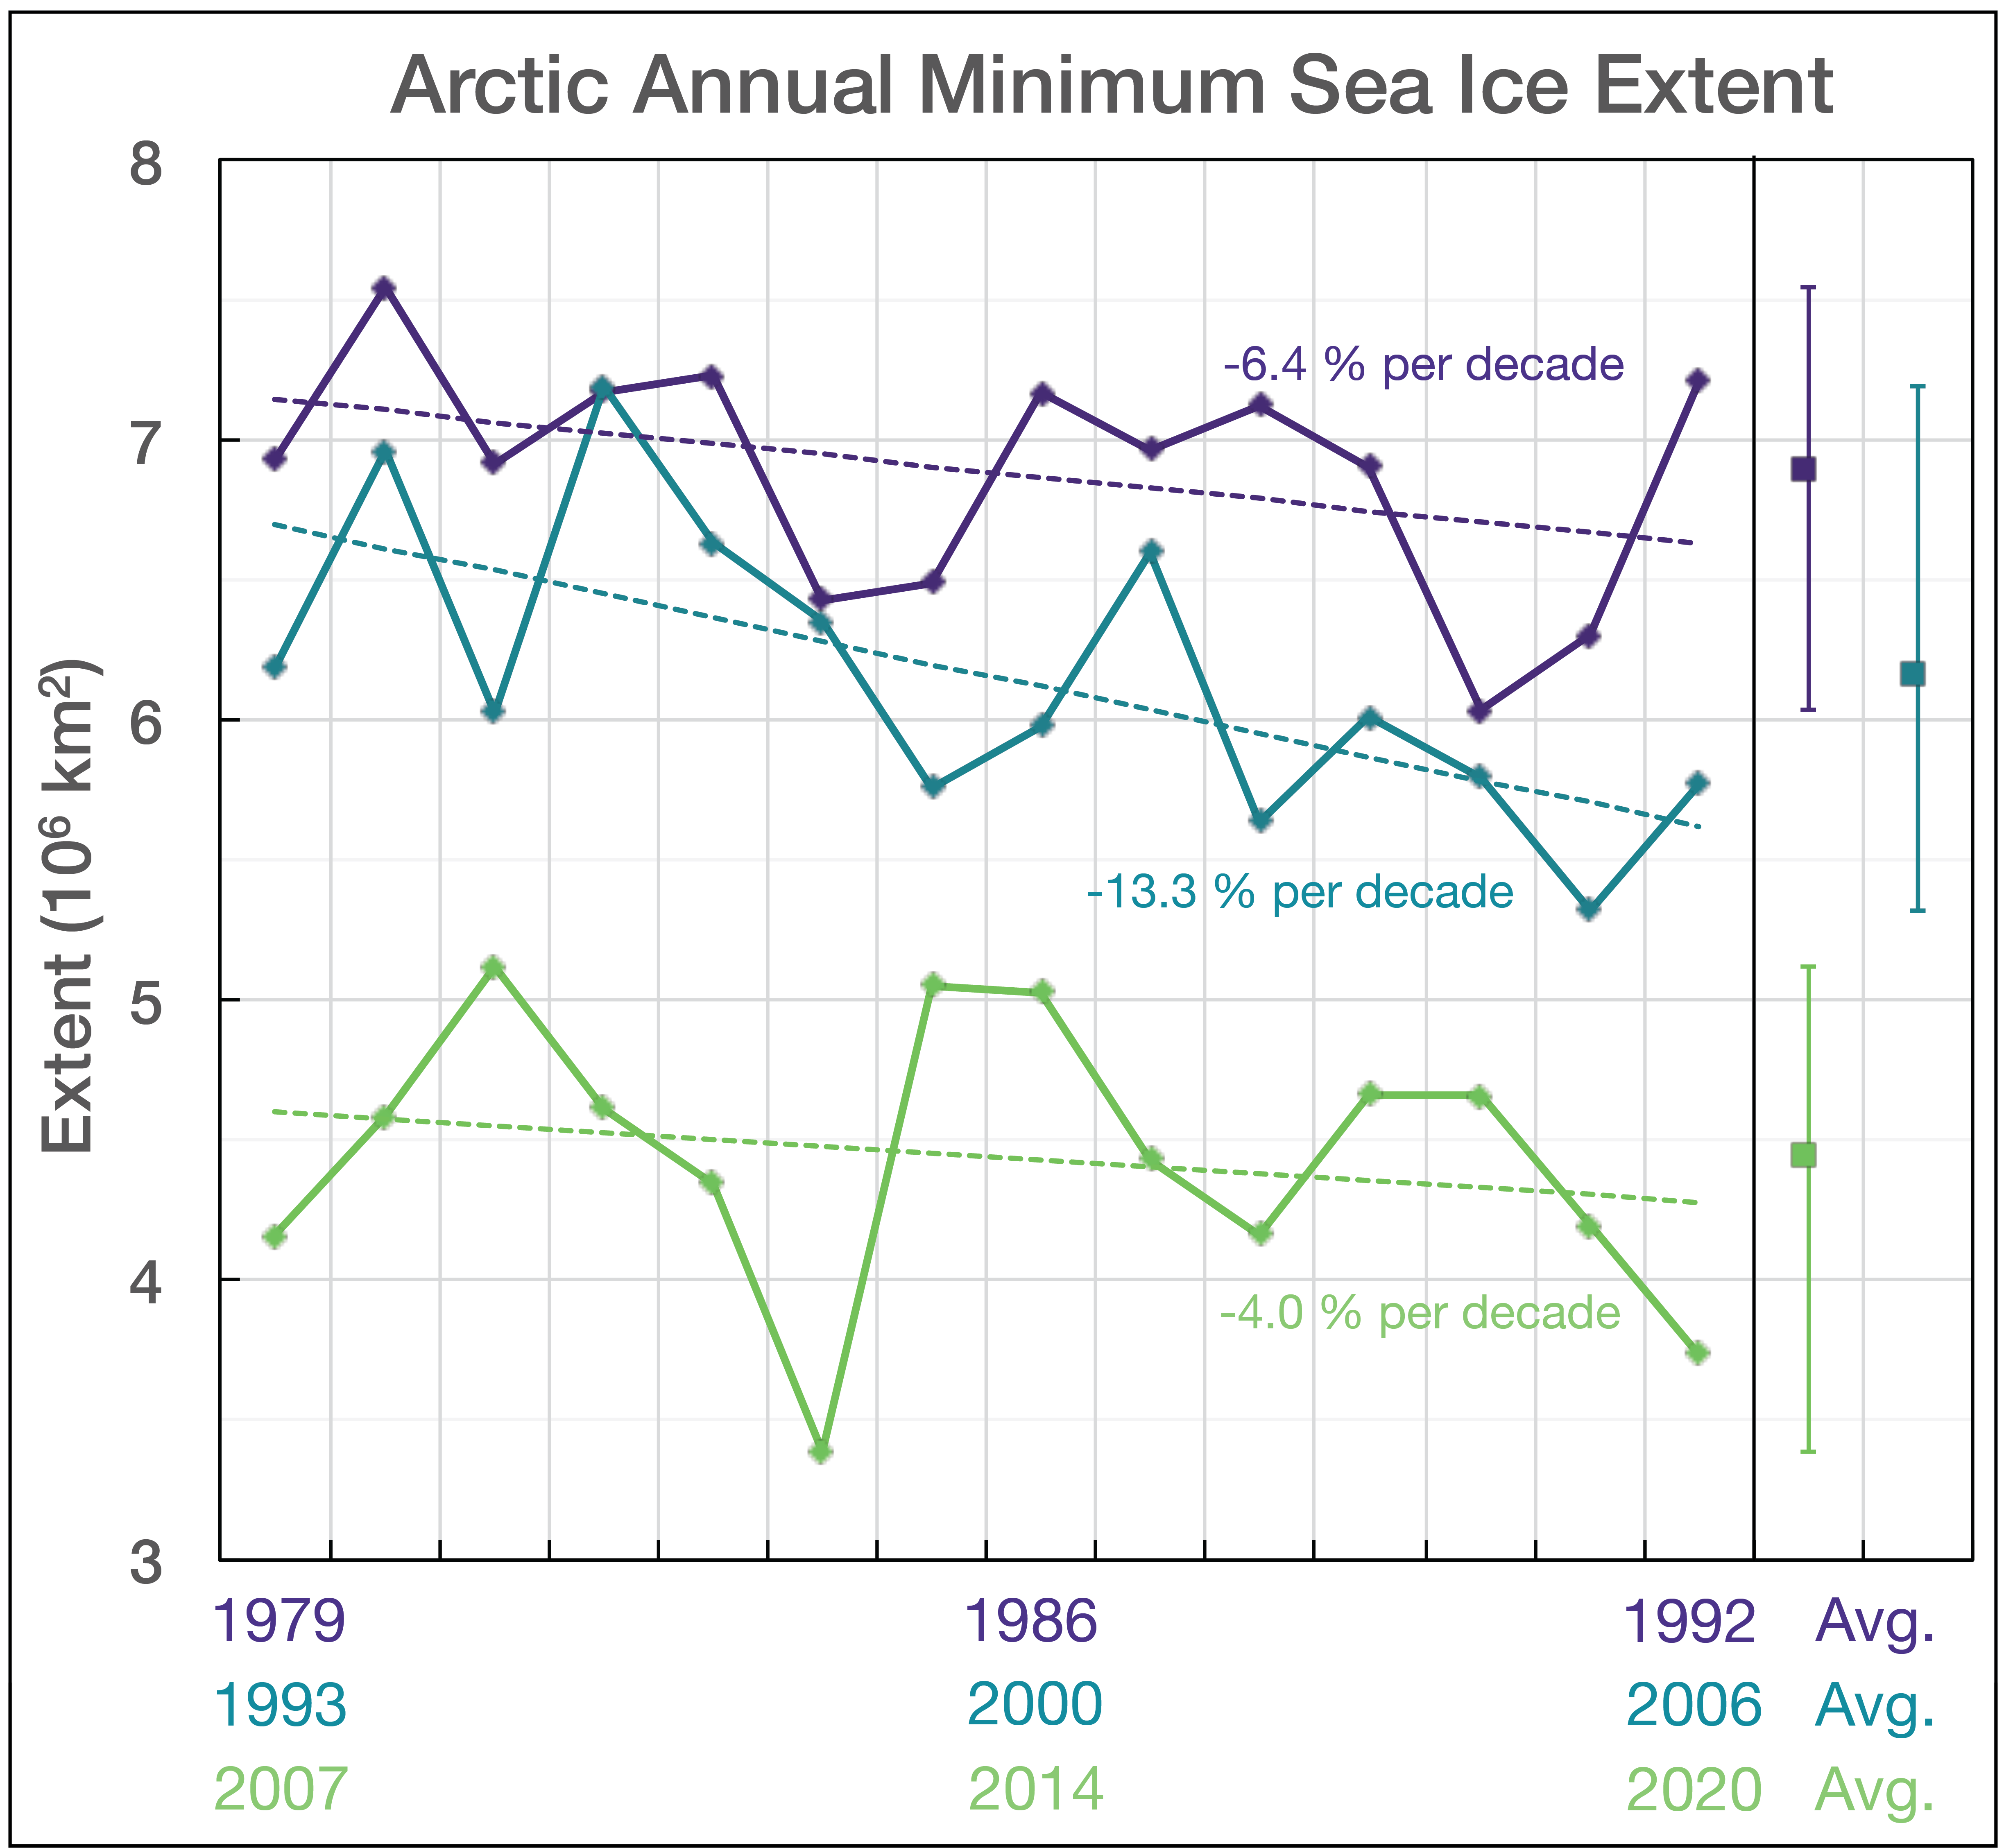
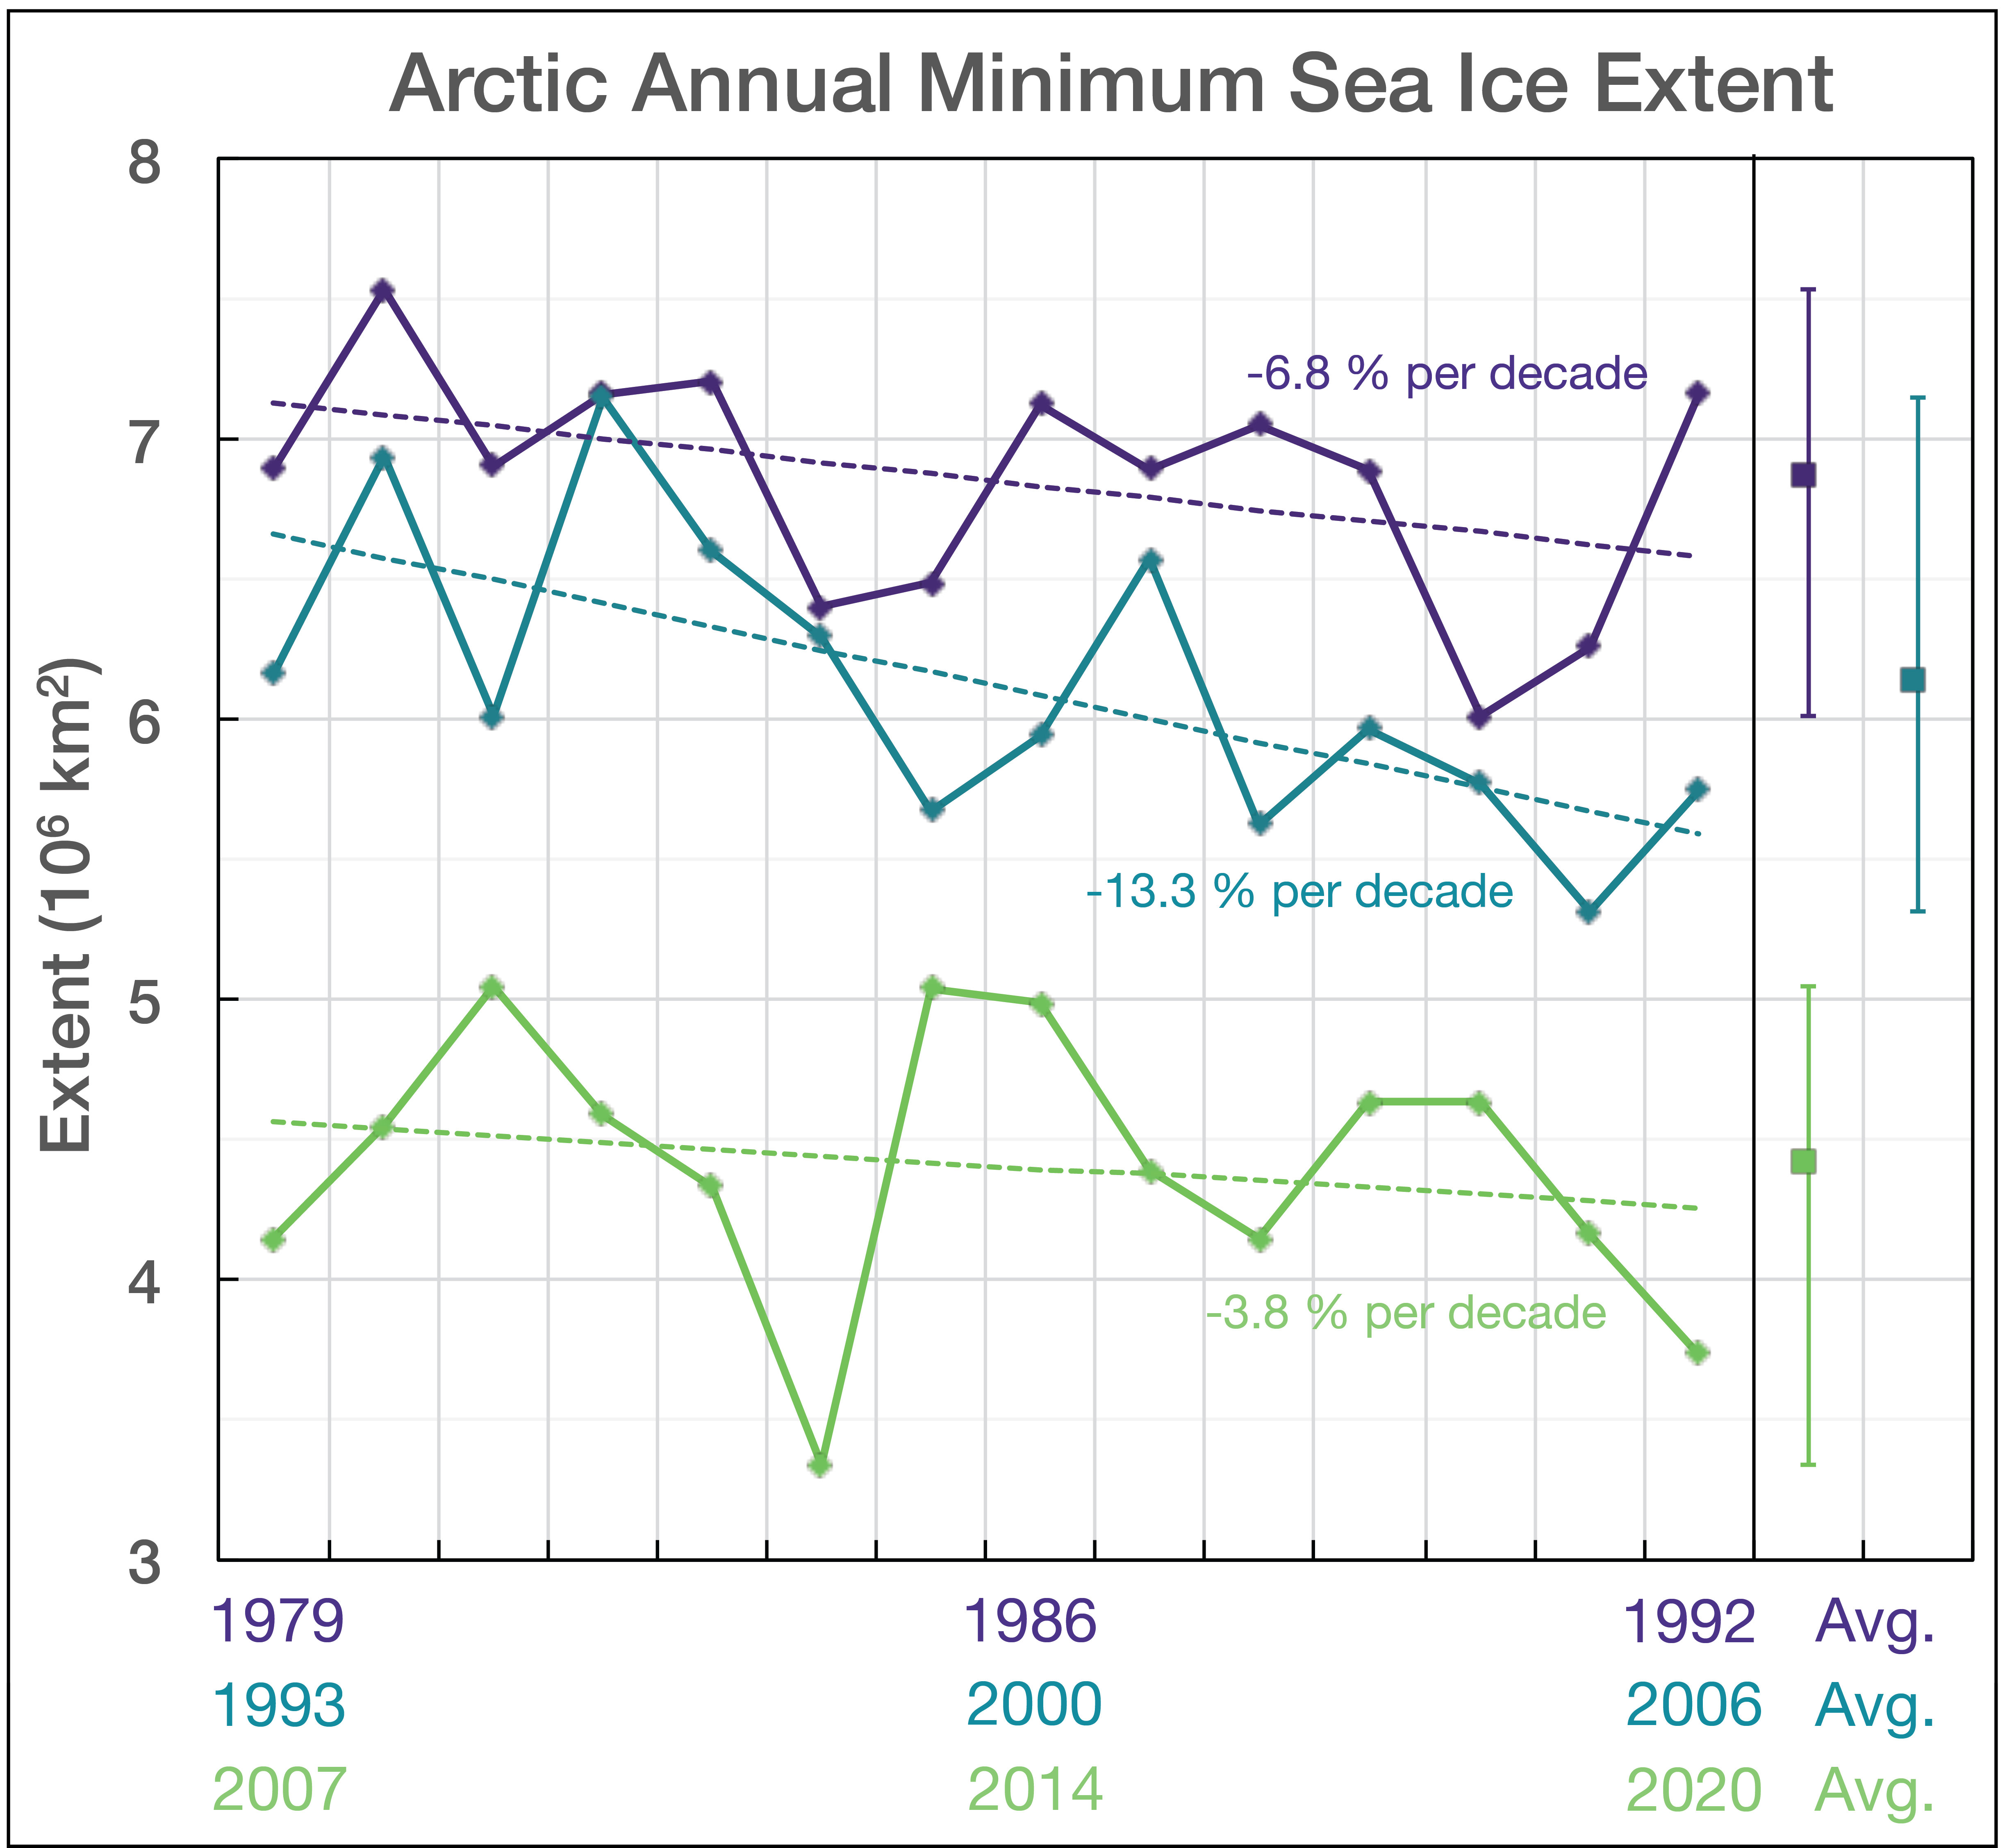
Figure 2b. This graph shows linear trends of Arctic sea ice extent for three 14-year periods for the day of the annual minimum. Trend percent values are relative to the 1981 to 2010 average minimum extent. On the right, the average (square) and range of highest and lowest extents at the minimum for each period are given.
Credit: W. Meier, NSIDC
High-resolution image
This year’s minimum set on September 15 was 350,000 square kilometers (135,000 square miles) above the record minimum extent in the satellite era, which occurred on September 17, 2012 (Figure 2a). It is also 2.51 million square kilometers (969,000 square miles) below the 1981 to 2010 average minimum extent, which is equivalent in size to roughly the states of Alaska, Texas, and Montana combined, or Greenland and Finland combined.
The 42-minimum-extent values in the satellite record can be broken down into three 14-year periods. Most notably, minimum extents in the last 14 years of the time series are the lowest 14 in the 42-year record (Figure 2b). All three periods show a downward trend. The middle period, 1993 to 2006, shows the steepest downward trend of 13.3 percent per decade, relative to the 1981 to 2010 average. The earliest period, 1979 to 1992, has a downward trend of 6.4 percent per decade, while the most recent period of low extents, 2007 to 2020, has a downward trend of 4.0 percent per decade.
The overall, downward trend in the minimum extent from 1979 to 2020 is 13.4 percent per decade relative to the 1981 to 2010 average.
Fourteen lowest minimum Arctic sea ice extents (satellite record, 1979 to present)
| RANK | YEAR | MINIMUM ICE EXTENT | DATE | |
|---|---|---|---|---|
| IN MILLIONS OF SQUARE KILOMETERS | IN MILLIONS OF SQUARE MILES | |||
| 1 | 2012 | 3.39 | 1.31 | Sept. 17 |
| 2 | 2020 | 3.74 | 1.44 | Sept. 15 |
| 3 | 2007 2016 2019 |
4.16 4.17 4.19 |
1.61 1.61 1.62 |
Sept. 18 Sept. 18 Sept. 10 |
| 6 | 2011 | 4.34 | 1.68 | Sept. 11 |
| 7 | 2015 | 4.43 | 1.71 | Sept. 9 |
| 8 | 2008 2010 |
4.59 4.62 |
1.77 1.78 |
Sept. 19 Sept. 21 |
| 10 | 2018 2017 |
4.66 4.67 |
1.80 1.80 |
Sept. 23 Sept. 13 |
| 12 | 2014 2013 |
5.03 5.05 |
1.94 1.95 |
Sept. 17 Sept. 13 |
| 14 | 2009 | 5.12 | 1.98 | Sept. 13 |
Values within 40,000 square kilometers (15,000 square miles) are considered tied. The 2019 value has changed from 4.15 to 4.19 million square kilometers (1.62 million square miles) when final analysis data updated from near-real-time data.


