Loss of ice extent through the first half of July matched loss rates observed in 2012, the year which had the lowest September sea ice extent in the satellite record. Surface melt has become widespread and there is low concentration ice in the Beaufort Sea. However, projections suggest that a new record low extent is unlikely this year.
Overview of conditions
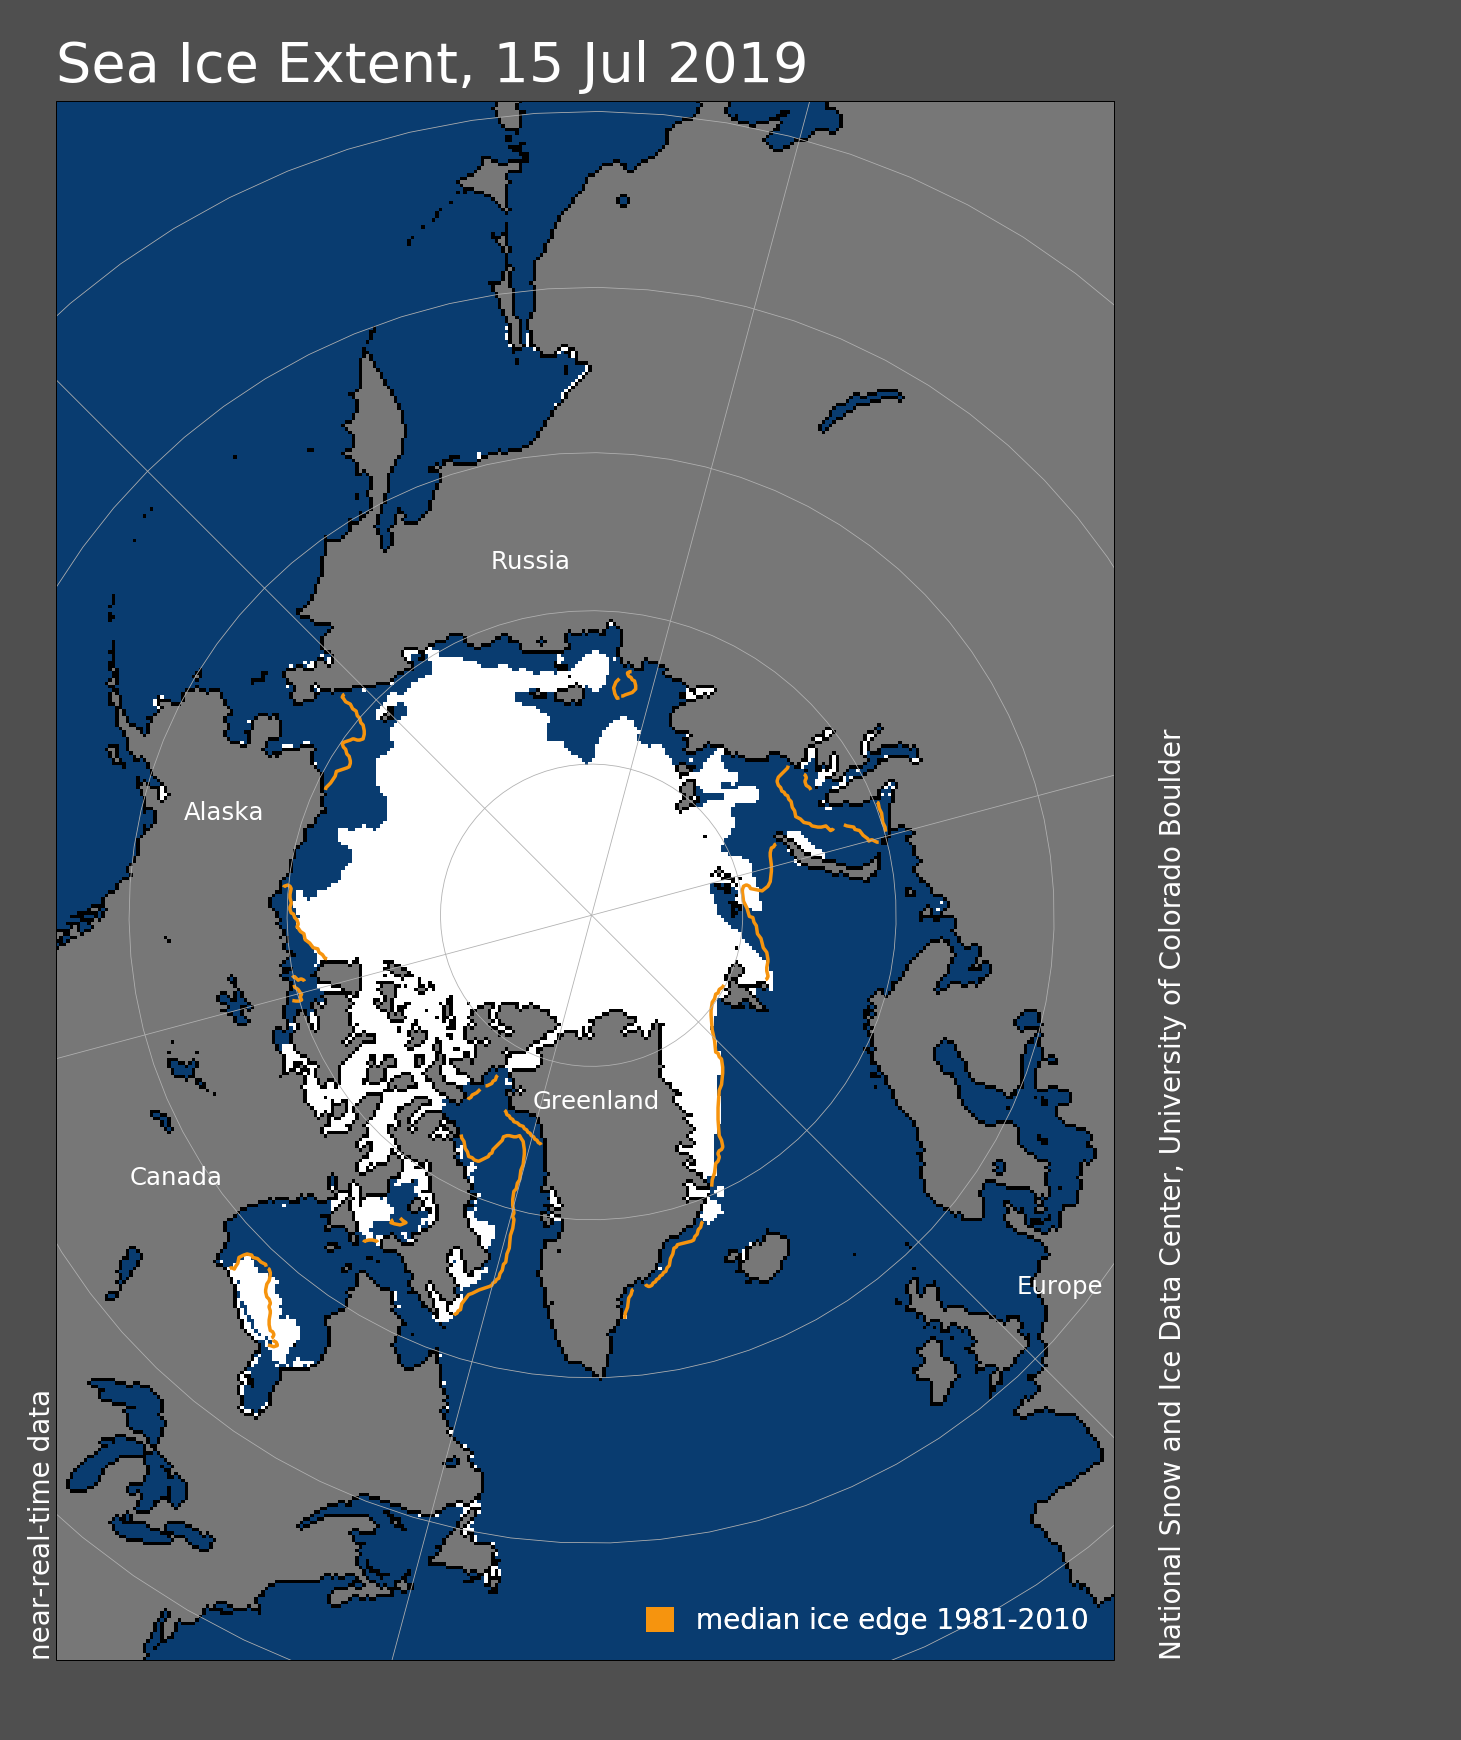
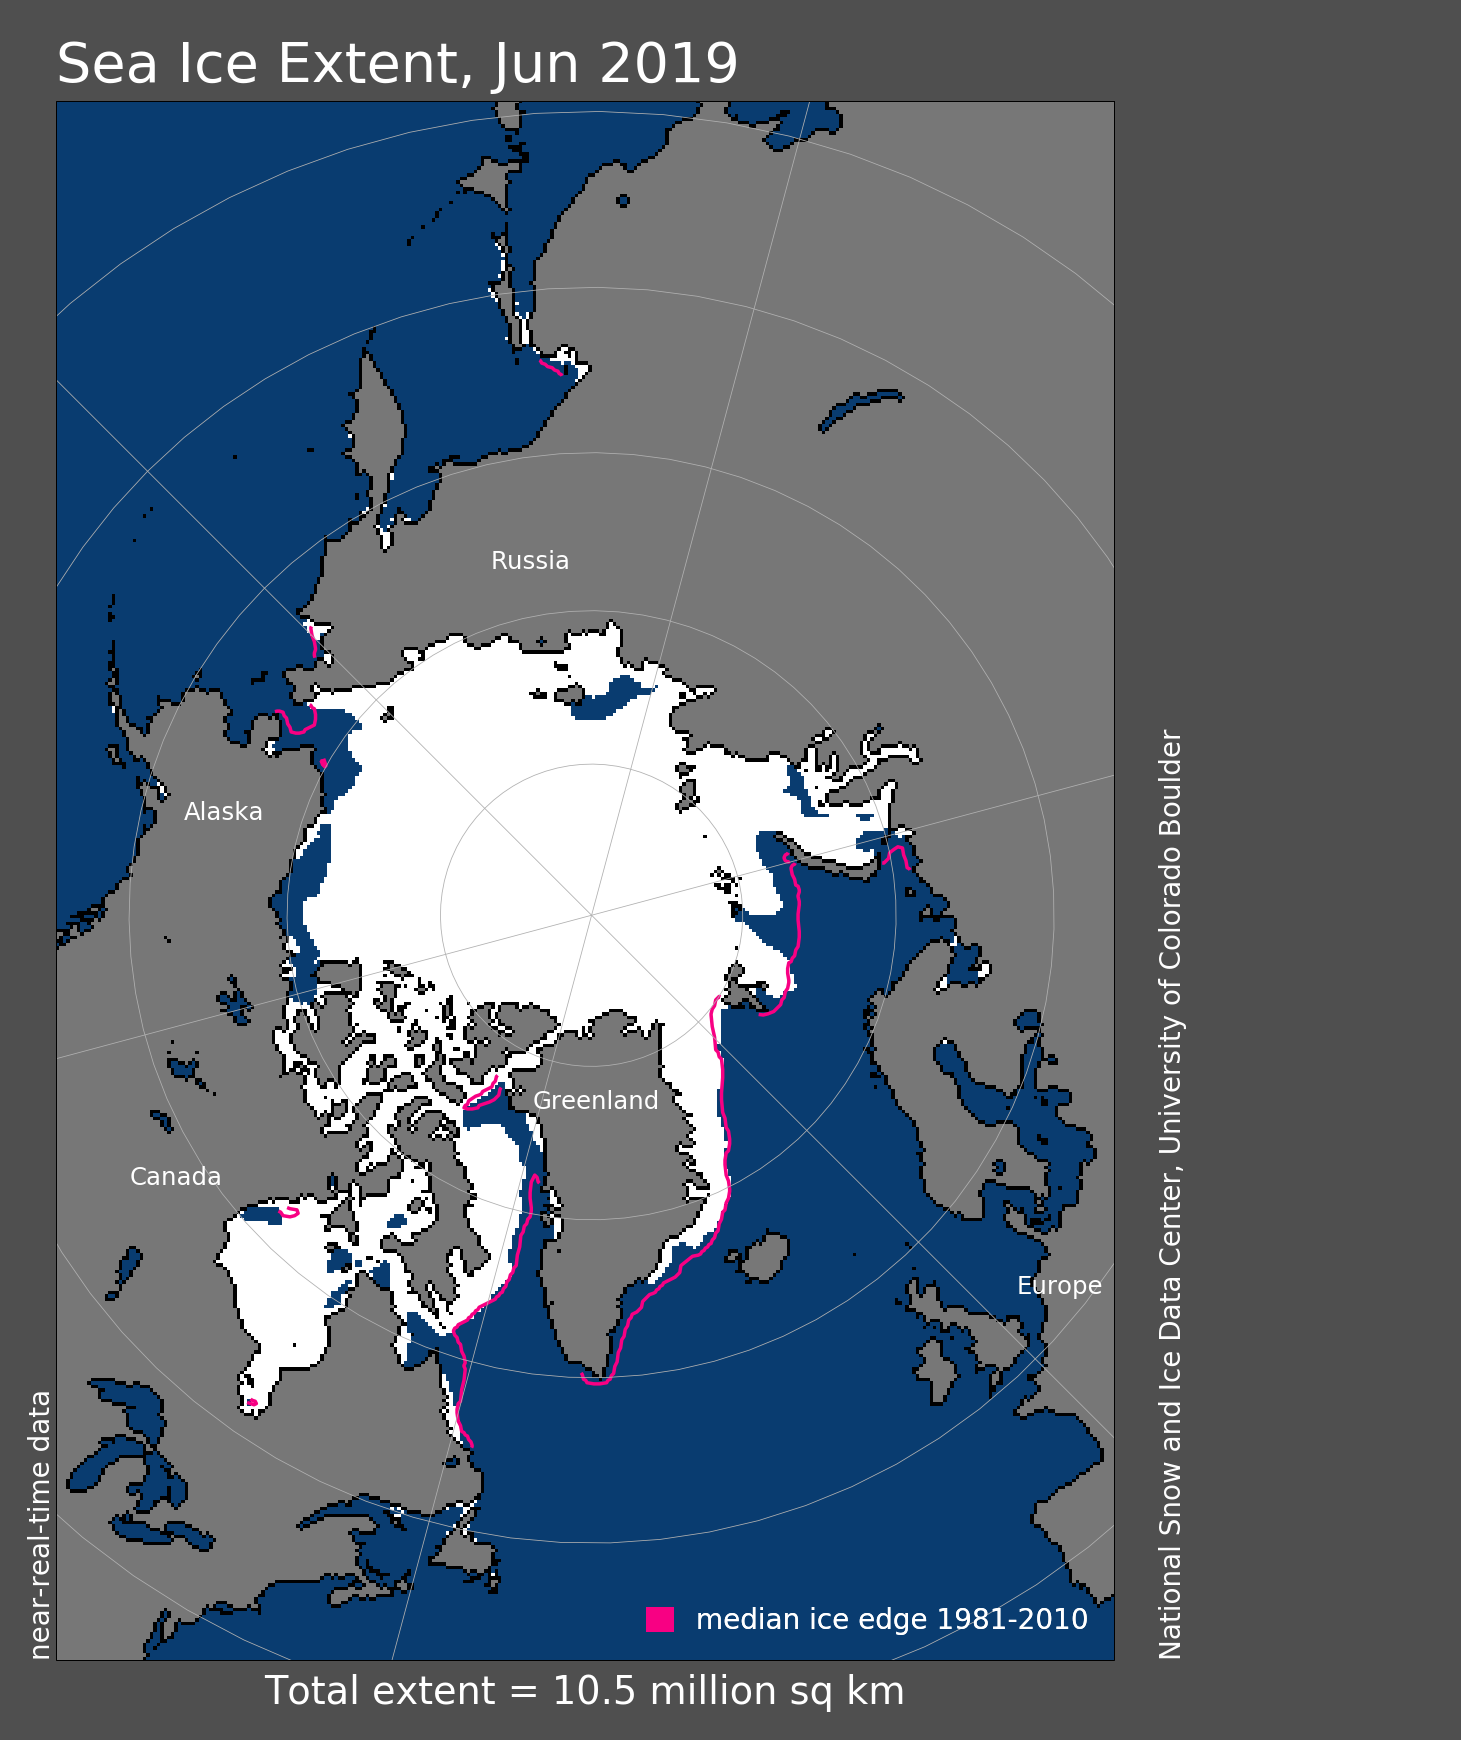
Figure 1. Arctic sea ice extent for July 15, 2019 was 7.84 million square kilometers (3.03 million square miles). The orange line shows the 1981 to 2010 average extent for that day. Sea Ice Index data. About the data
Credit: National Snow and Ice Data Center
High-resolution image
As of July 15, Arctic sea ice extent was 7.84 million square kilometers (3.03 million square miles). This is 1.91 million square kilometers (737,000 square miles) below the 1981 to 2010 average and nearly the same as the July 14, 2012 extent. Since the beginning of the month, the ice edge has receded in most coastal areas and the open water region in the Laptev Sea has expanded.
Conditions in context

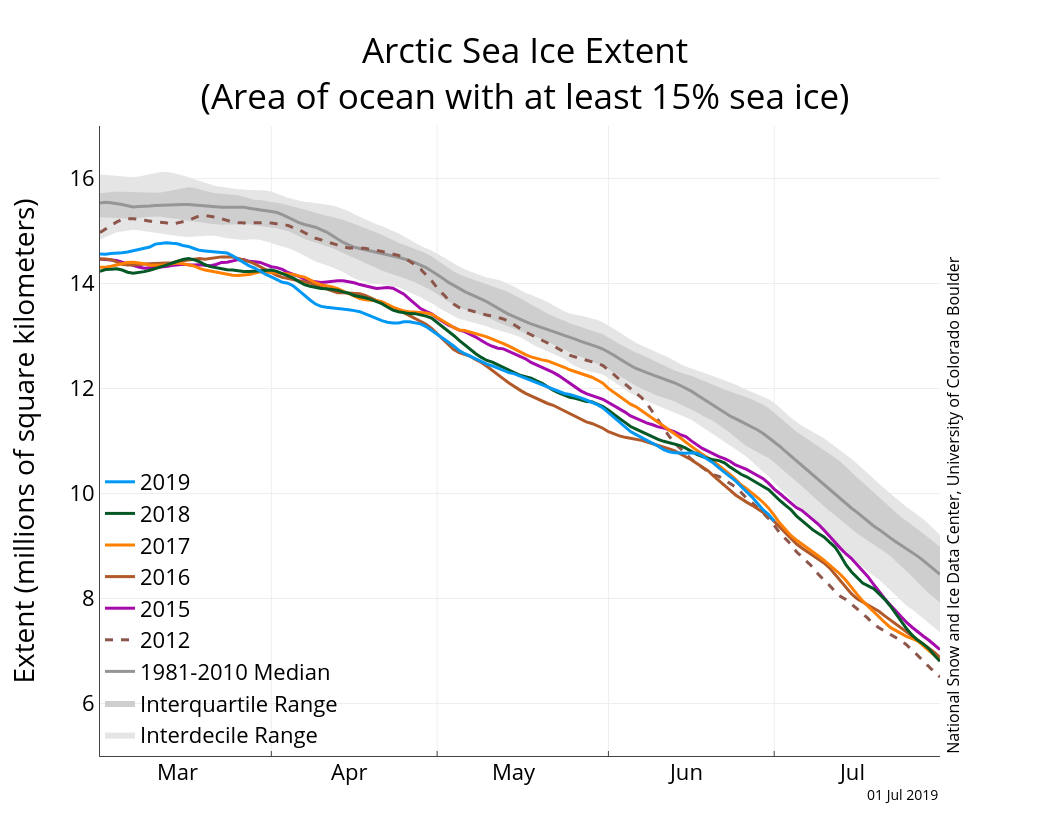
Figure 2a. The graph above shows Arctic sea ice extent as of July 15, 2019, along with daily ice extent data for four previous years and the record low year. 2019 is shown in blue, 2018 in green, 2017 in orange, 2016 in brown, 2015 in purple, and 2012 in dotted brown. The 1981 to 2010 median is in dark gray. The gray areas around the median line show the interquartile and interdecile ranges of the data. Sea Ice Index data.
Credit: National Snow and Ice Data Center
High-resolution image
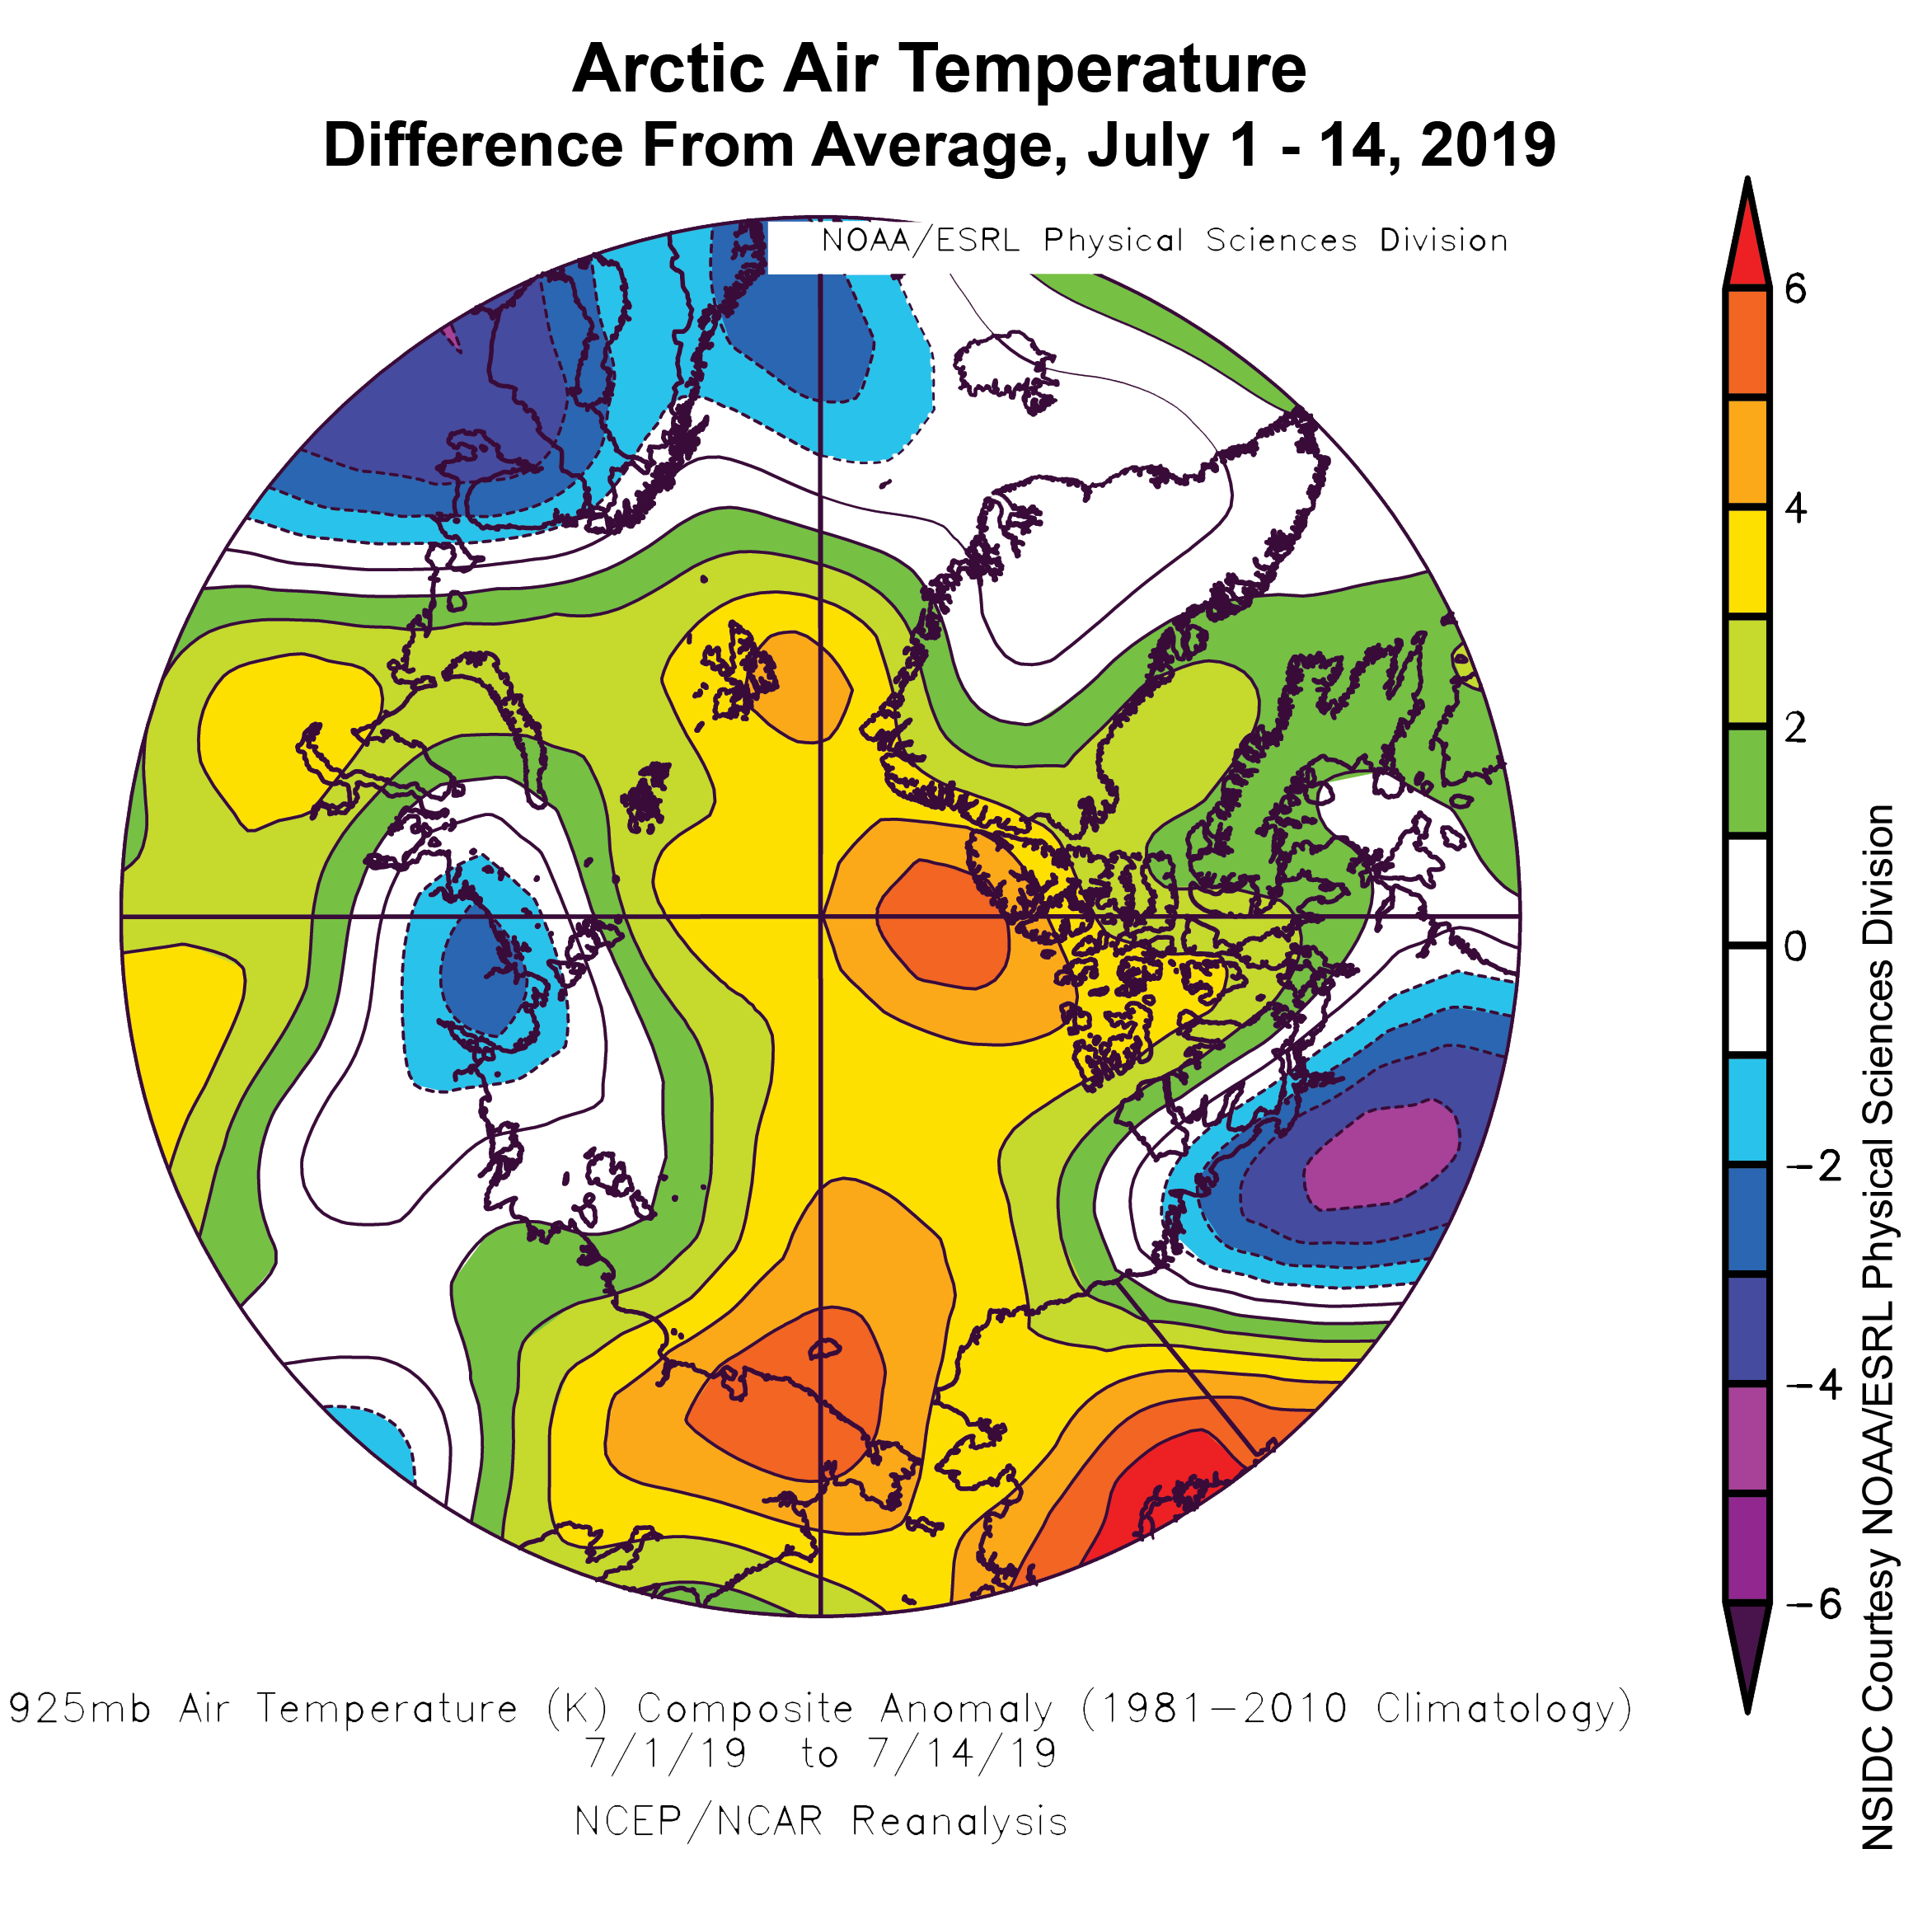
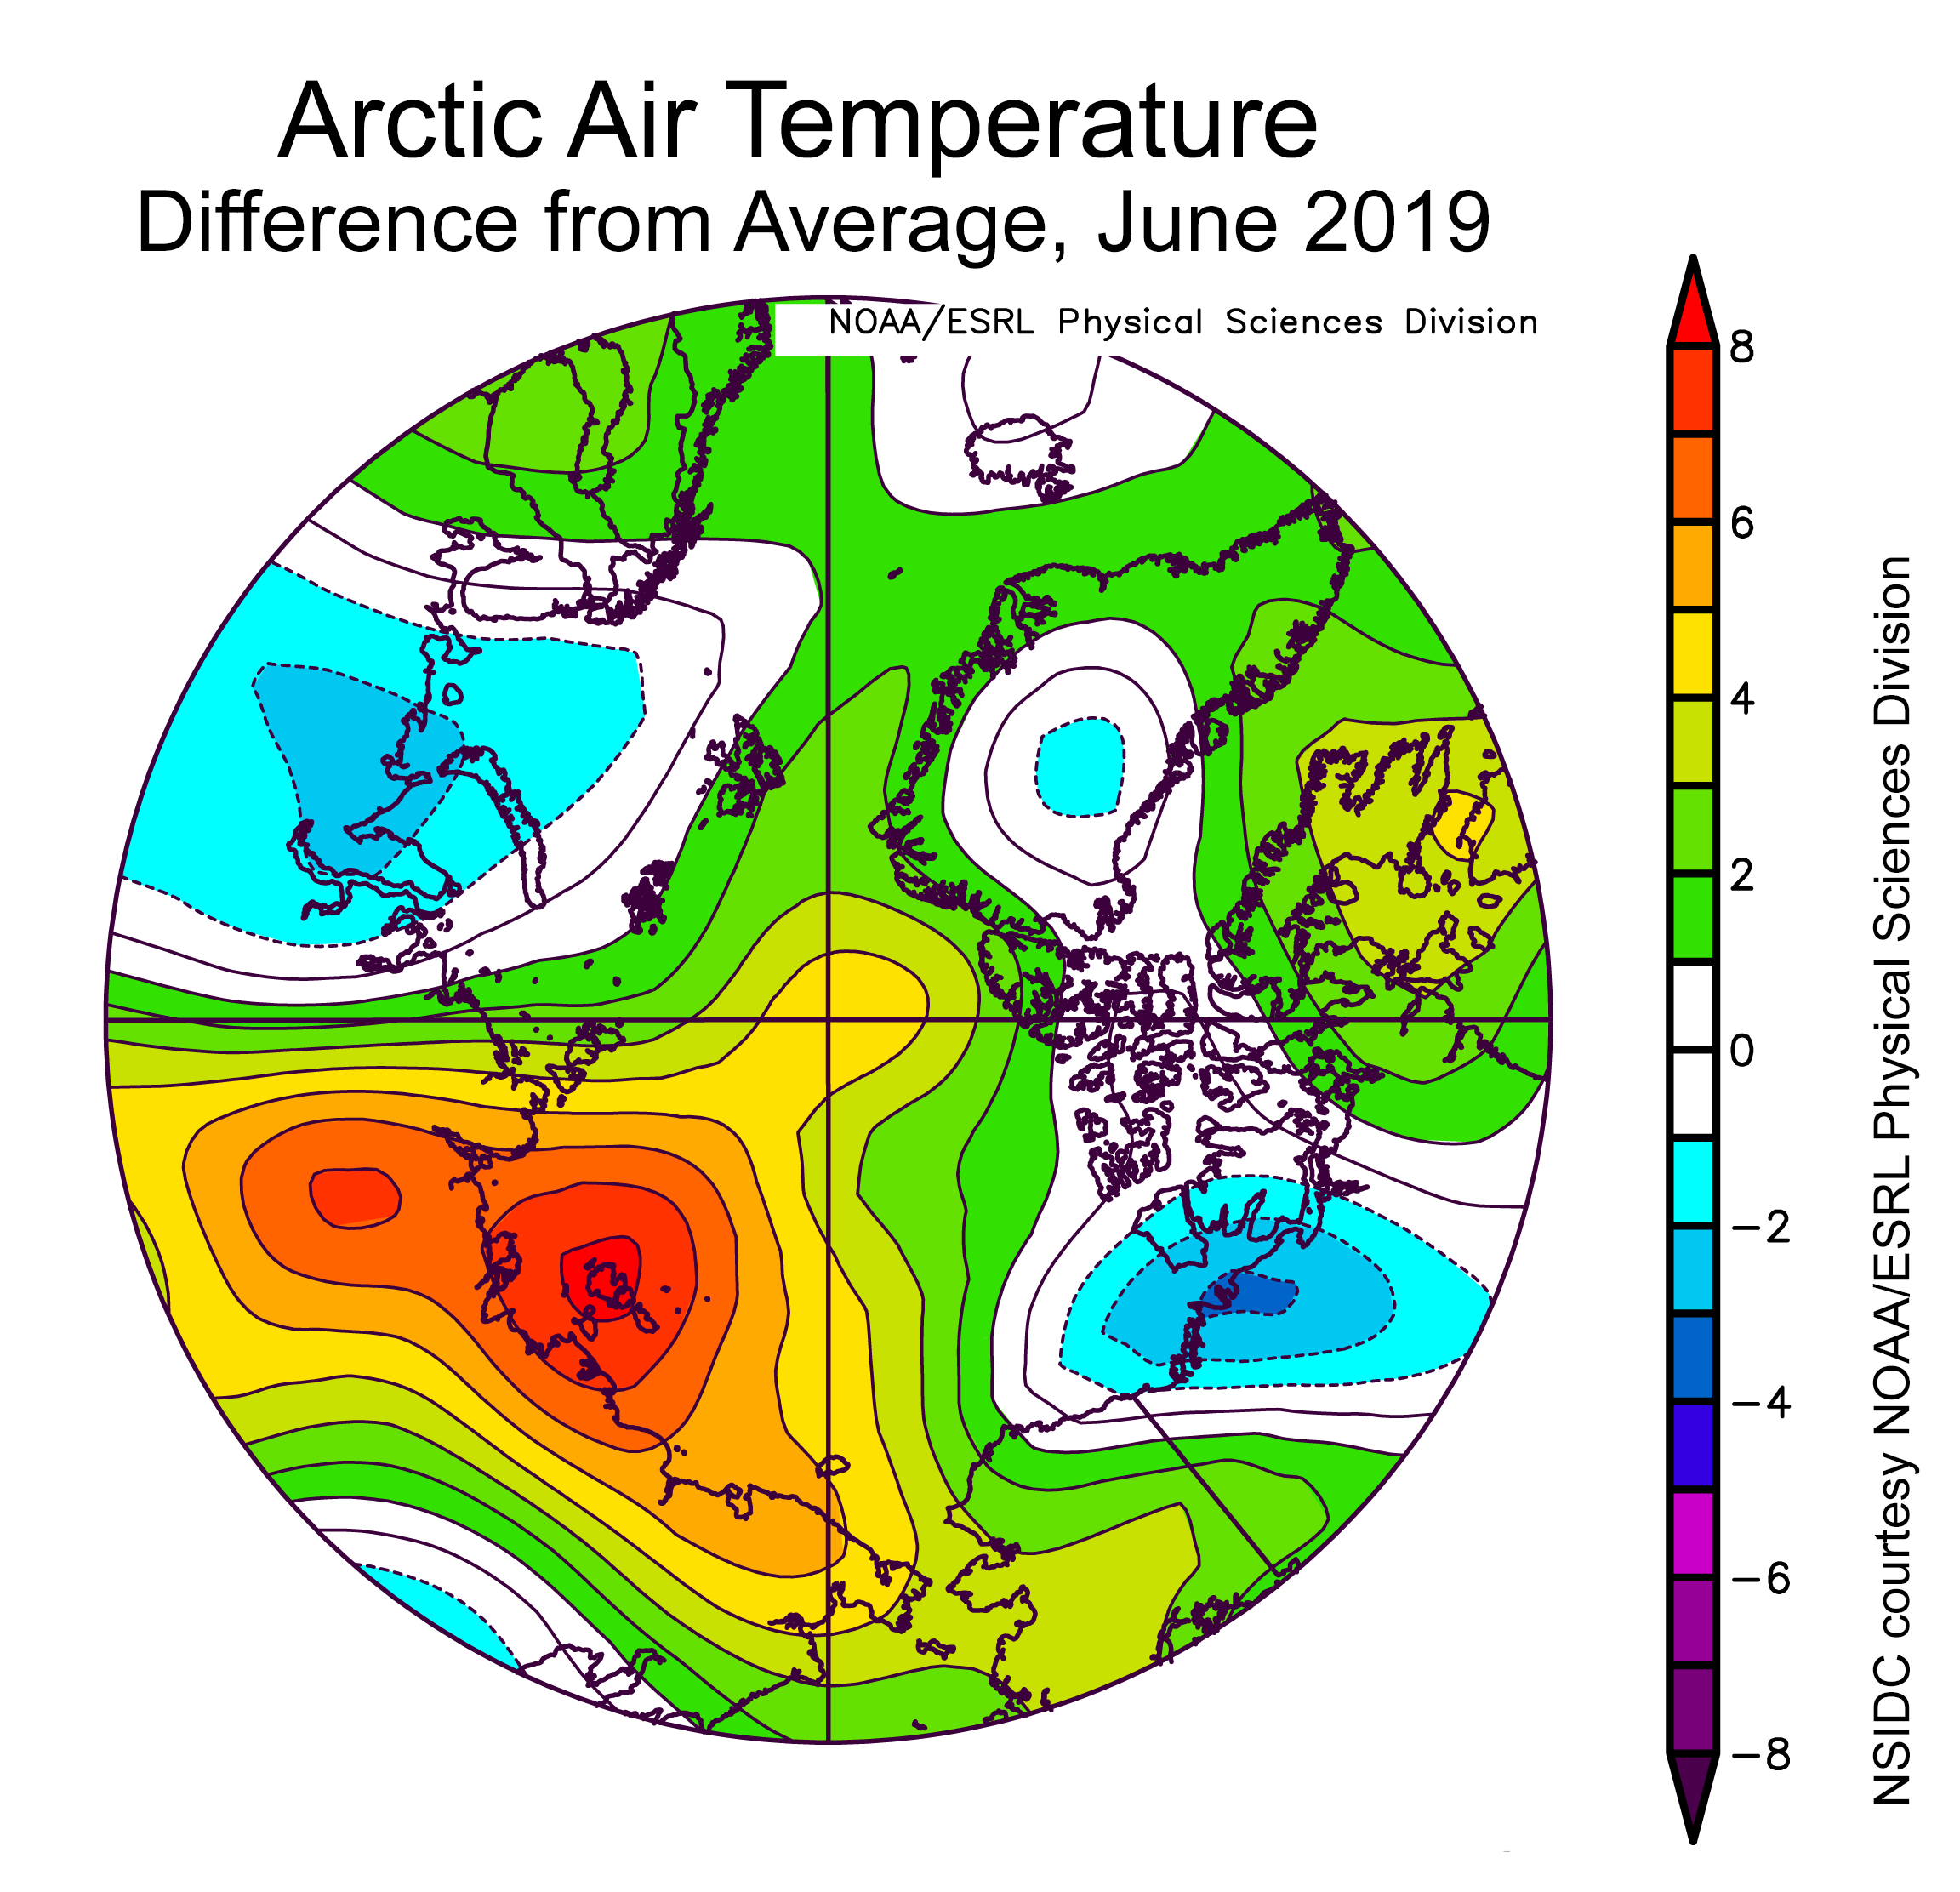
Figure 2b. This plot shows the departure from average air temperature in the Arctic at the 925 hPa level, in degrees Celsius, for July 1 – 14, 2019. Yellows and reds indicate higher than average temperatures; blues and purples indicate lower than average temperatures.
Credit: NSIDC courtesy NOAA Earth System Research Laboratory Physical Sciences Division
High-resolution image
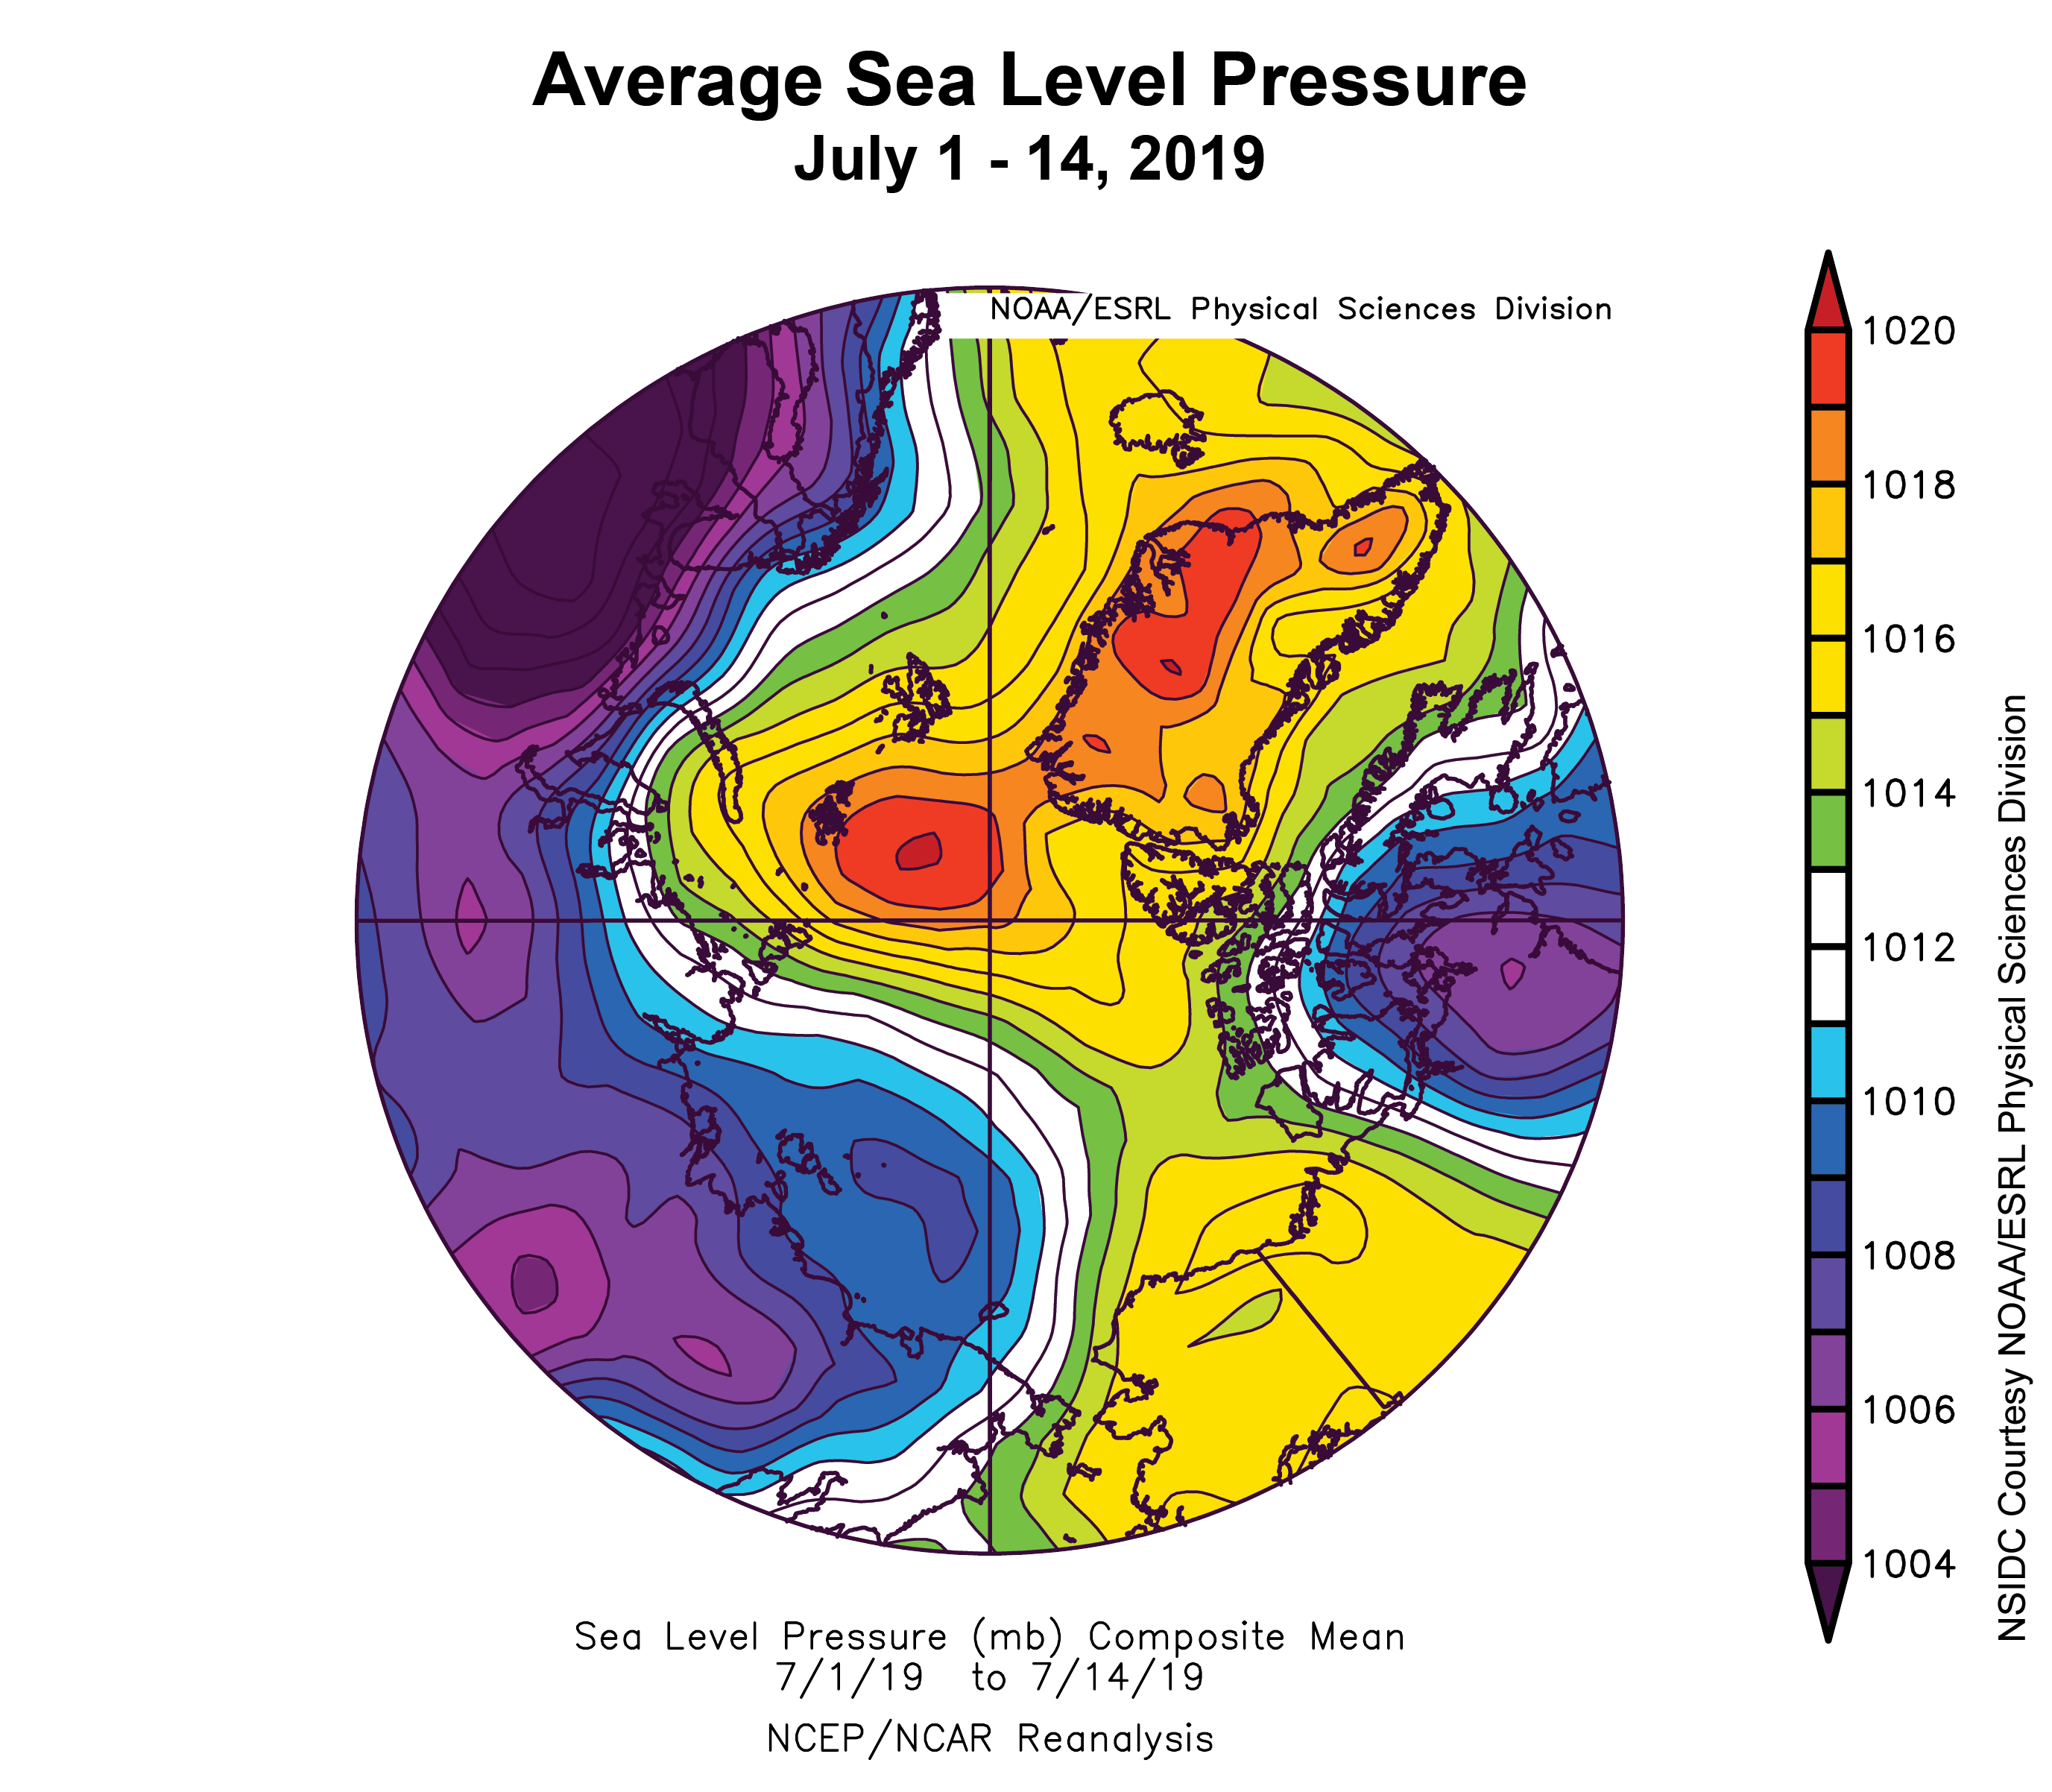
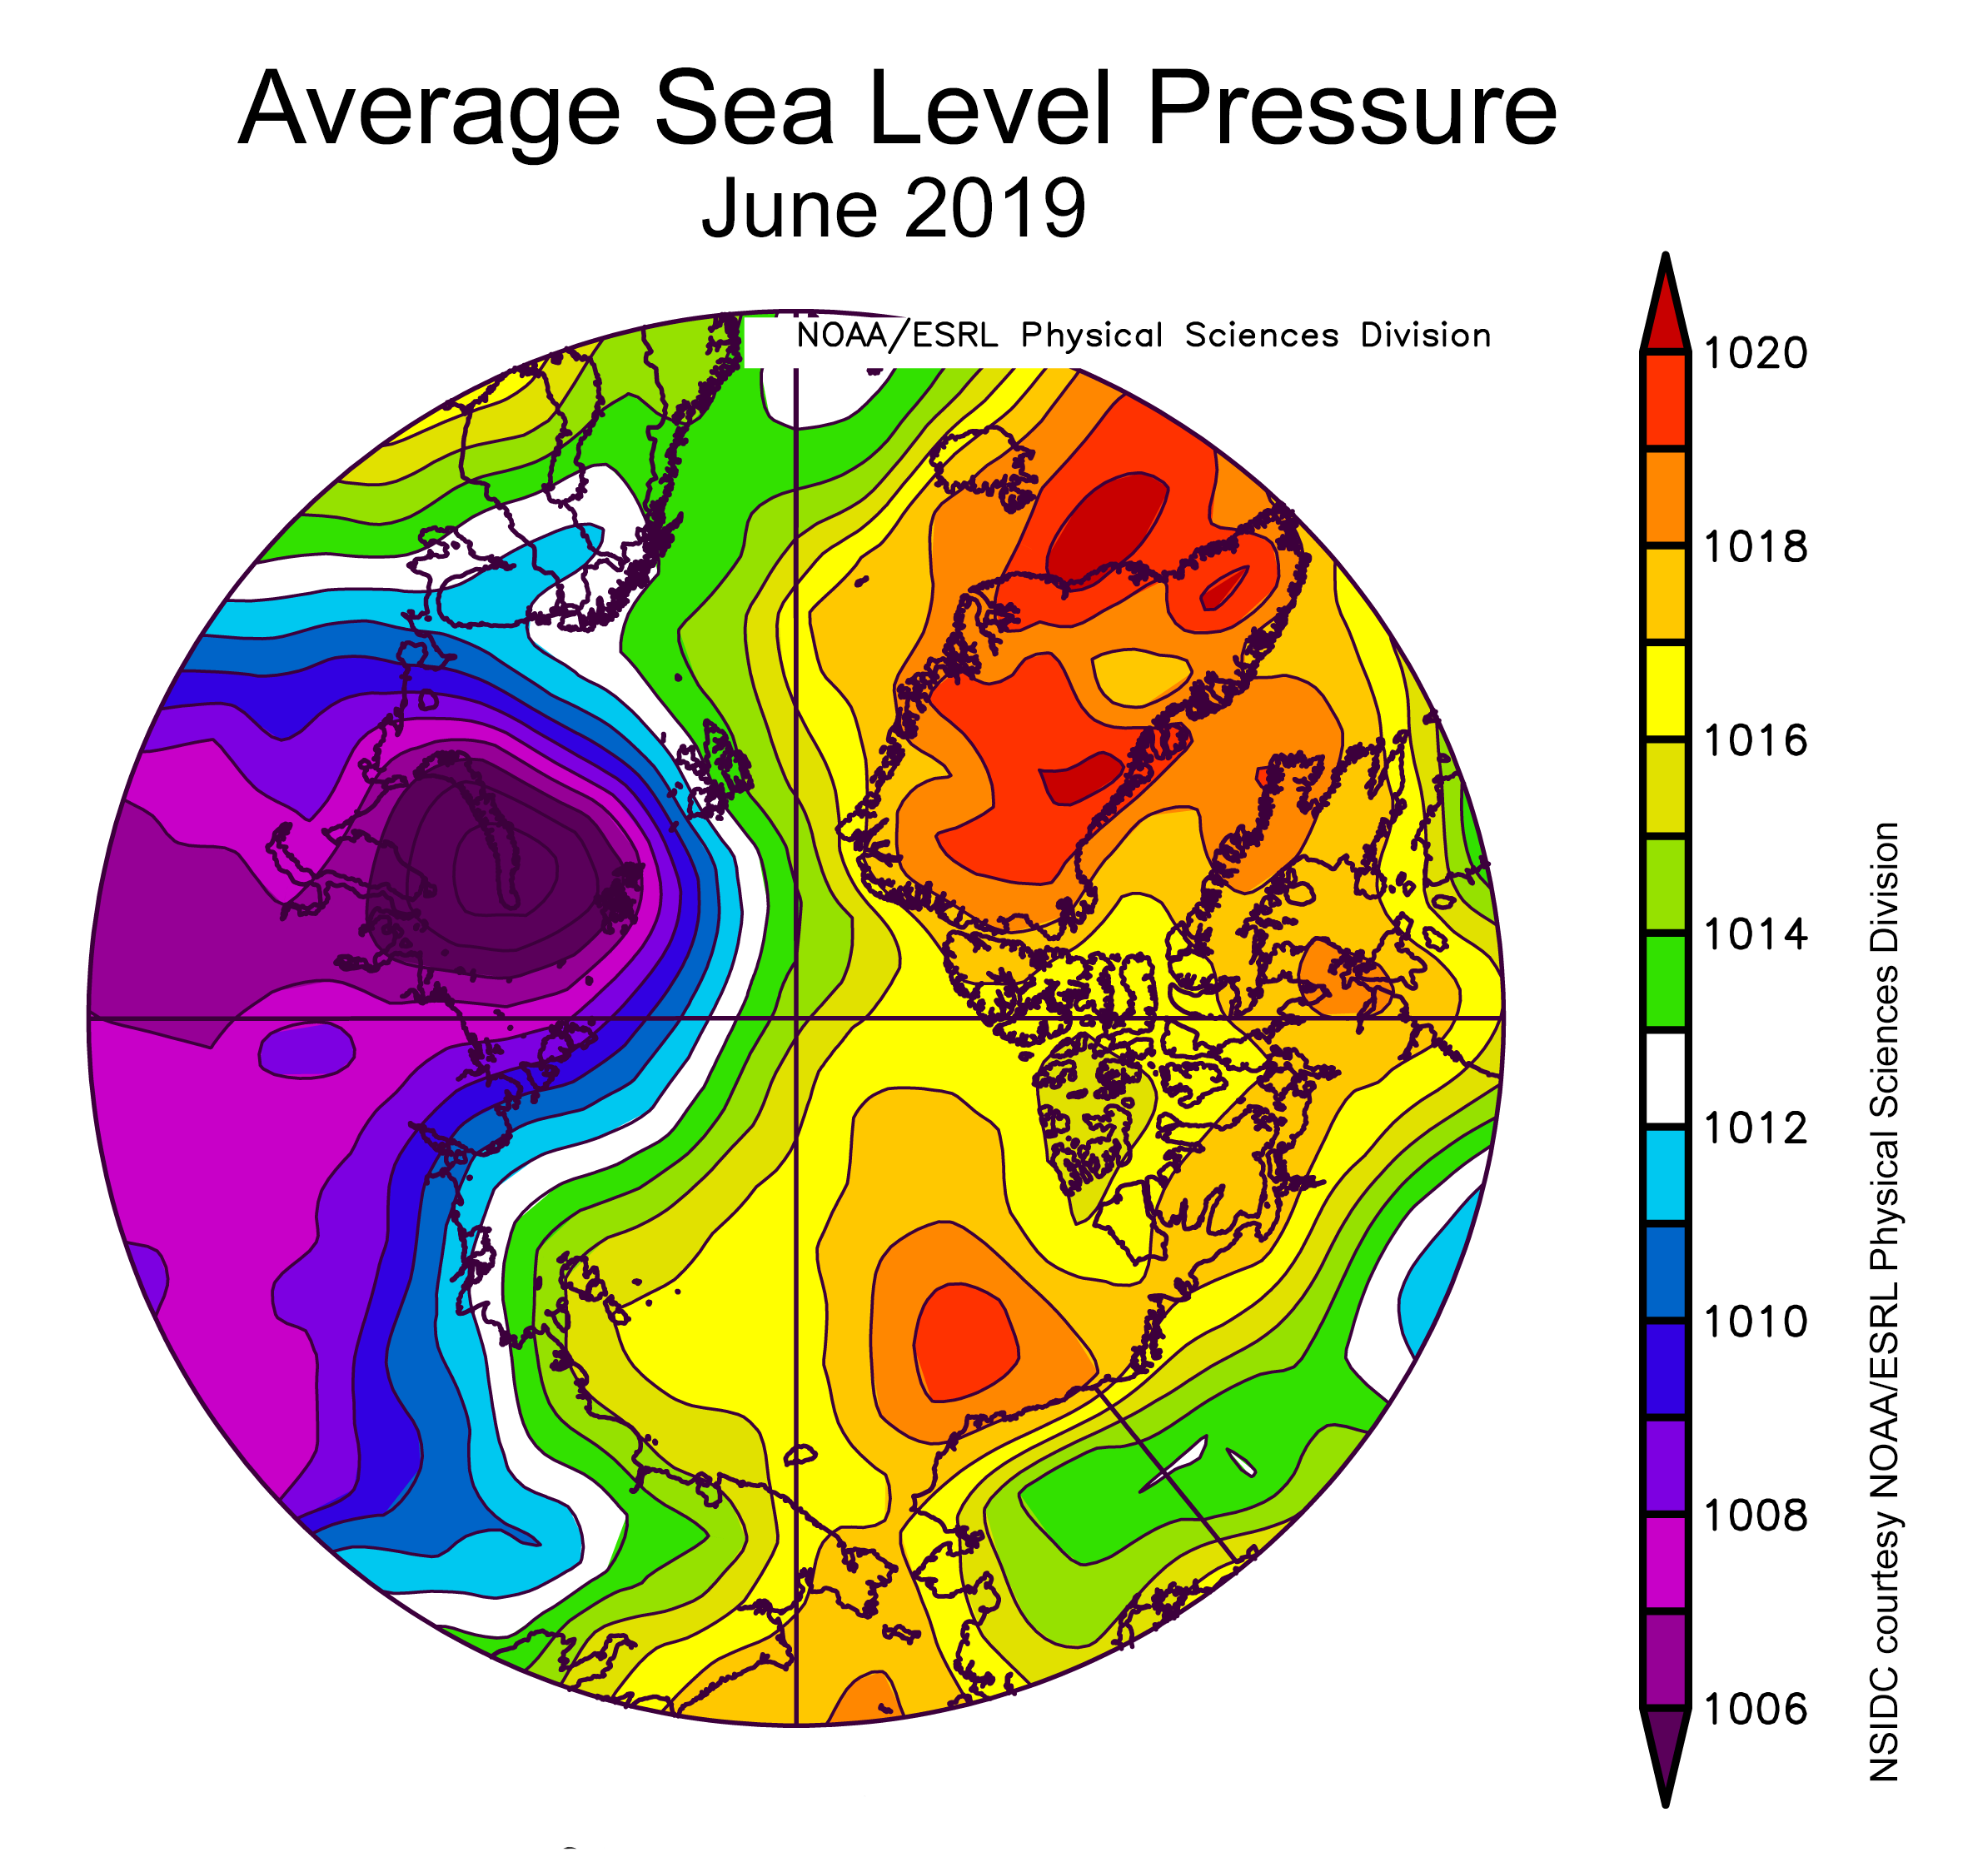
Figure 2c. This plot shows average sea level pressure in the Arctic in millibars (hPa) for July 1 – 14, 2019. Yellows and reds indicate high air pressure; blues and purples indicate low pressure.
Credit: NSIDC courtesy NOAA Earth System Research Laboratory Physical Sciences Division
High-resolution image
The first half of July is generally the period of most rapid ice loss. As averaged over the 1981 to 2010 period, extent drops 80,000 square kilometers (30,900 square miles) per day in the 1981 to 2010 climatology over this period. In recent years, daily loss rates have been higher. This year, most days during the first half of July had rates exceeding 100,000 square kilometers (38,600 square miles) per day, which is similar to what has been observed over the past several years.
It has been warm through mid-July, with air temperatures at the 925 hPa level (about 2,500 feet above the surface) averaging at least 3 degrees C (5 degrees F) above the 1981 to 2010 average over much of the Arctic Ocean and some areas, such as the Chukchi and East Siberian Seas, experiencing temperatures 5 degrees C (9 degrees F) above average. Alaska was subjected to especially warm conditions compared to average, with record highs being set throughout the state early in the month.
High pressure at sea level has persisted into July over the Arctic Ocean, resulting in fairly clear skies that are associated with enhanced surface melt.
Breakup in the Beaufort
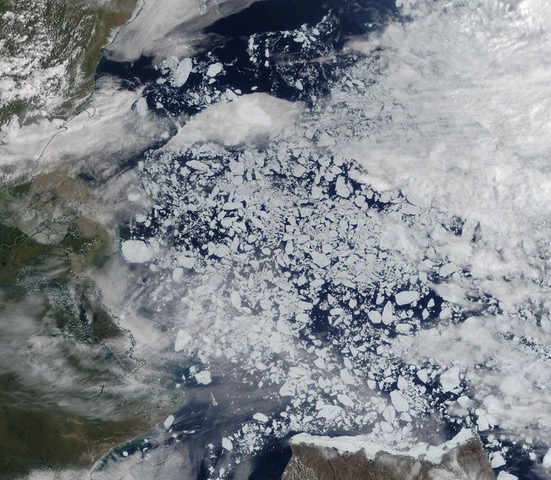
Figure 3a. This shows a true-color composite image of broken up sea ice in the Beaufort Sea, taken by the Moderate Resolution Imaging Spectroradiometer (MODIS) sensor on the NASA Terra satellite on July 8, 2019.
Credit: Land Atmosphere Near-Real Time Capability for EOS (LANCE) System, NASA/GSFC
High-resolution image
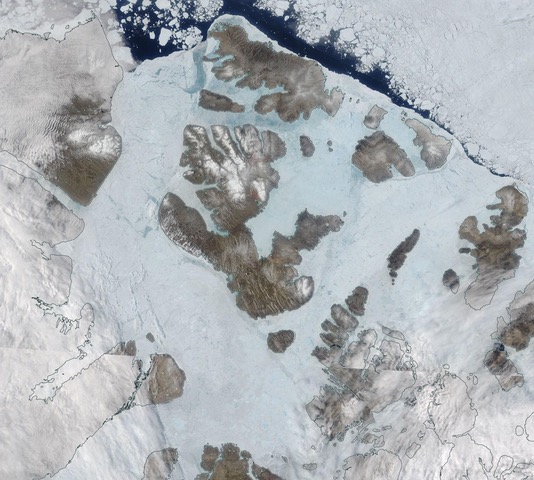
Figure 3b. This image from the NASA Moderate Resolution Imaging Spectroradiometer (MODIS) shows sea ice in the Canadian Archipelago on July 7, 2019. The blue hues indicate areas of widespread surface melt and melt ponds on the surface of the ice.
Credit: Land Atmosphere Near-Real Time Capability for EOS (LANCE) System, NASA/GSFC
High-resolution image
In the southwestern Beaufort Sea, numerous floes have broken away from the main pack ice and have been drifting southward. These will be encountering warm water and will be prone to rapid melt. Nearby in the Canadian Archipelago, the ice has turned a bluish tint in visible imagery, indicating significant surface melt and melt ponds. There is evidence of melt ponds elsewhere over the Arctic Ocean, particularly in the Laptev and East Siberian Seas.
Is a new record low in the offing?
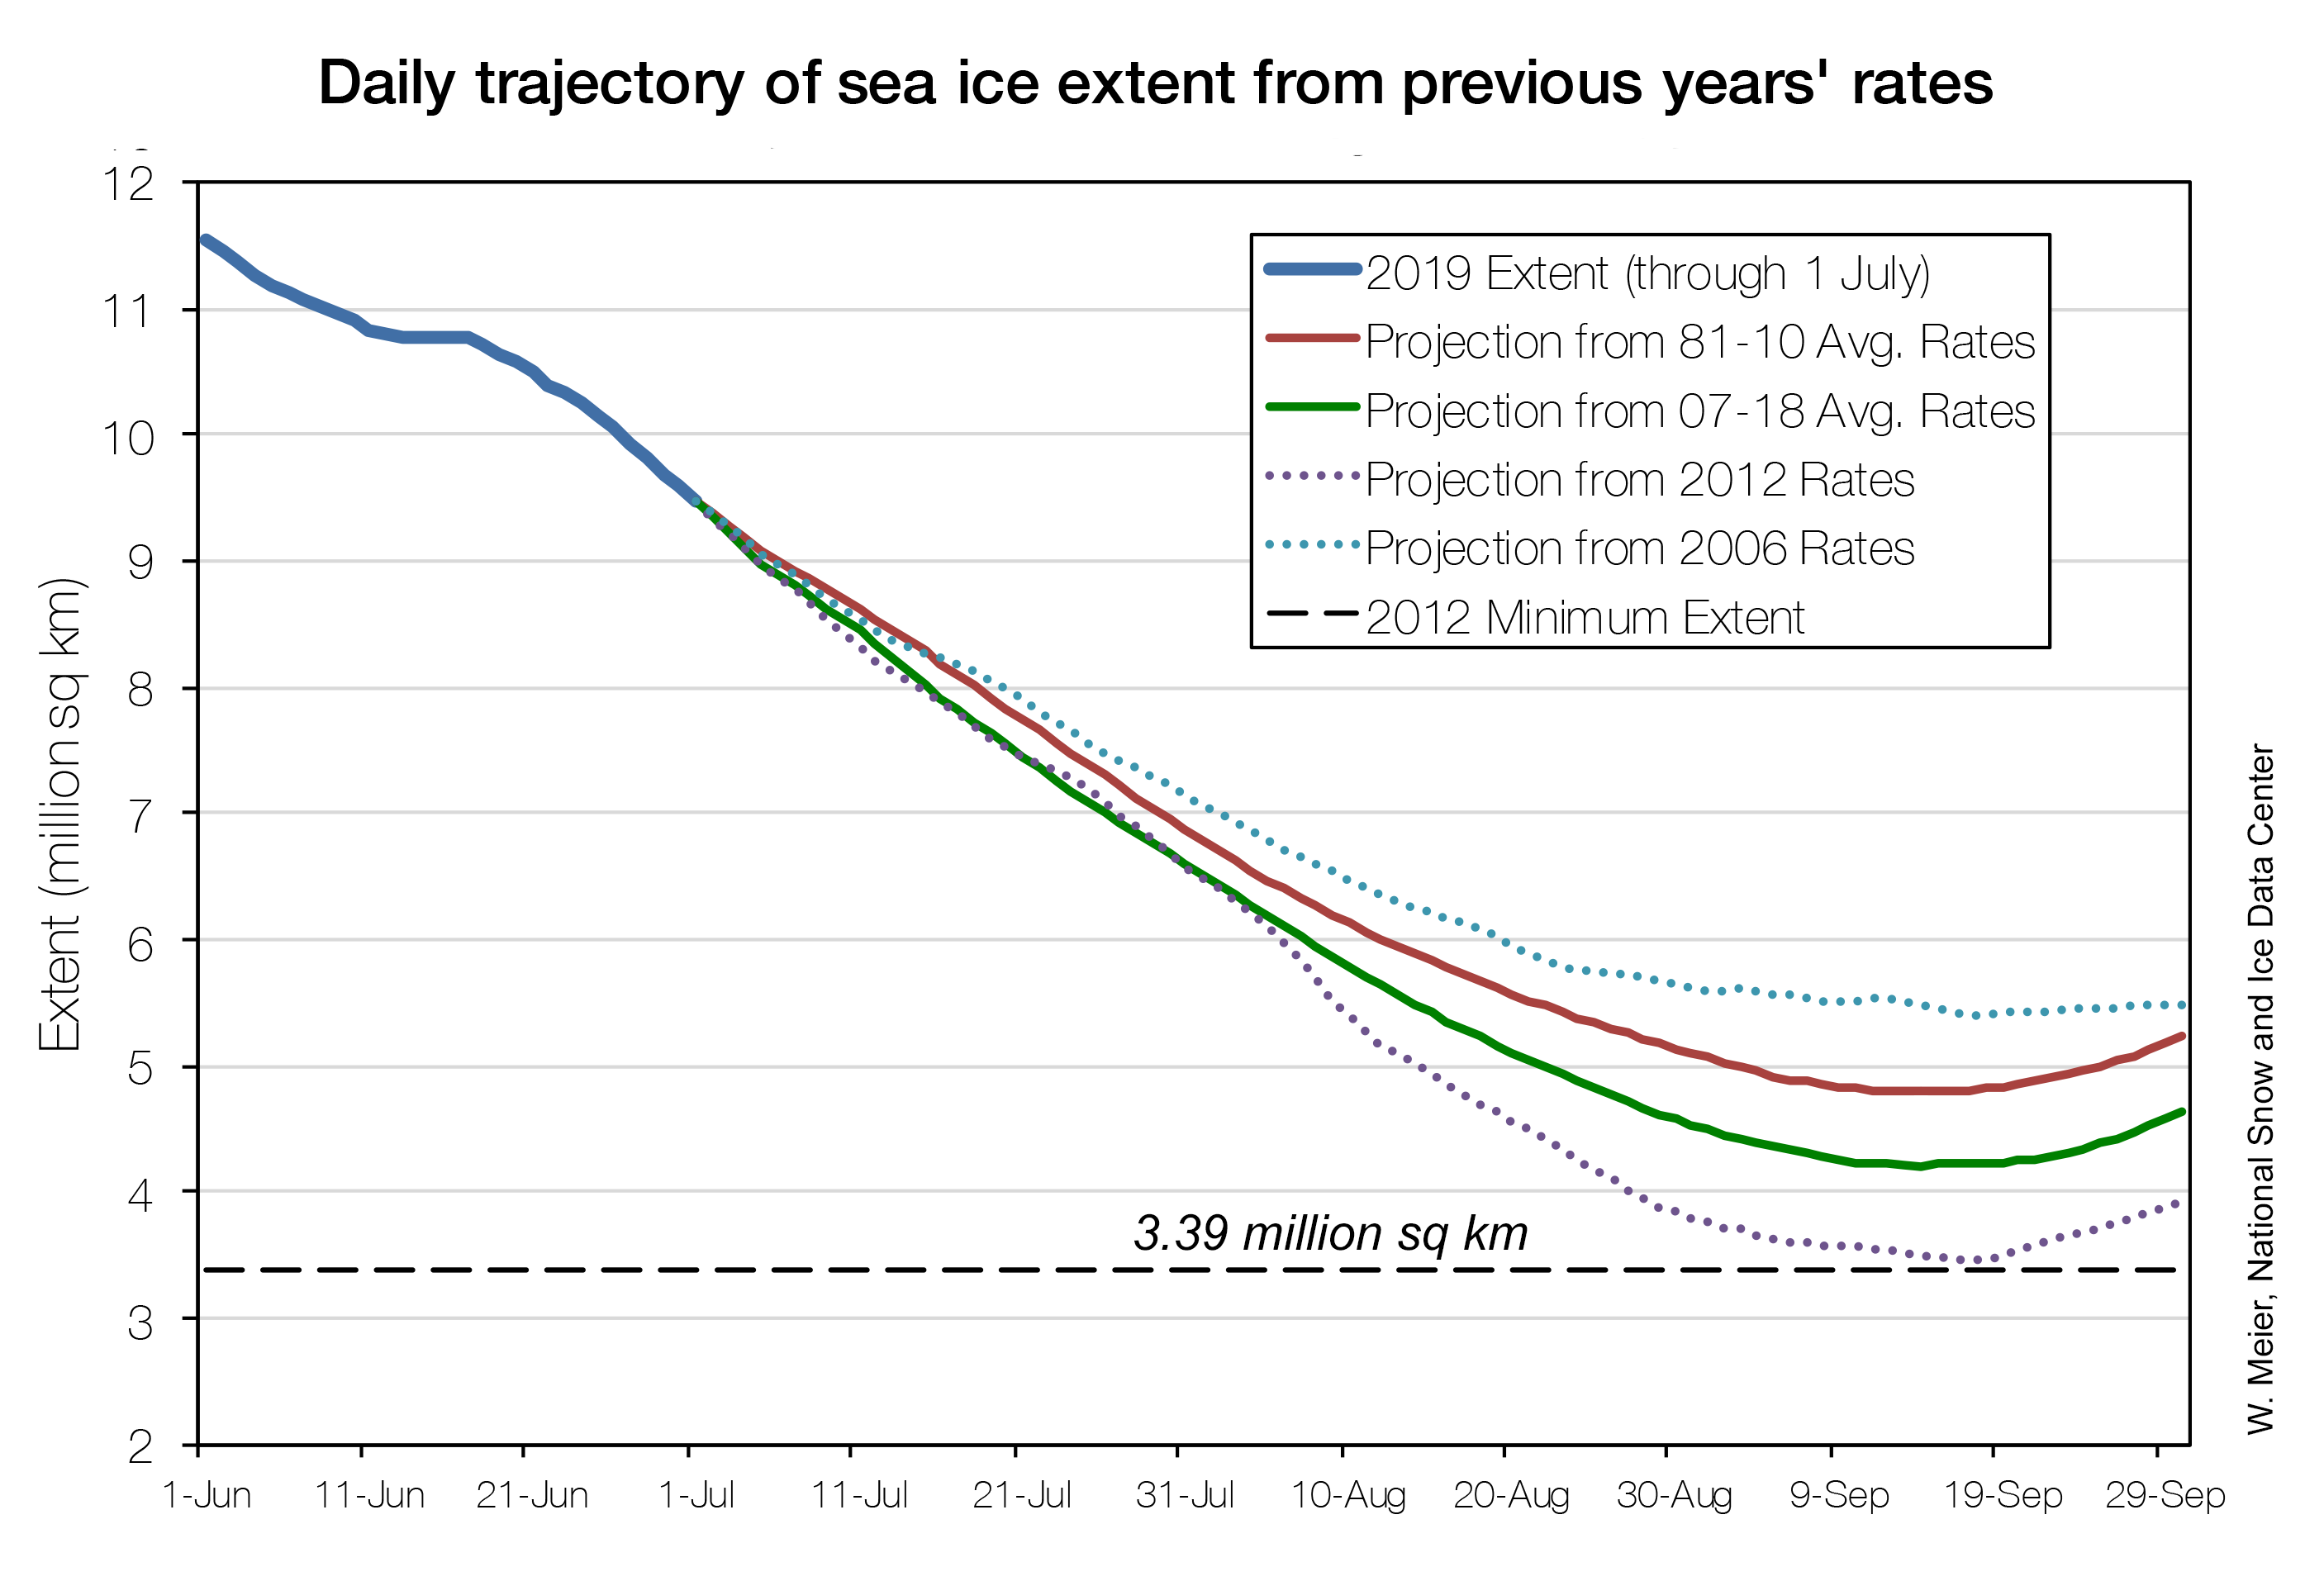
Figure 4. This figure compares 2019 projections of sea ice minimum extents based on rates of decline from previous years. The 2012 minimum extent of 3.39 million square kilometers (1.31 million square miles) is marked with a dashed black line. The red line uses the rate of decline from the 1981 to 2010 reference period. The green line uses the rate of decline from 2007 to 2018 average. The dotted purple line uses the 2012 rate of decline, and the dotted turquoise line uses the 2006 rate of decline.
Credit: W. Meier, NSIDC
High-resolution image
With extent tracking near 2012 levels and atmospheric conditions conducive to rapid ice loss, it is tempting to speculate whether September extent will drop below the record low observed in 2012. A simple way to investigate this possibility is to project forward from this year’s current extent using ice loss rates from other years to estimate extents through the remainder of the summer. Based on this approach, prospects of a new record low appear slim; a new record low would only occur if loss rates followed those observed in 2012, which were very rapid because of persistent warm conditions through the melt season, with ice loss potentially enhanced by the passage of a strong cyclone in August.
Sea ice age update
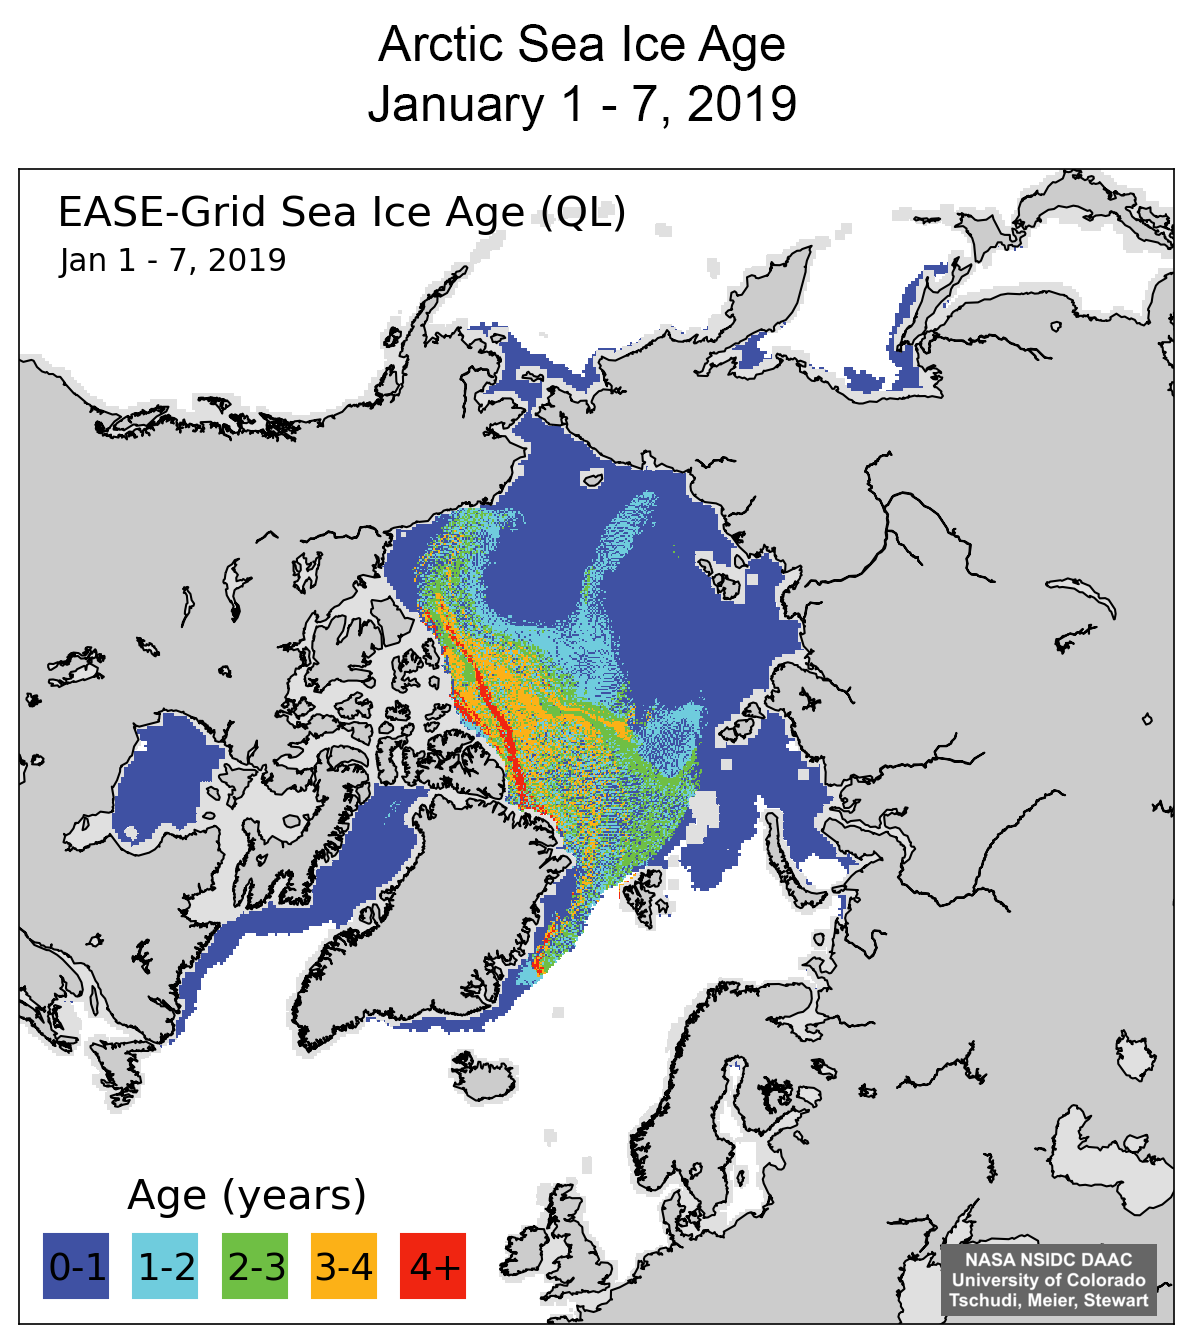
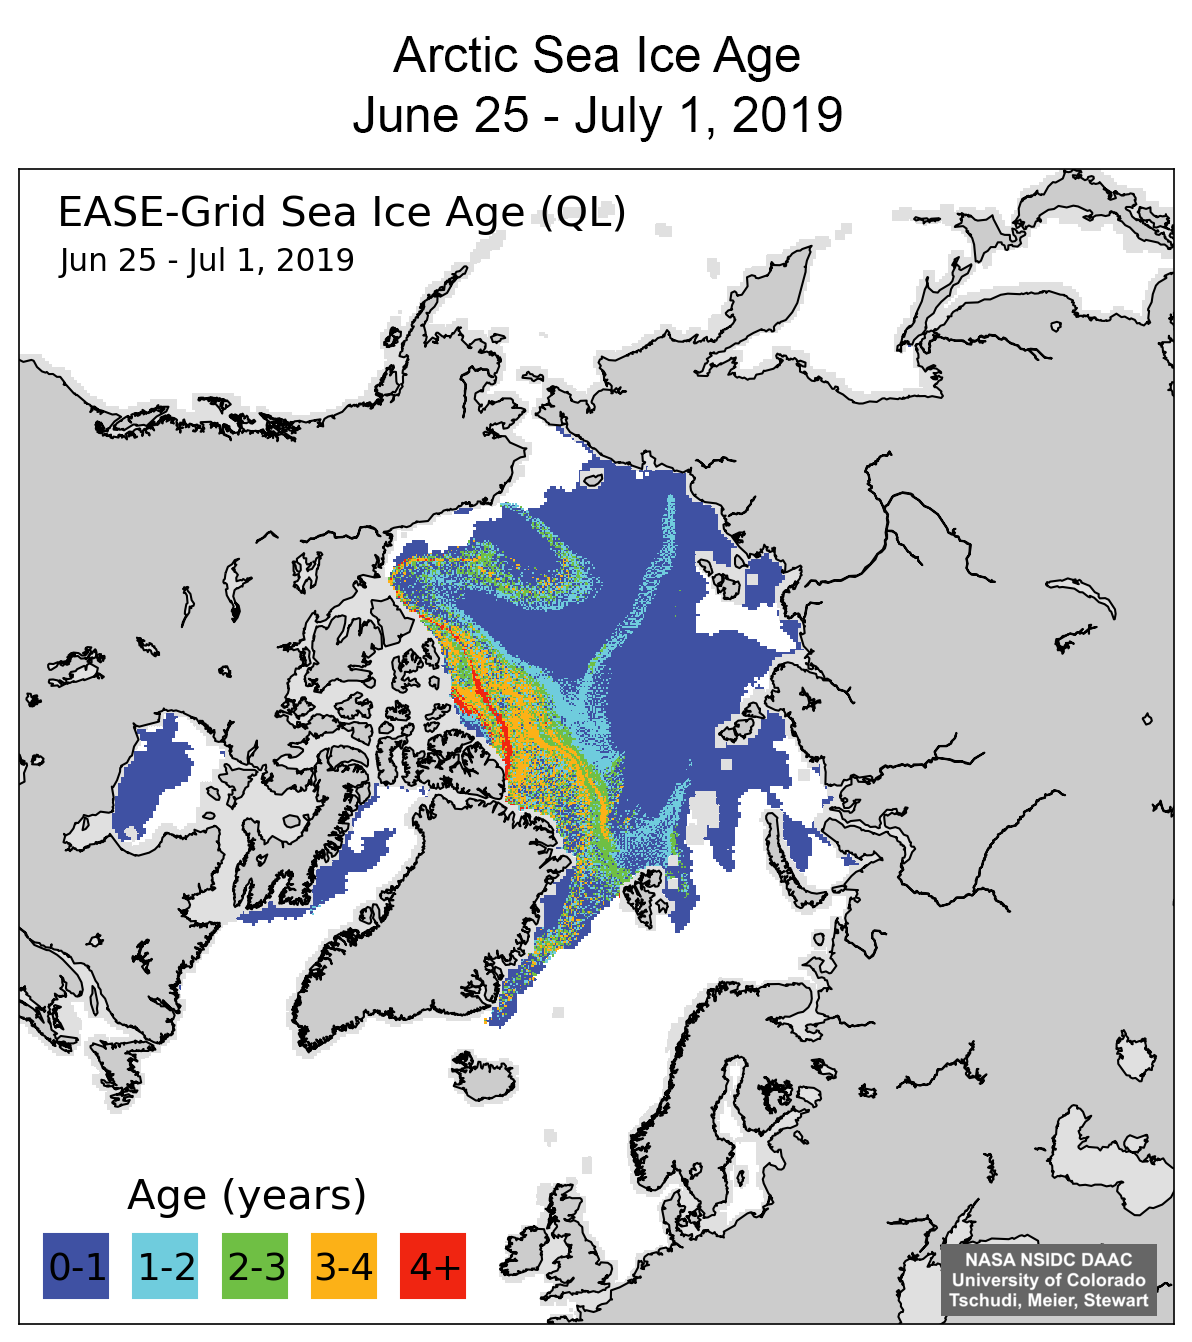
Figures 5a and b. The top map shows sea ice age for January 1 to 7, 2019, and the bottom map shows June 25 to July 1, 2019. The short tongue of ice in the eastern Beaufort Sea in January has been stretched and deformed into the “Z” shaped feature seen in the late June image. Quicklook data.
Credit: National Snow and Ice Data Center
High-resolution image
As of the beginning of July, large swaths of first-year ice covered the Arctic Ocean. Thicker, older ice is primarily found in a band between the North Pole, the Canadian Archipelago, and the northern Greenland coast. A narrow strip of second-year ice extends across the Pole into the East Siberian Sea. Another distinctive feature is a “Z” pattern of older ice in the Beaufort Sea induced by the clockwise Beaufort Gyre high pressure pattern, that transported ice eastward and northward over the course of the winter and spring. Some ice got “snagged” on Point Barrow, causing the pattern of old ice to deform into the “Z” shape. With so much first-year ice in the Arctic Ocean and roughly two months left of the melt season, there are many remaining areas of potential ice loss. But how much and where ice is lost will depend significantly on the weather patterns over the next eight weeks.