As of January 1, 2019, Antarctic sea ice extent had experienced several days of record lows. These record-low extents, which followed a period of rapid ice loss in December, exemplify the high seasonal and year-to-year variability in Antarctic sea ice. With six to eight weeks remaining in the melt season, it remains to be seen whether the present situation will persist and lead to a record-low annual minimum. A discussion of Arctic conditions will be posted next week.
Overview of conditions

Figure 1. Antarctic sea ice extent for January 1, 2019 was 5.47 million square kilometers (2.11 million square miles). The orange line shows the 1981 to 2010 average extent for the month. Sea Ice Index data. About the data
Credit: National Snow and Ice Data Center
High-resolution image
On January 1, Antarctic sea ice extent stood at 5.47 million square kilometers (2.11 million square miles), the lowest extent on this date in the 40-year satellite record. This value is 30,000 square kilometers (11,600 square miles) below the previous record low for January 1, set in 2017, and 1.88 million square kilometers (726,000 square miles) below the 1981 to 2010 average. Extent declined at a rate of 253,000 square kilometers (97,700 square miles) per day through December, considerably faster than the 1981 to 2010 mean for December of 214,000 square kilometers (82,600 square miles) per day. Indeed, the rate of Antarctic ice extent loss for December 2018 is the fastest in the satellite record, albeit close to 2010 and 2005.
Conditions in context
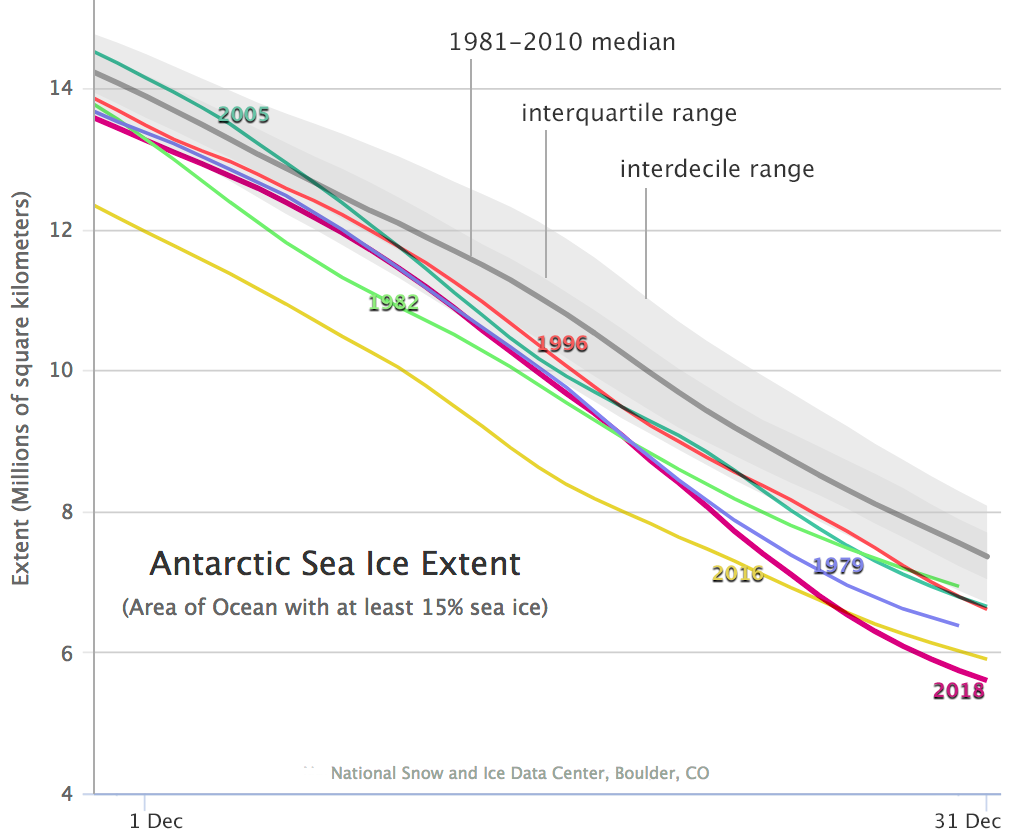
Figure 2: Derived from NSIDC’s Charctic tool, this time series compares the six lowest December extents for Antarctic sea ice. For the 40-year satellite record, the years coming closest to the 2018 extent are 1979 and 2016. Note that the extent lines for 1979 and 1982 end on December 30 because older satellite sensors only collected data every other day. The absence of any late or early tendency in the lowest December extents indicates the lack of an overall trend in Antarctic sea ice.
Credit: W. Meier, NSIDC
High-resolution image
On December 26, Antarctic sea ice extent fell below the low mark for this date, set in 2016, and has continued to track below all other years. Notably, the November to December 2016 period was considered an extreme excursion of Antarctic sea ice at the time. However, since then Antarctic sea ice extent has continually remained below the 1981 to 2010 median and mostly below the interquartile extent (below 75 percent of the 30-year range of values). This change in behavior, which began during the austral spring of 2016, contradicts prior characterizations of Antarctic sea ice cover as slowly expanding, yet highly variable. Instead, another strong decline through late December 2018 has taken the extent below the November and December 2016 levels to new record lows. Antarctica’s high year-to-year variability (record high extents for December were observed as recently as 2014 and 2007) suggests that a conclusive sea ice trend associated with the warming air and ocean around Antarctica has yet to reveal itself.
Spatial patterns of loss

Figure 3a. This maps shows the difference between Antarctic sea ice extent on December 1, 2018, and January 1, 2019.
Credit: W. Meier, NSIDC
High-resolution image
The rapid ice loss through December 2018 and into early January 2019 has exposed large areas of the Southern Ocean that are typically ice-covered at this time of year. At the beginning of December 2018, a substantial band of ice ringed most of the Antarctic continent, although regions of open water had begun to appear along portions of the coast near the Amery Ice Shelf and within the ice pack to the east of the Weddell Sea (Figure 3a). Despite being ice-covered at the beginning of the month, concentrations were quite low in the eastern Weddell, eastern Ross Sea, and the region north (and to either side) of the Amery. These areas have since melted out completely. Many other areas of low concentration ice remain, particularly in the northeastern Weddell Sea and the northern Ross Sea (Figure 3b). These areas are expected to melt out soon.
Six to eight weeks remain in the Antarctic melt season. Whether the record low daily extents now being seen will persist and lead to a record seasonal minimum cannot be predicted.
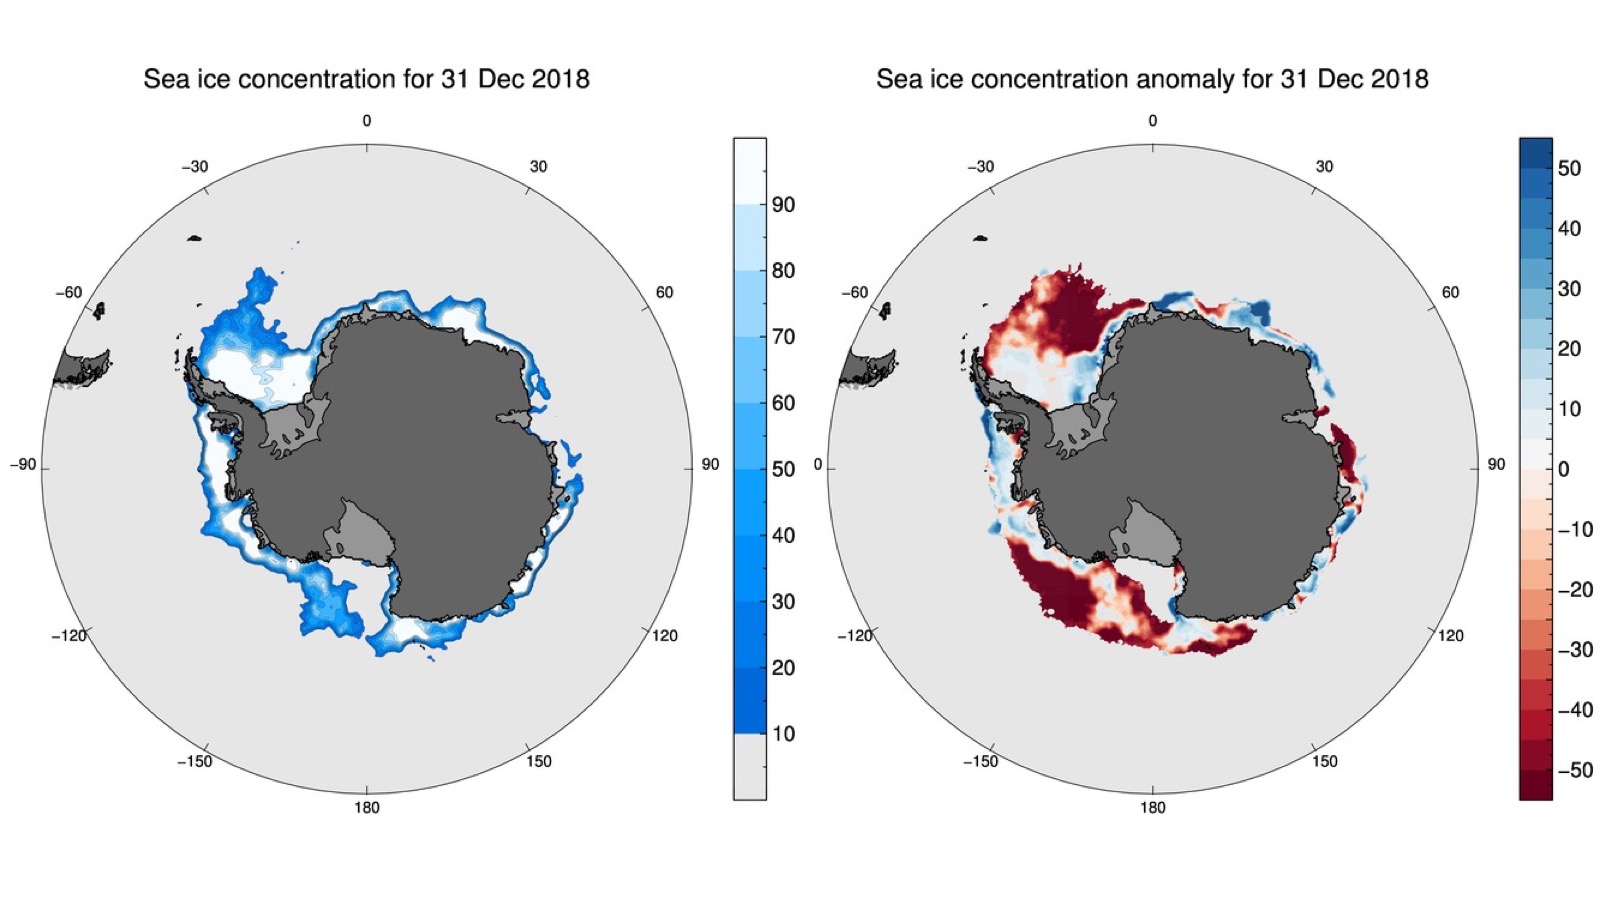
Figure 3b. These maps show sea ice concentration (left) and sea ice concentration anomaly, or difference from average (right), for December 31, 2018. In the right map, blues indicate higher than average sea ice concentrations; reds indicate lower than average concentrations.
Figure courtesy of Phil Reid, Australian Bureau of Meteorology. Sea ice concentration data from NSIDC.
High-resolution image
Although it is too soon for us to isolate what caused the rapid December decline and recent record low extents, it is likely that unusual atmospheric conditions and high sea surface temperatures—important factors in the 2016 and 2017 record lows—are playing a role. Unfortunately, as of this post our usual source of atmospheric data is not accessible due to the US government shutdown. NSIDC will continue to monitor the low ice conditions in the Antarctic and will provide updated analyses through the austral summer.

