The seasonal minimum of Arctic sea ice extent is imminent; extent at the minimum is likely to be the sixth lowest in the satellite record, tied with 2008.
Overview of conditions
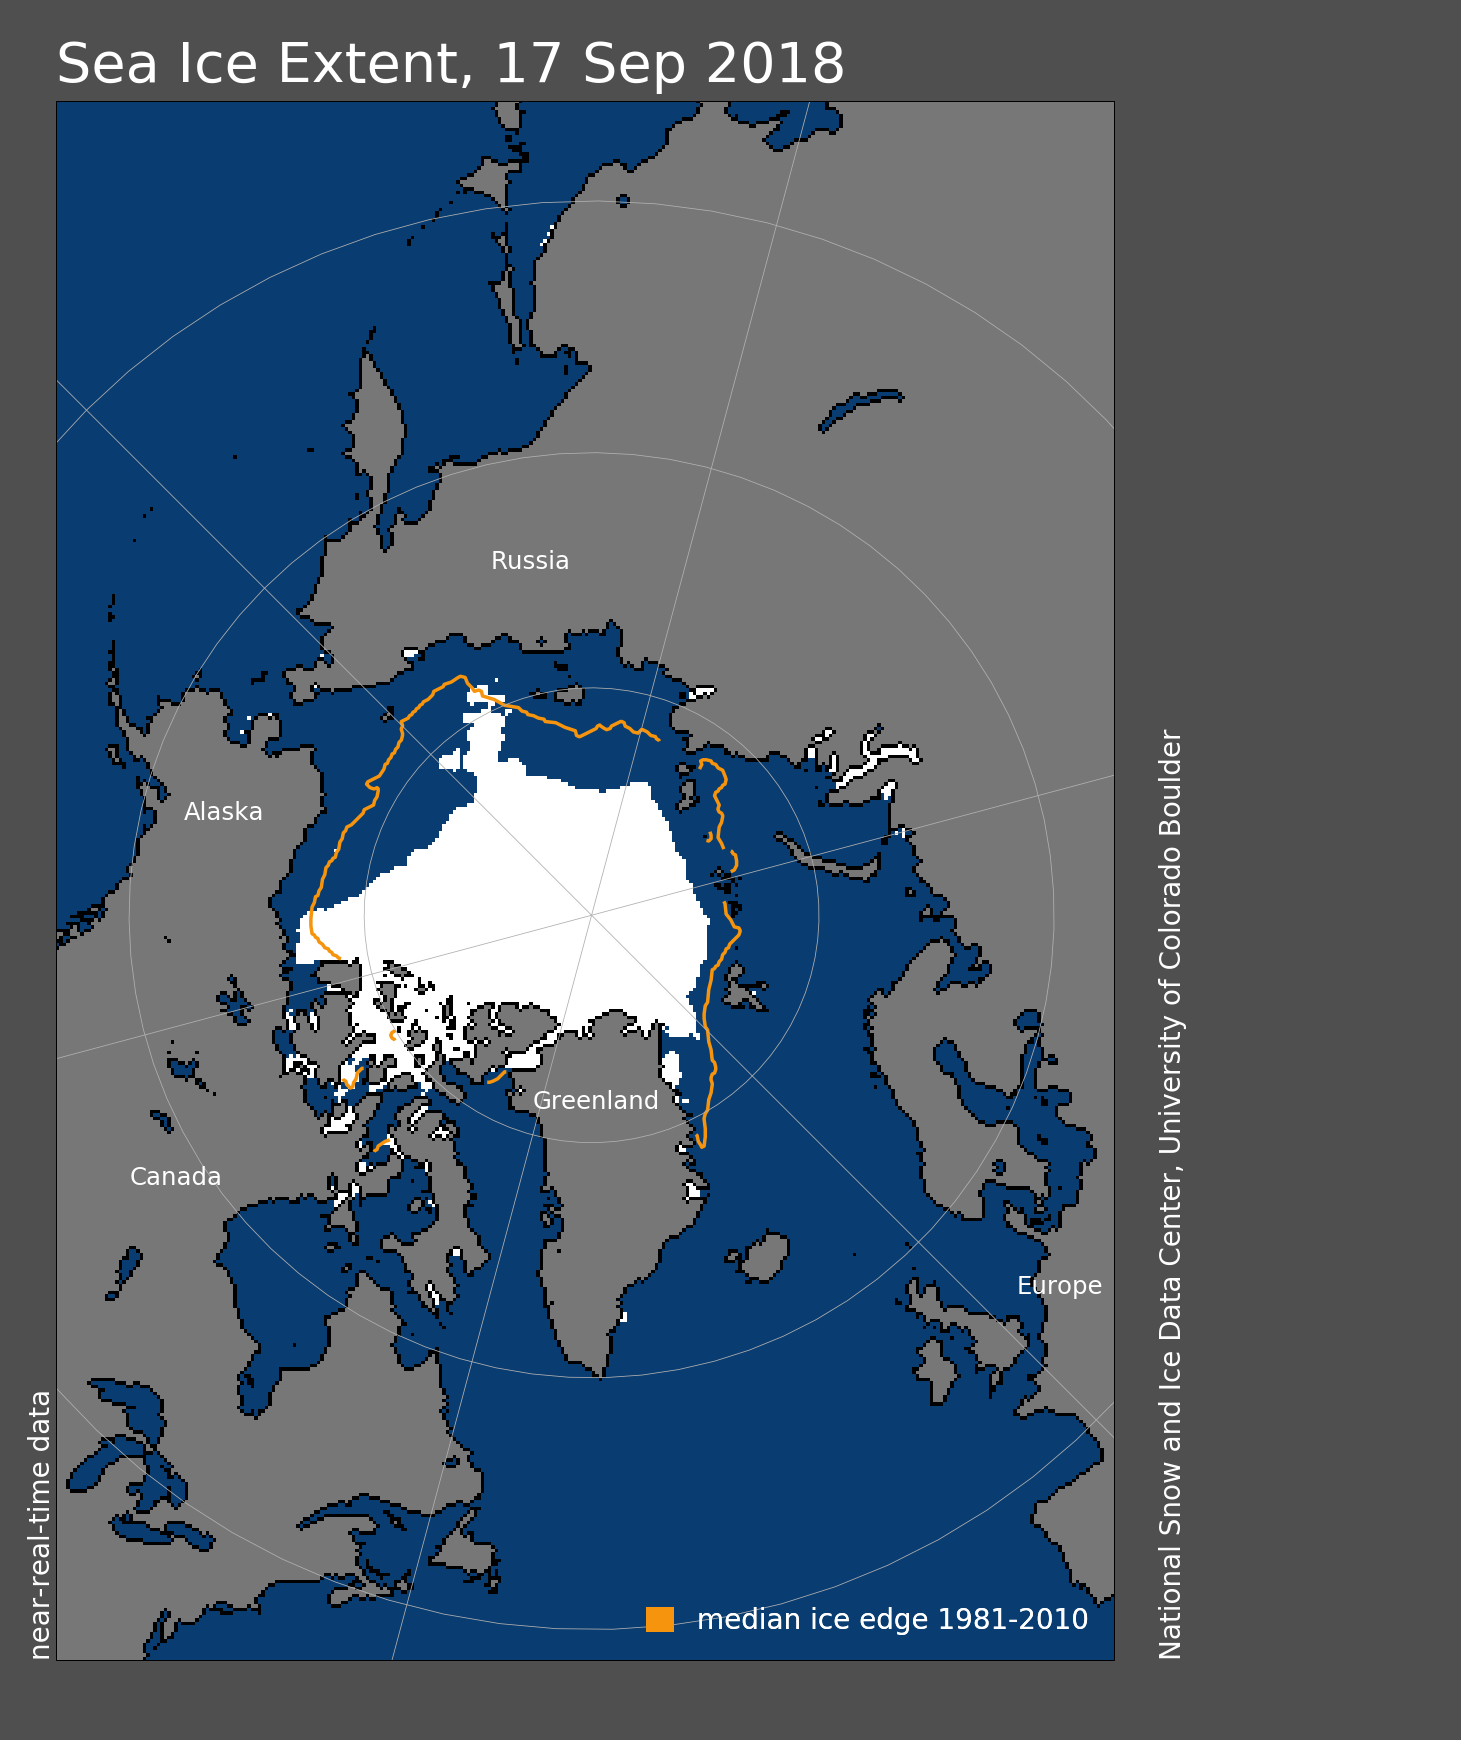
Figure 1. Arctic sea ice extent for September 17, 2018 was 4.60 million square kilometers (1.78 million square miles). The orange line shows the 1981 to 2010 average extent for that day. Sea Ice Index data. About the data
Credit: National Snow and Ice Data Center
High-resolution image
On September 17, Arctic sea ice extent stood at 4.60 million square kilometers (1.78 million square miles). This was 1.69 million square kilometers (653,000 square miles) below the 1981 to 2010 long-term average extent for this day of year, but 1.21 million square kilometers (467,000 square miles) above the record low for this day of year set in 2012. With the onset of autumn, air temperatures are dropping across the Arctic. The seasonal minimum extent is imminent. The Arctic’s minimum sea ice extent is likely to be the 6th lowest in the 39-year satellite record. Cool conditions in July played a large role in slowing the rate of summer ice loss. The Northern Sea Route nevertheless appears to be navigable. The Northwest Passage, including both the Northern and Southern routes, will not open this year. A remnant island of sea ice north of Alaska—well separated from the main area of pack ice and discussed in our previous post—is almost certain to survive the melt season.
Conditions in context
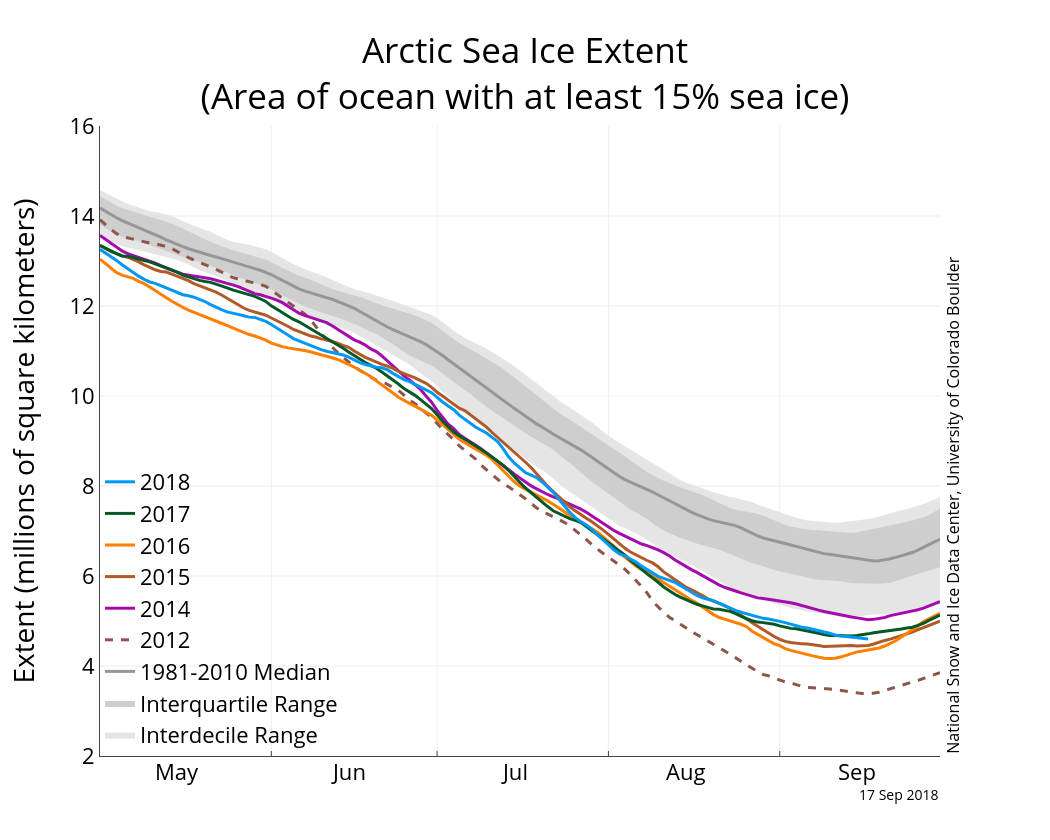
Figure 2a. The graph above shows Arctic sea ice extent as of September 17, 2018, along with daily ice extent data for four previous years and the record low year. 2018 is shown in blue, 2017 in green, 2016 in orange, 2015 in brown, 2014 in purple, and 2012 in dotted brown. The 1981 to 2010 median is in dark gray. The gray areas around the median line show the interquartile and interdecile ranges of the data. Sea Ice Index data.
Credit: National Snow and Ice Data Center
High-resolution image
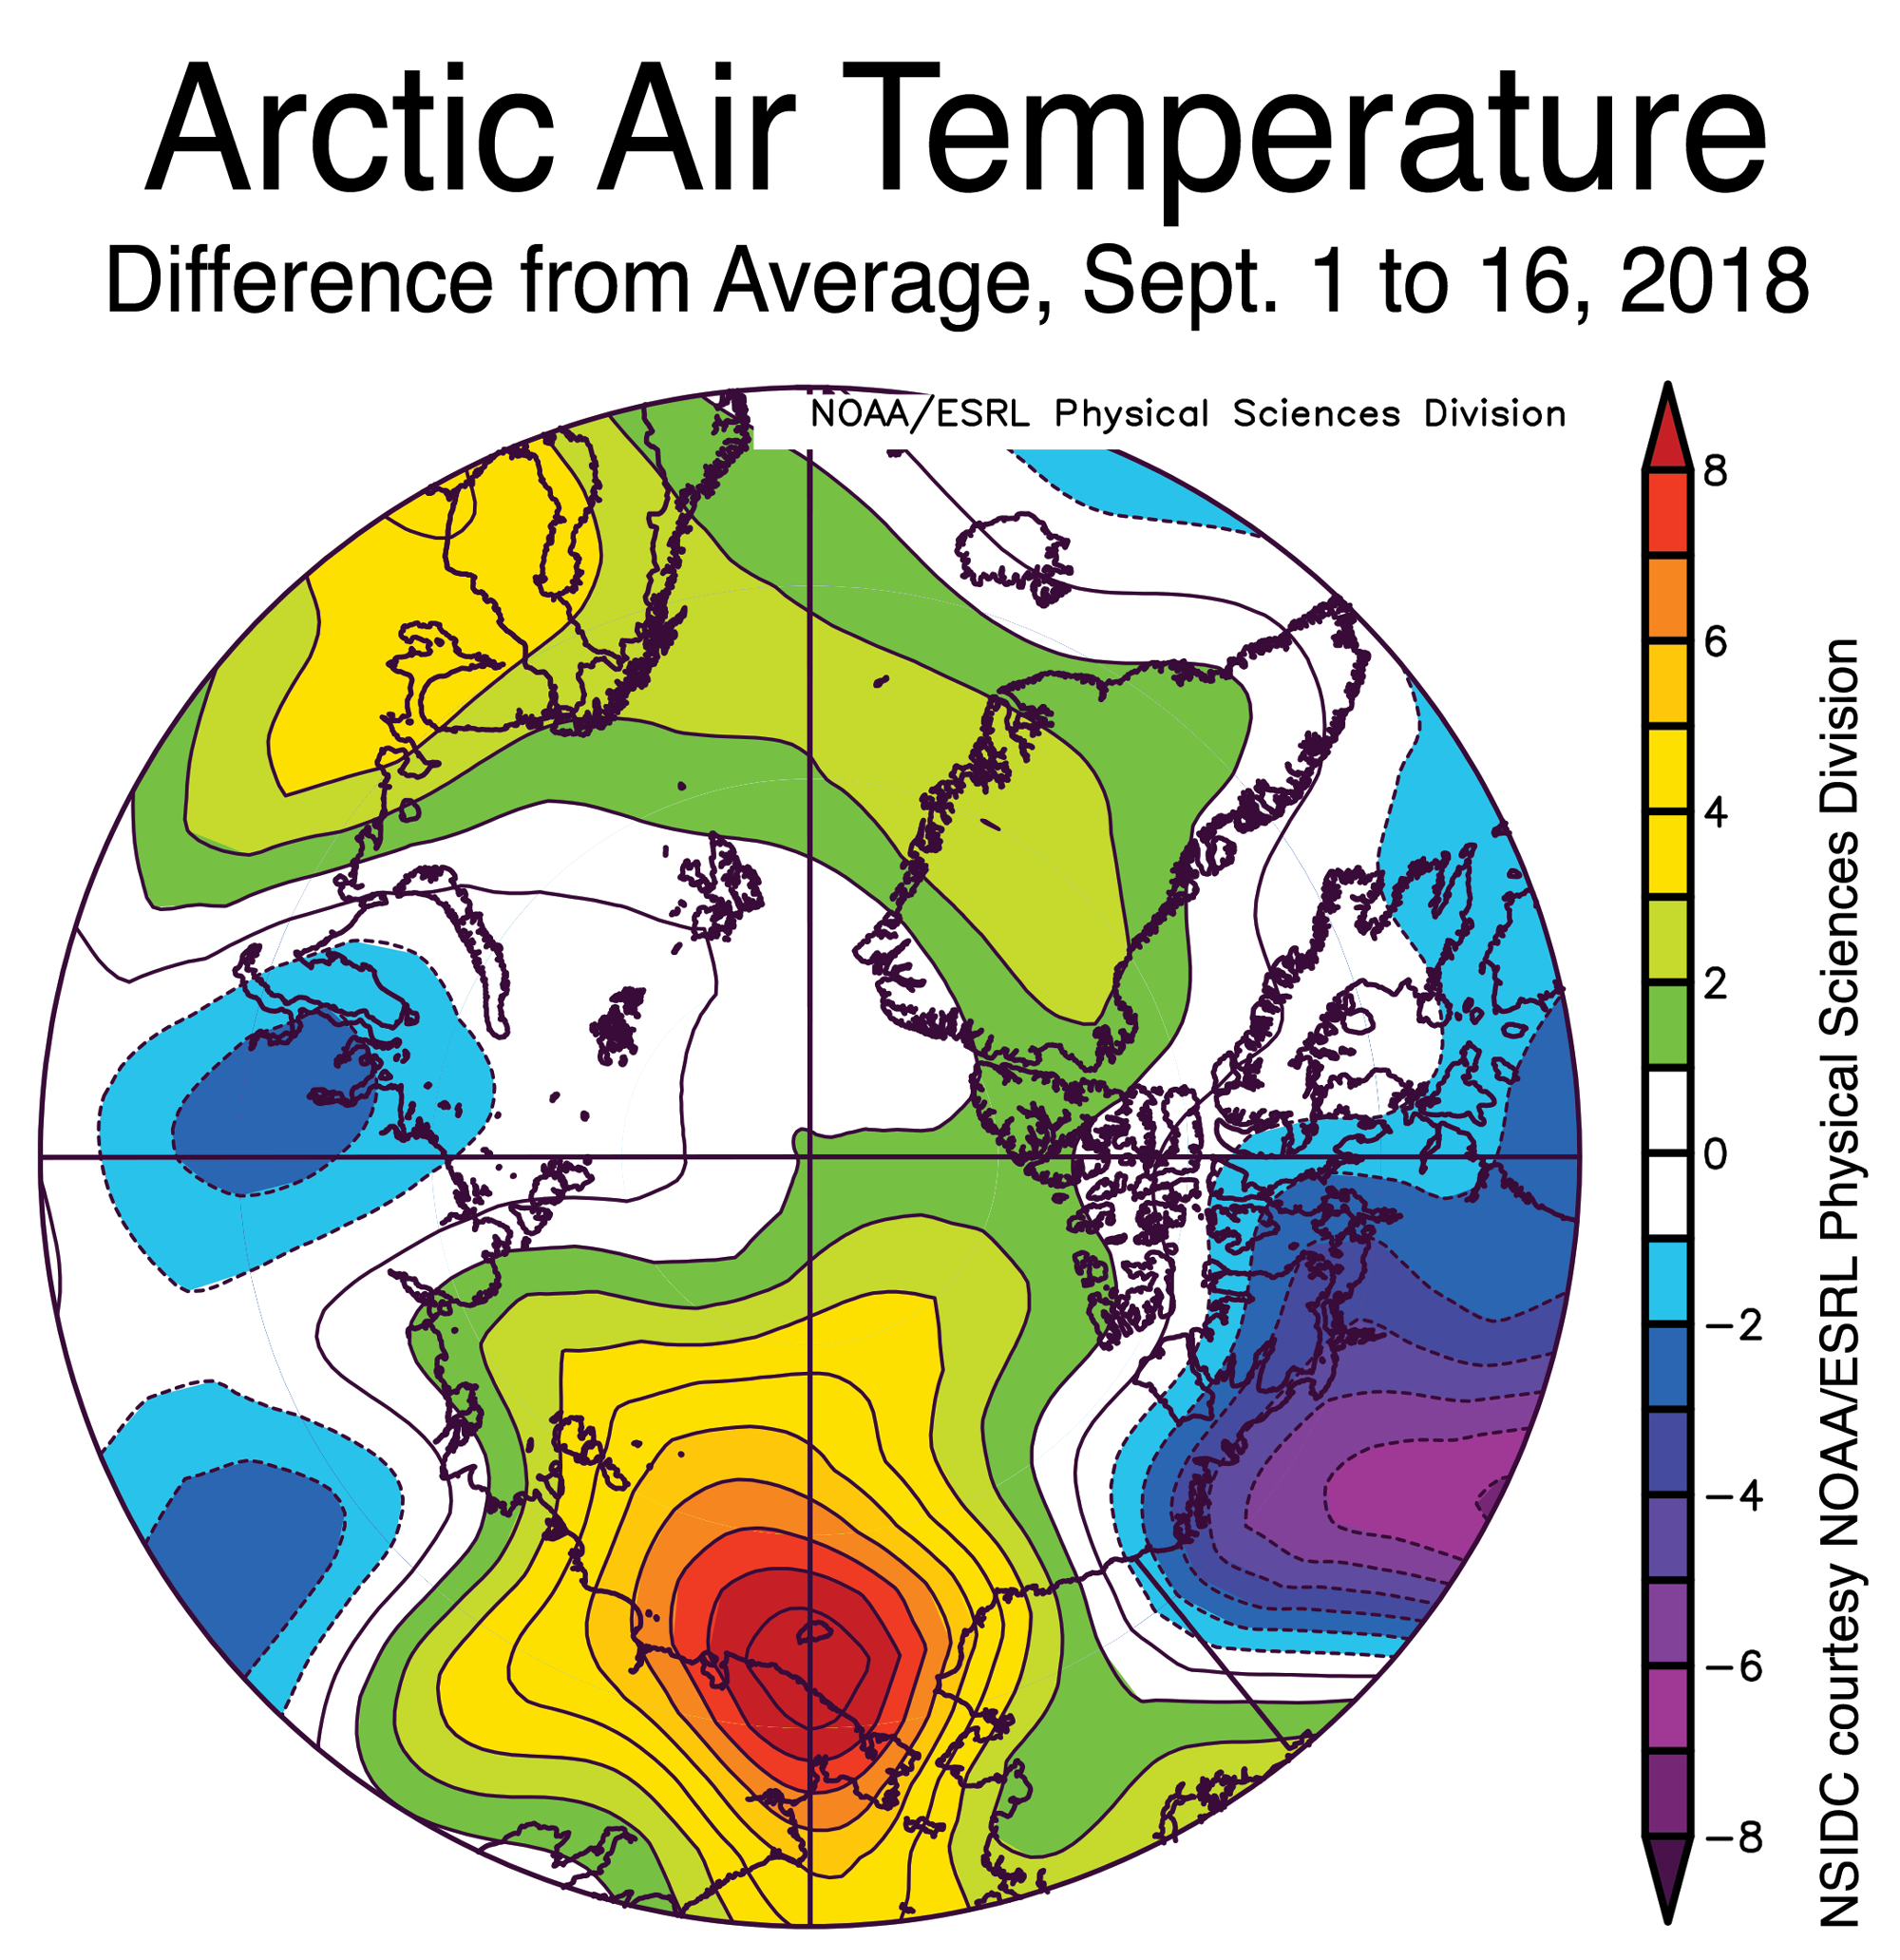
Figure 2b. This plot shows the difference from average air temperature in the Arctic at the 925 hPa level, in degrees Celsius, for September 1 to 16, 2018. Yellows and reds indicate higher than average temperatures; blues and purples indicate lower than average temperatures.
Credit: NSIDC courtesy NOAA Earth System Research Laboratory Physical Sciences Division
High-resolution image

Figure 2c. This plot shows the average sea level pressure in the Arctic in millibars (hPa) for September 1 to 16, 2018. Yellows and reds indicate high average air pressures; blues and purples indicate low air pressures.
Credit: NSIDC courtesy NOAA Earth System Research Laboratory Physical Sciences Division
High-resolution image
The average rate of ice loss from September 1 through September 17 was 25,000 square kilometers per day (10,000 square miles per day), similar to average rate of loss for the first half of September over the period 1981 to 2010. Sea ice retreat primarily occurred in the northern Chukchi, East Siberian, and Laptev Seas. The ice edge retreated slightly in the Kara and Barents Seas. Air temperatures at the 925 hPa level (about 2,500 feet above the surface) were near average over much of the Arctic Ocean, the obvious exception being in the East Siberian Sea, where temperatures were as much as 7 to 9 degrees Celsius (13 to 16 degrees Fahrenheit) above average. These high temperatures helped to reduce the sea ice extent in this region. The sea level pressure pattern for this same period is dominated by an area of low pressure extending from central Siberia, across the pole, and into the Canadian Arctic, and is most pronounced north of the Laptev Sea. The feature north of the Laptev Sea, in conjunction with the area of high pressure centered over the Bering Sea, has acted to transport warm air from the south over the East Siberian Sea, helping to explain the high temperatures there.

