Arctic sea ice extent for May 2018 was the second lowest in the satellite record. Above average temperatures and high sea level pressure prevailed over most of the Arctic Ocean, while some surrounding continental regions were colder than usual.
Overview of conditions
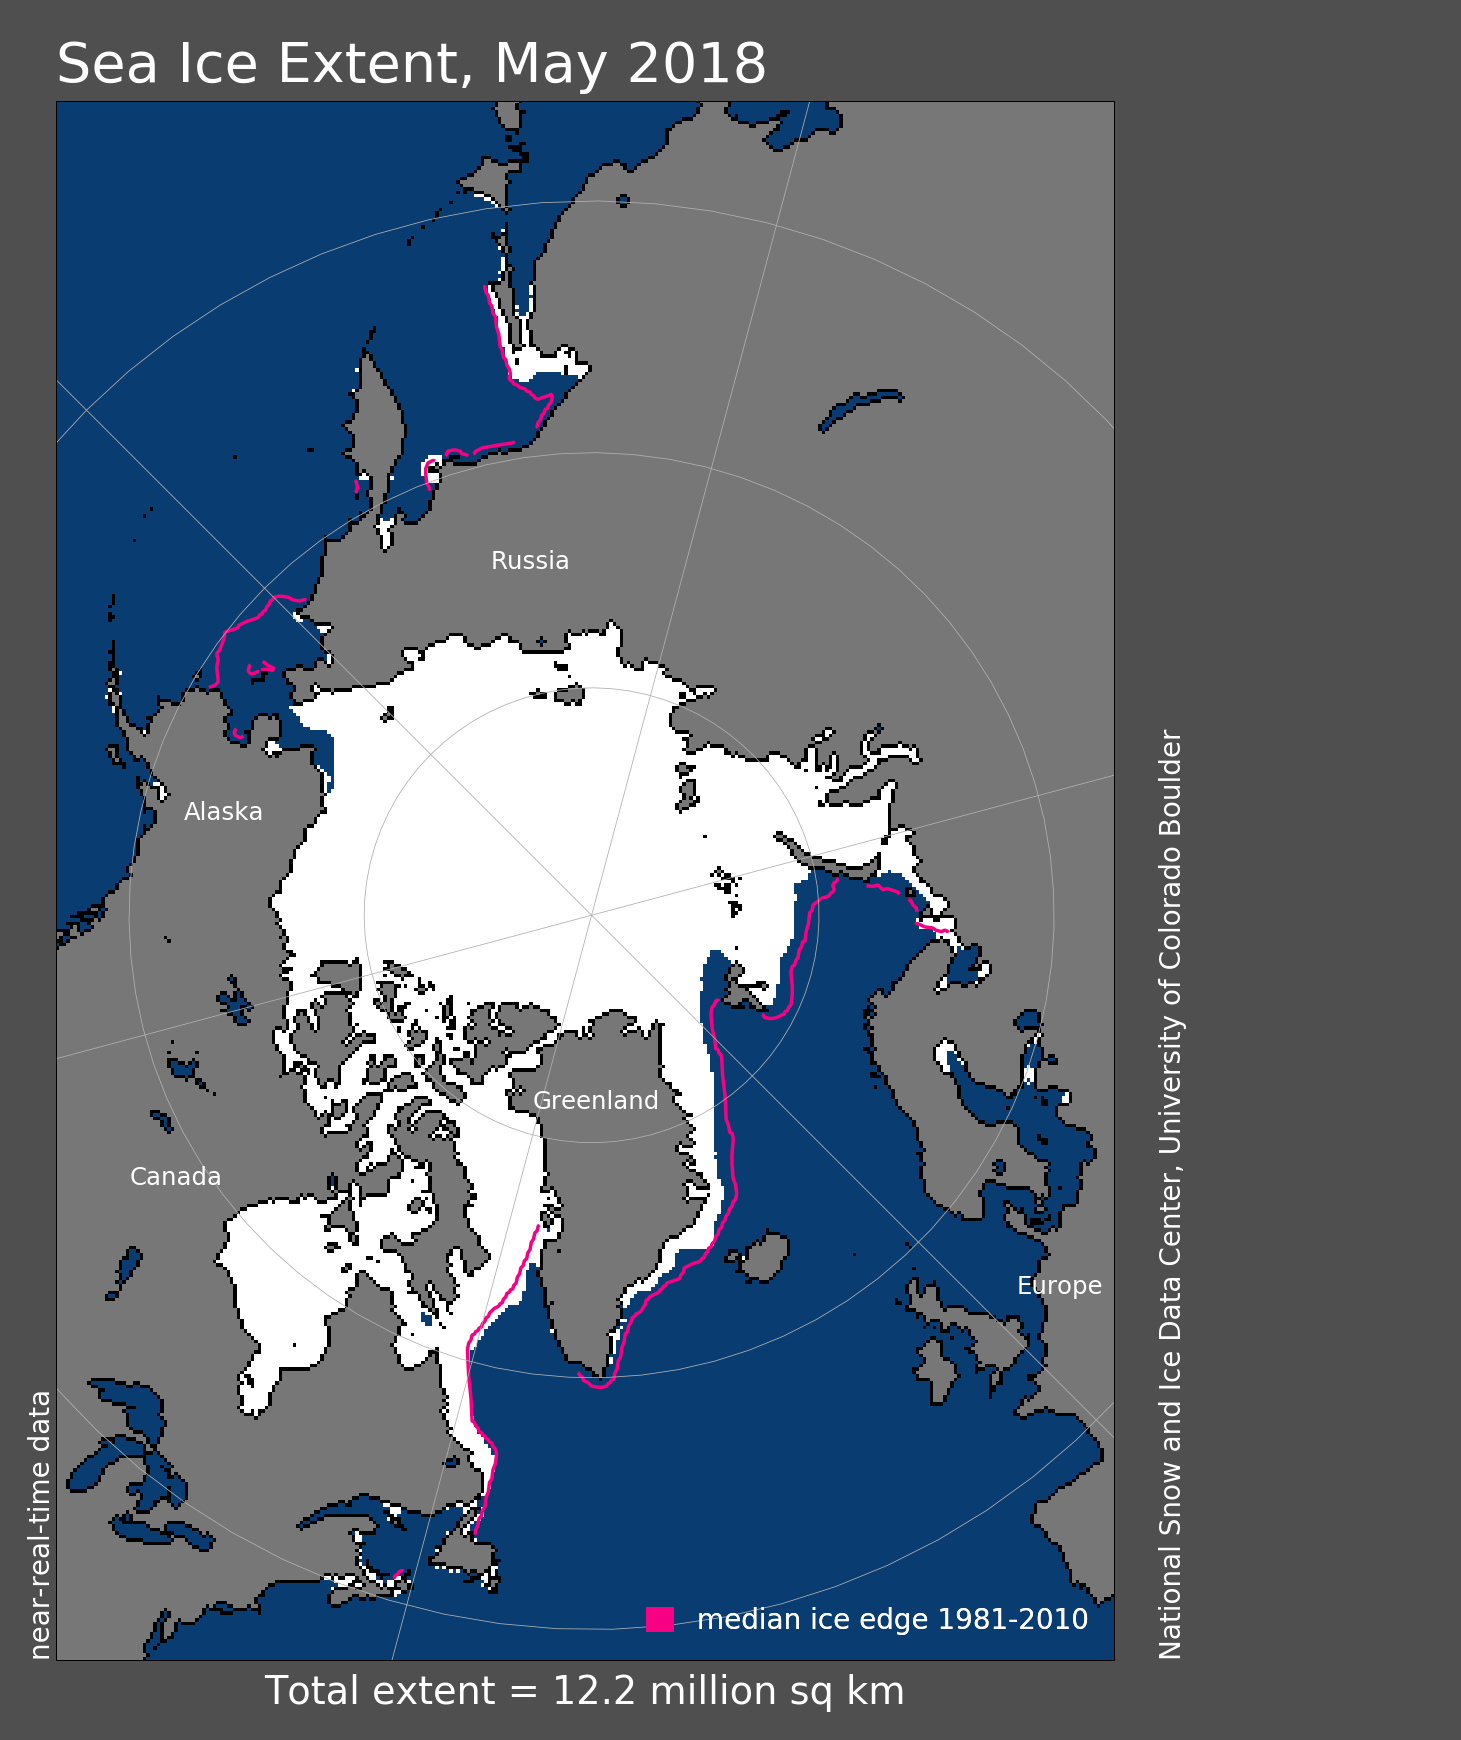
Figure 1. Arctic sea ice extent for May 2018 was 12.2 million square kilometers (4.7 million square miles). The magenta line shows the 1981 to 2010 average extent for that month. Sea Ice Index data. About the data
Credit: National Snow and Ice Data Center
High-resolution image
Arctic sea ice extent for May 2018 was 12.2 million square kilometers (4.7 million square miles). This was the second lowest May extent in the 39-year satellite record, and is 310,000 square kilometers (120,000 square miles) above May 2016, the record low for the month. Compared to May 2016, the ice cover remained slightly more extensive in the Barents and Kara Seas, within Baffin Bay, Davis Strait, and the southern Beaufort Sea, but less extensive in the Chukchi and East Greenland Seas.
In Svalbard, the average temperature for May 2018 was 6 degrees Celsius (11 degrees Fahrenheit) above average. By the end of the month, the north and west coasts of Svalbard were largely ice-free and a tongue of open water east of the islands extended northeast to Franz Joseph Land. According to NSIDC data, open water stretched as far north as ~82 degrees N at the end of May.
In the Chukchi Sea, open water developed to the west of Point Barrow, Alaska throughout the month. This may be in part a result of the inflow of warm waters from the Pacific, where sea surface temperatures were higher than average. It may also be due to the general lack of sea ice in the region that allows the ocean to readily absorb the sun’s energy. Ice retreat was also substantial within the Sea of Okhotsk, and little ice remains in the region. Hudson Bay began to open up, with a significant area of open water in the northwest sector of the bay.
Conditions in context
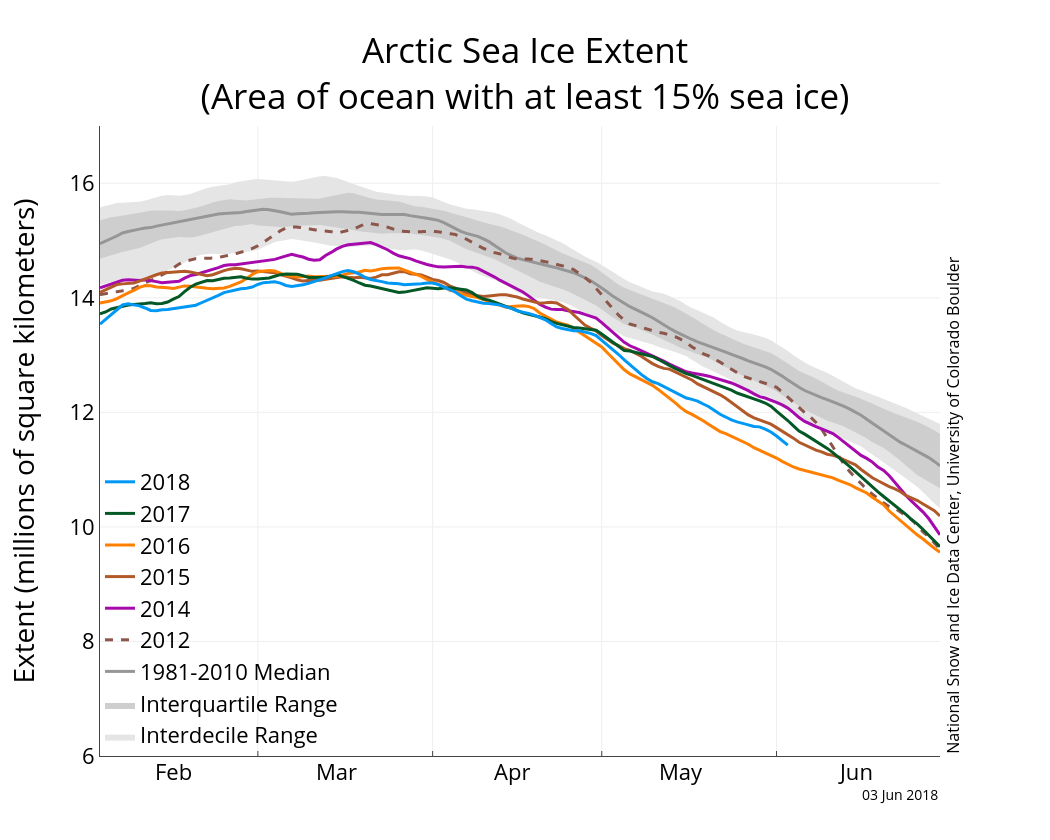
Figure 2a. The graph above shows Arctic sea ice extent as of June 3, 2018, along with daily ice extent data for four previous years and 2012, the year with record low minimum extent. 2018 is shown in blue, 2017 in green, 2016 in orange, 2015 in brown, 2014 in purple, and 2012 in dotted brown. The 1981 to 2010 median is in dark gray. The gray areas around the median line show the interquartile and interdecile ranges of the data. Sea Ice Index data.
Credit: National Snow and Ice Data Center
High-resolution image

Figure 2b. This plot shows departure from average sea level pressure in the Arctic, in millibars, for May 2018. Yellows and reds indicate higher than average sea level pressure; blues and purples indicate lower than average sea level pressure.
Credit: NSIDC courtesy NOAA Earth System Research Laboratory Physical Sciences Division
High-resolution image
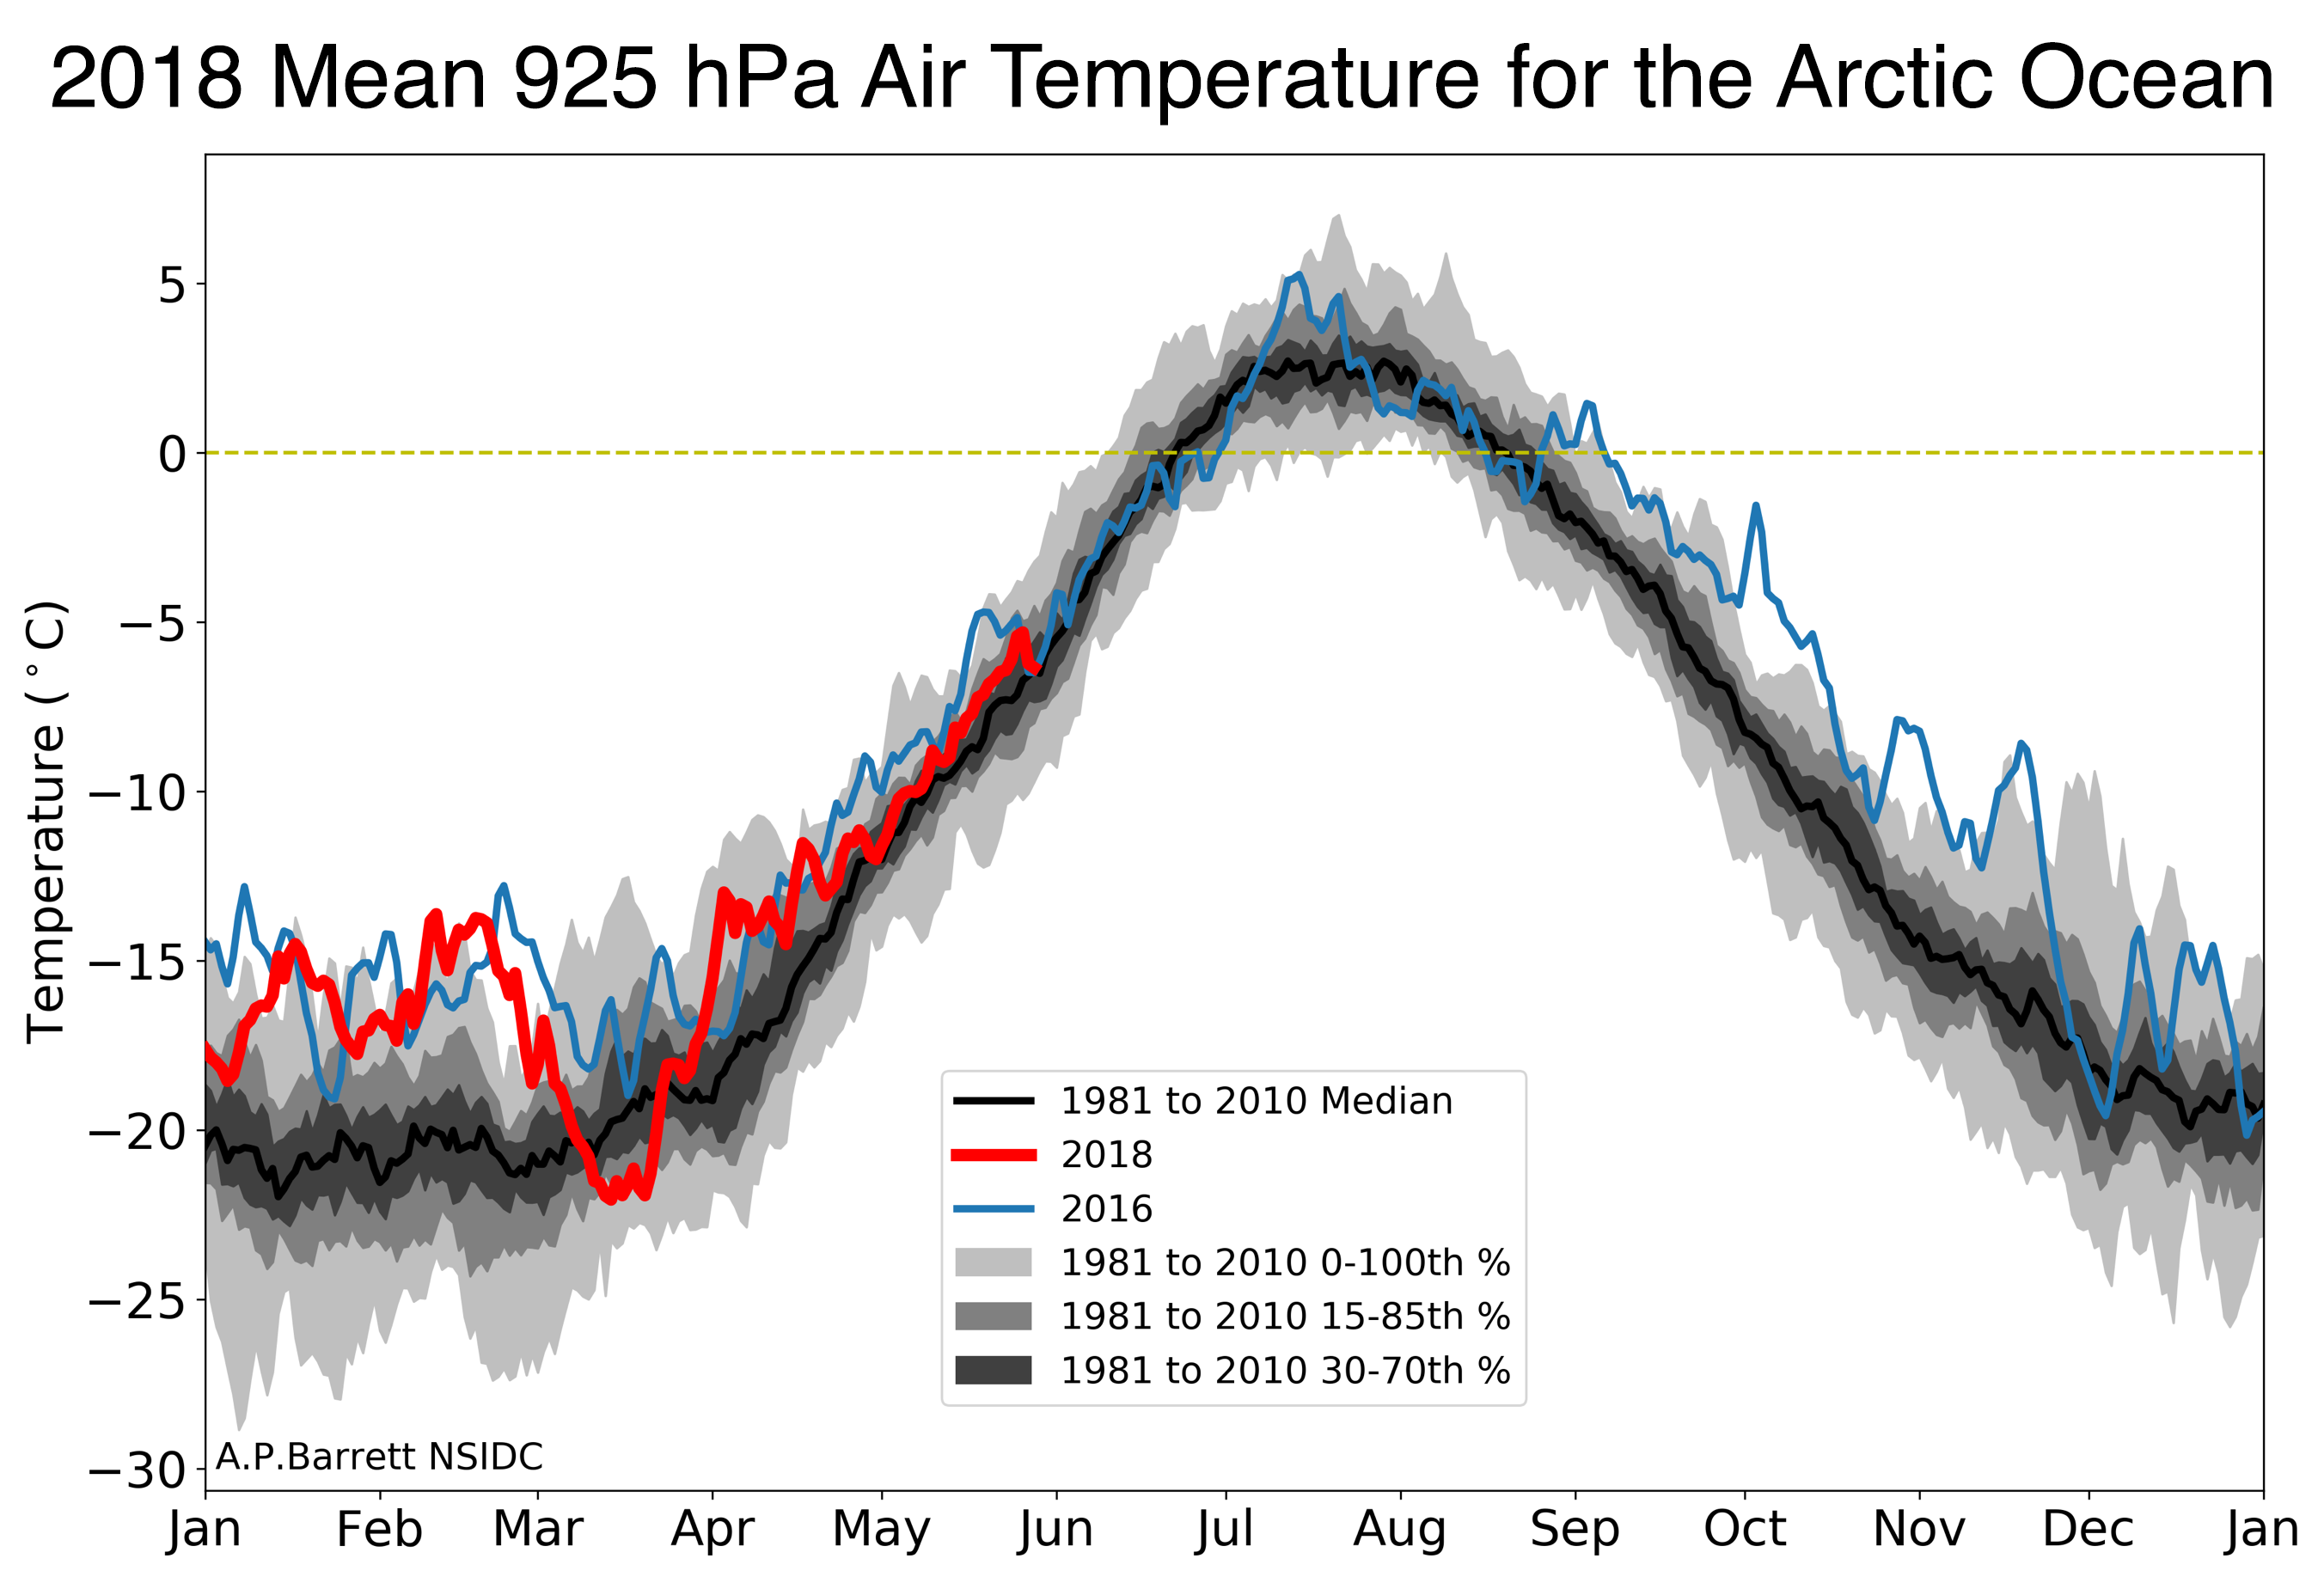
Figure 2c. This plot shows air temperatures at the 925 mb level averaged over the Arctic Ocean region. This region covers only ocean areas in the Arctic, bounded by the Bering Strait on the Pacific side, and Fram Strait and roughly the 20 degree E meridian between Svalbard and Norway.
Credit: A. P. Barrett, NSIDC
High-resolution image
The atmospheric pattern (Figure 2b) for May was characterized by a region of above average sea level pressure centered over the Fenno-Scandinavian Peninsula and below average pressure centered over Greenland. This pattern helped to funnel warm winds from the south into the Barents Sea sector favoring retreat of ice. Air temperatures at the 925 hPa level (about 2,500 feet above sea level) in the Barents Sea were up to 5 degrees Celsius (9 degrees Fahrenheit) above average (not shown). On the Pacific side, departures from average sea level pressure were small and a fairly typical Beaufort Sea High and Aleutian Low pattern reigned for much of the month. Overall it was warm across the Arctic Ocean with temperatures at the 925 hPa level ranging between 2 to 5 degrees Celsius (4 to 9 degrees Fahrenheit) above average for the month. By contrast, conditions over land regions surrounding the Arctic were relatively cool. Parts of Central Siberia and Nunavut in northern Quebec saw temperatures more than 5 degrees Celsius (9 degrees Fahrenheit) below average. However, Europe, eastern Asia and western North America were warmer than usual.
Air temperatures at the 925 mb level (about 2,500 feet above sea level) over the Arctic Ocean have been above average through most this year (Figure 2c). Temperatures were extremely high compared to typical conditions from January through early March. After a brief cold period in March, temperatures returned to near average and increased at typical rates through most of May.
While it is still relatively early in the melt season, images from the Moderate Resolution Imaging Spectroradiometer (MODIS) show considerable fracturing of multiyear ice floes in the Beaufort Sea. The early development of open water around these large ice floes can help accelerate melt through absorption of solar energy. Some of these ice floes appear already partially covered by melt ponds.
May 2018 compared to previous years
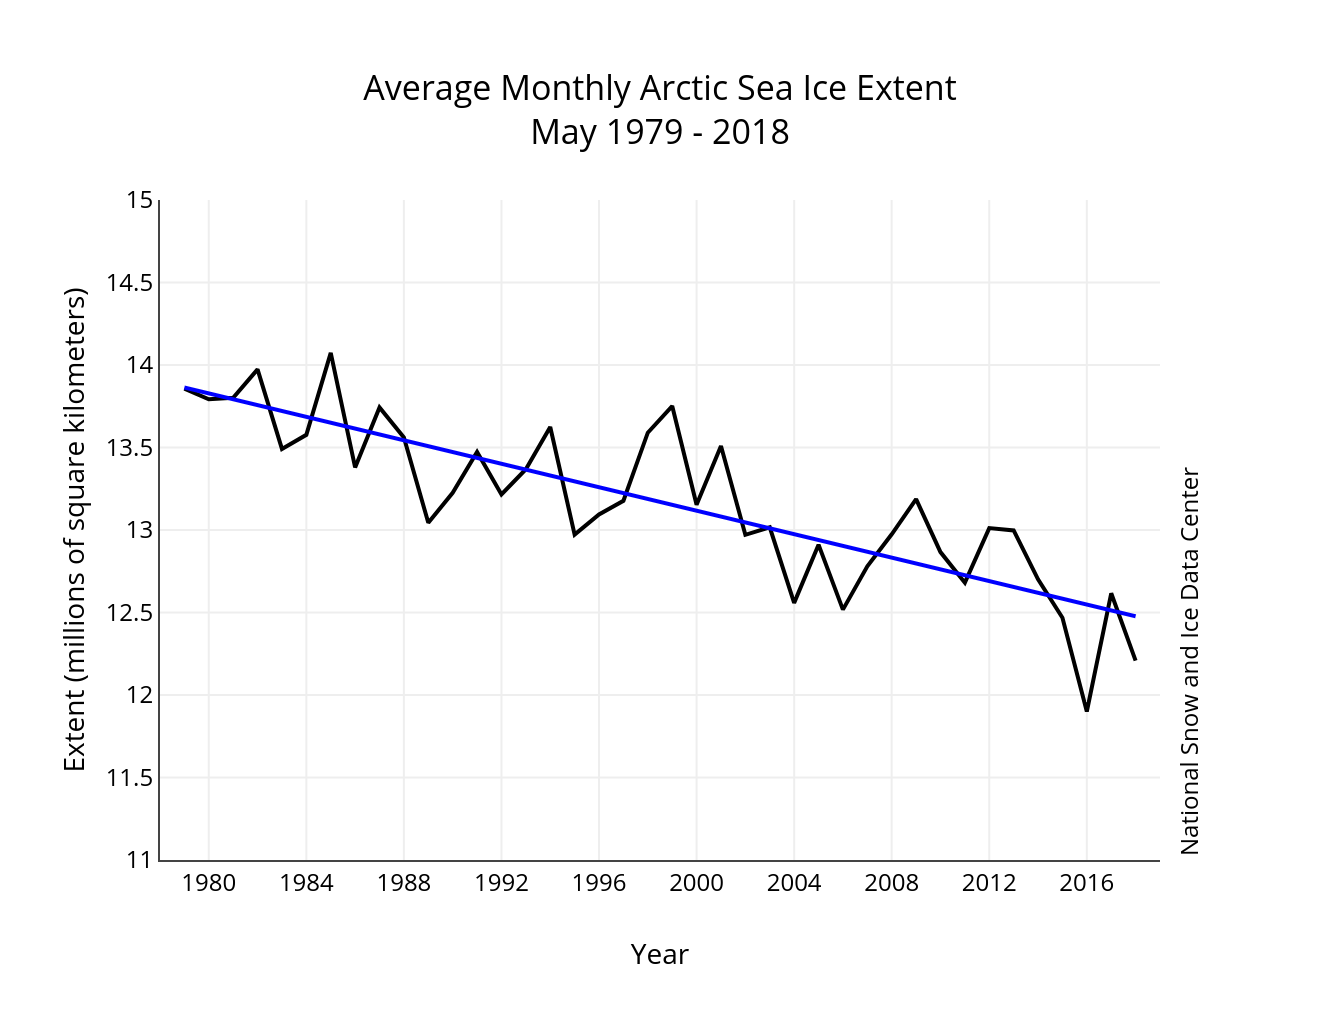
Figure 3. Monthly May ice extent for 1979 to 2018 shows a decline of 2.6 percent per decade.
Credit: National Snow and Ice Data Center
High-resolution image
The linear rate of decline for May sea ice extent is 36,000 square kilometers (14,000 square miles) per year, or 2.6 percent per decade relative to the 1981 to 2010 average. Ice loss during the month was 1.7 million square kilometers (656,000 square miles), which was faster than the 1981 to 2010 average loss of 1.5 million square kilometers (579,000 square miles) for the month.
Another season for the Sea Ice Outlook
The Sea Ice Prediction Network is once again soliciting contributions to the Sea Ice Outlook predicting the September 2018 sea ice extent. This effort is coordinated by the Arctic Research Consortium of the United States (ARCUS). This is the second phase of the Sea Ice Prediction Network, and is currently funded by the National Science Foundation, the Office of Naval Research, and the United Kingdom’s National Environment Research Council. While all prediction methods are welcome, a new focus of the project is to assess the economic value of seasonal ice forecasts. To make the forecasts more useful to stakeholders, there is an increased emphasis on predicting the spatial pattern of the ice cover for September, not just the total extent. The Sea Ice Outlook will summarize contributions and assess the seasonal evolution of conditions each month through summer and in post-season reports at https://www.arcus.org/sipn.
Autumn in Antarctica
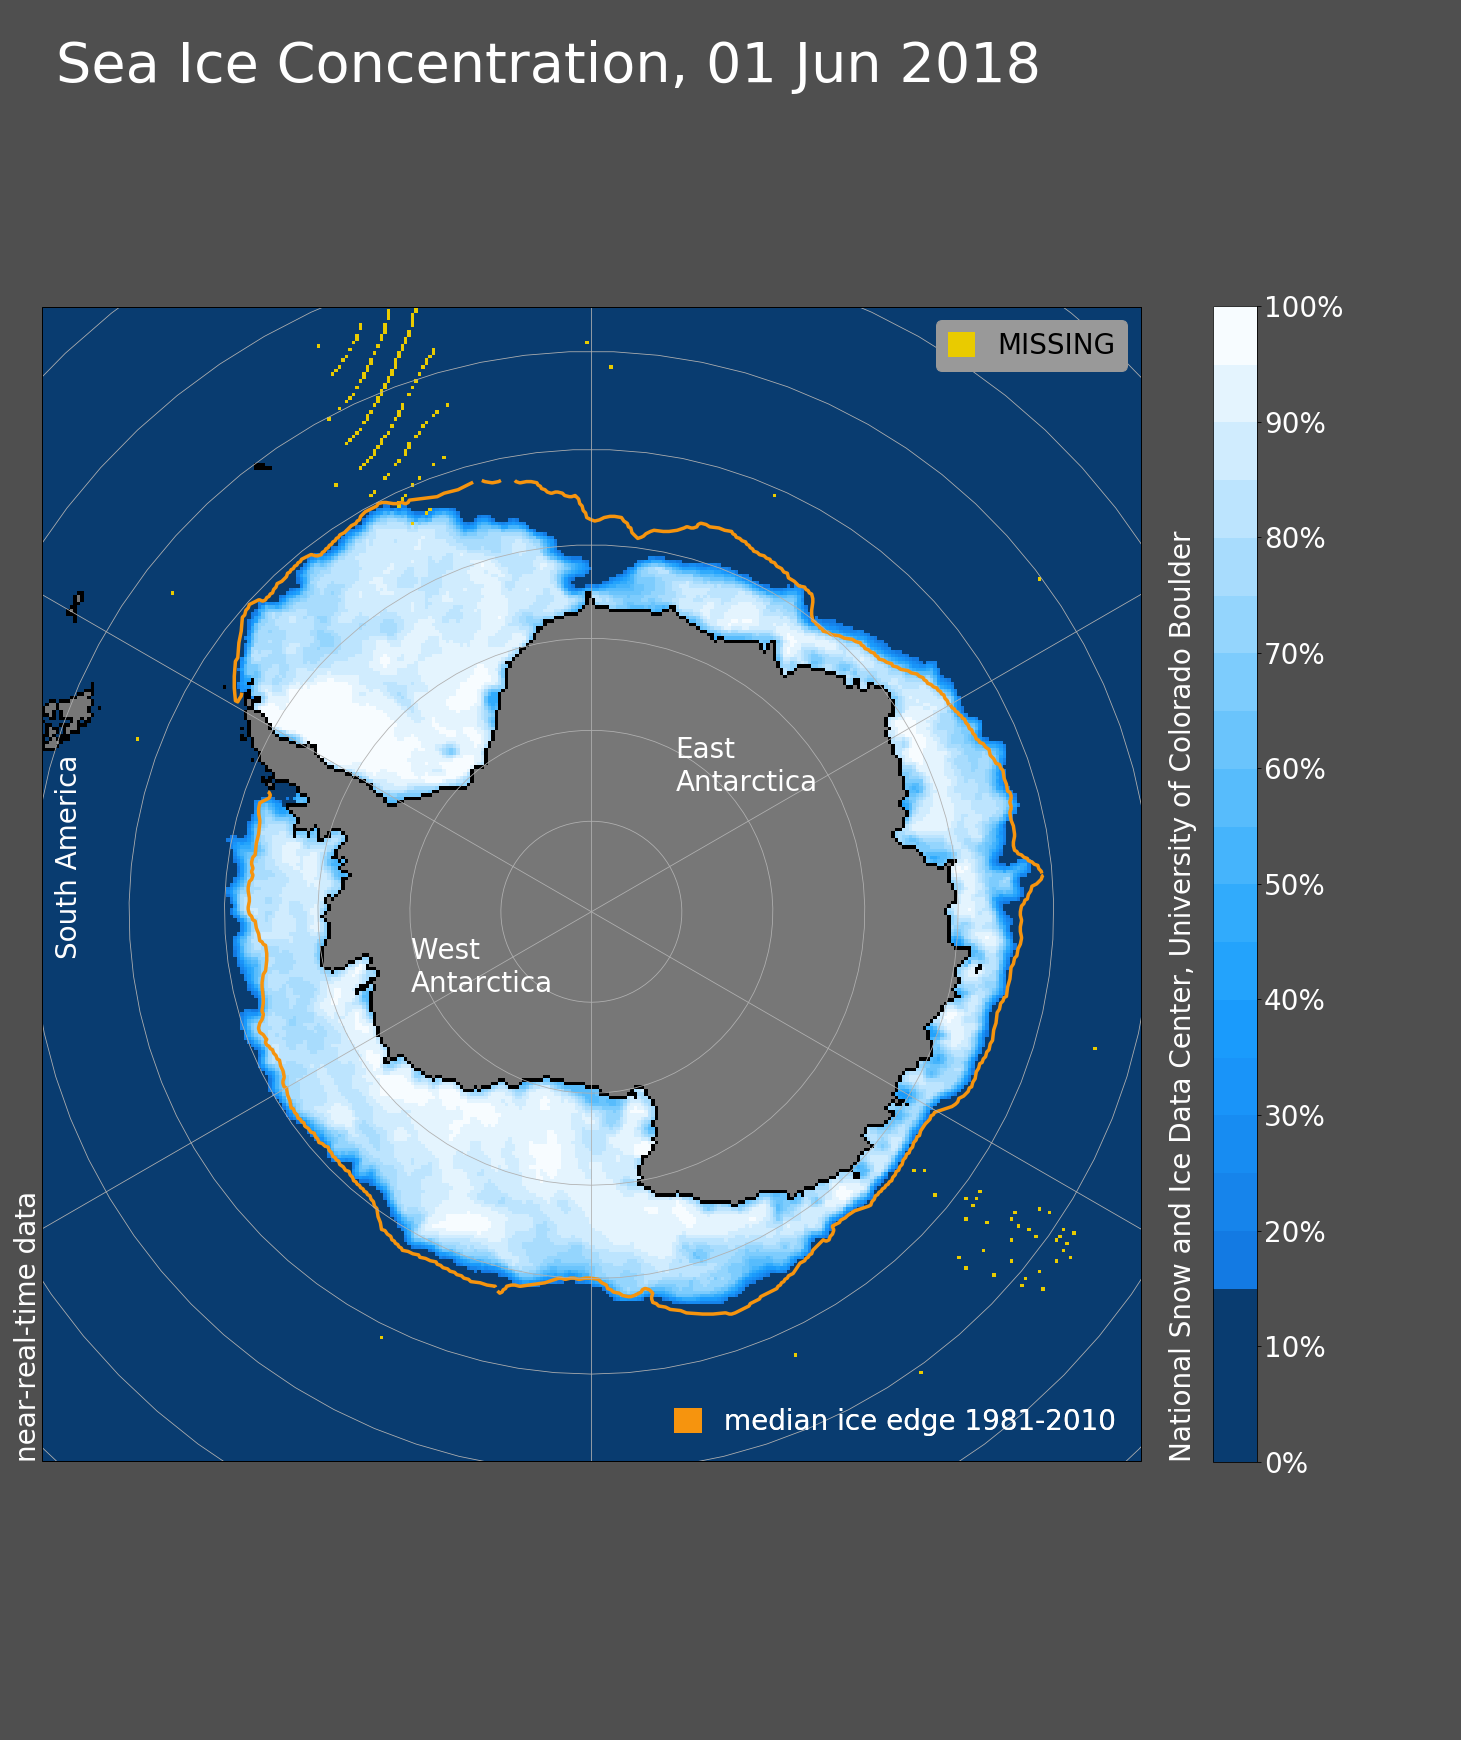
Figure 4a. Arctic sea ice extent for June 1, 2018 was 11.0 million square kilometers (4.2 million square miles). The orange line shows the 1981 to 2010 average extent for that day. Sea Ice Index data. About the data
Credit: National Snow and Ice Data Center
High-resolution image
Sea ice extent in the Southern Ocean grew steadily in May at the rate of 123,000 square kilometers (47,000 square miles) per day, somewhat faster than the 1981 to 2010 average growth rate of 108,000 square kilometers (42,000 square miles) per day. This pushed Antarctic ice extent from third lowest at the start of the month to sixth lowest by June 1. Ice extent was near average for all regions except for a broad section of the far eastern Weddell Sea, where ice extent was less than the 1981 to 2010 average. The eastern Ross, Amundsen, and Bellingshausen Seas began the month with less ice cover than average, but rapid growth in these regions brought ice extent to near average by the end of the month.
Reference
Nilsen, T. “Warmest May ever on Arctic Islands,” The Barents Observer, June 3, 2018, 11:00 a.m., MST, https://thebarentsobserver.com/en/ecology/2018/06/warmest-may-ever-arctic-islands.

