The 2018 winter sea ice maximum has passed, and the melt season has begun. The most notable aspect of the 2017 to 2018 winter ice extent was the persistently low ice extent in the Bering Sea. While December, January, and February were characterized by very warm conditions over the Arctic, March temperatures were mixed, with cool conditions over the Eurasian side and moderately warm conditions over the North American side.
Overview of conditions

Figure 1. Arctic sea ice extent for March 2018 was 14.30 million square kilometers (5.52 million square miles). The magenta line shows the 1981 to 2010 average extent for the month. Sea Ice Index data. About the data
Credit: National Snow and Ice Data Center
High-resolution image
Arctic sea ice extent for March 2018 averaged 14.30 million square kilometers (5.52 million square miles), the second lowest in the 1979 to 2018 satellite record. This was 1.13 million square kilometers (436,300 square miles) below the 1981 to 2010 average and 30,000 square kilometers (11,600 square miles) above the record low March extent in 2017. Extent at the end of the month was far below average in the Bering Sea, as it has been for the past several months, and slightly below average in the far northern Atlantic Ocean and Barents Sea. Ice extent was slightly above average in the Sea of Okhotsk.
Conditions in context
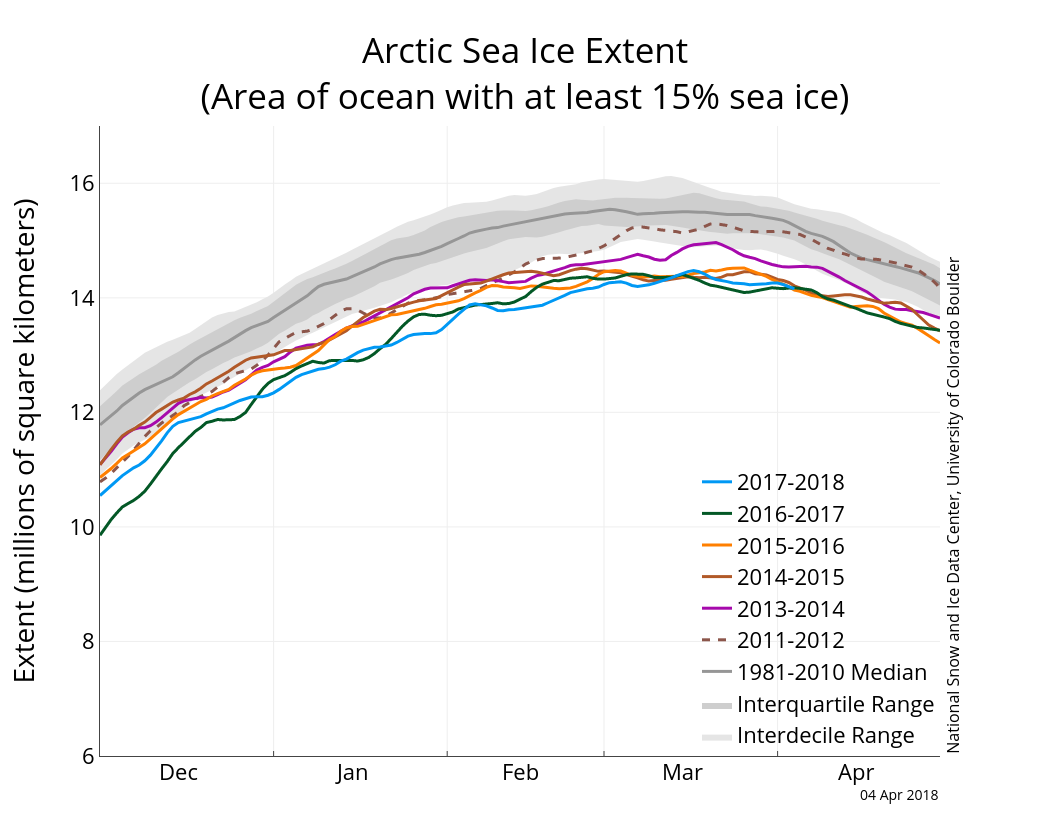
Figure 2a. The graph above shows Arctic sea ice extent as of April 4, 2018, along with daily ice extent data for four previous years, and the record low year. 2017 to 2018 is shown in blue, 2016 to 2017 in green, 2015 to 2016 in orange, 2014 to 2015 in brown, 2013 to 2014 in purple, and 2011 to 2012 in dotted brown. The 1981 to 2010 median is in dark gray. The gray areas around the median line show the interquartile and interdecile ranges of the data. Sea Ice Index data.
Credit: National Snow and Ice Data Center
High-resolution image
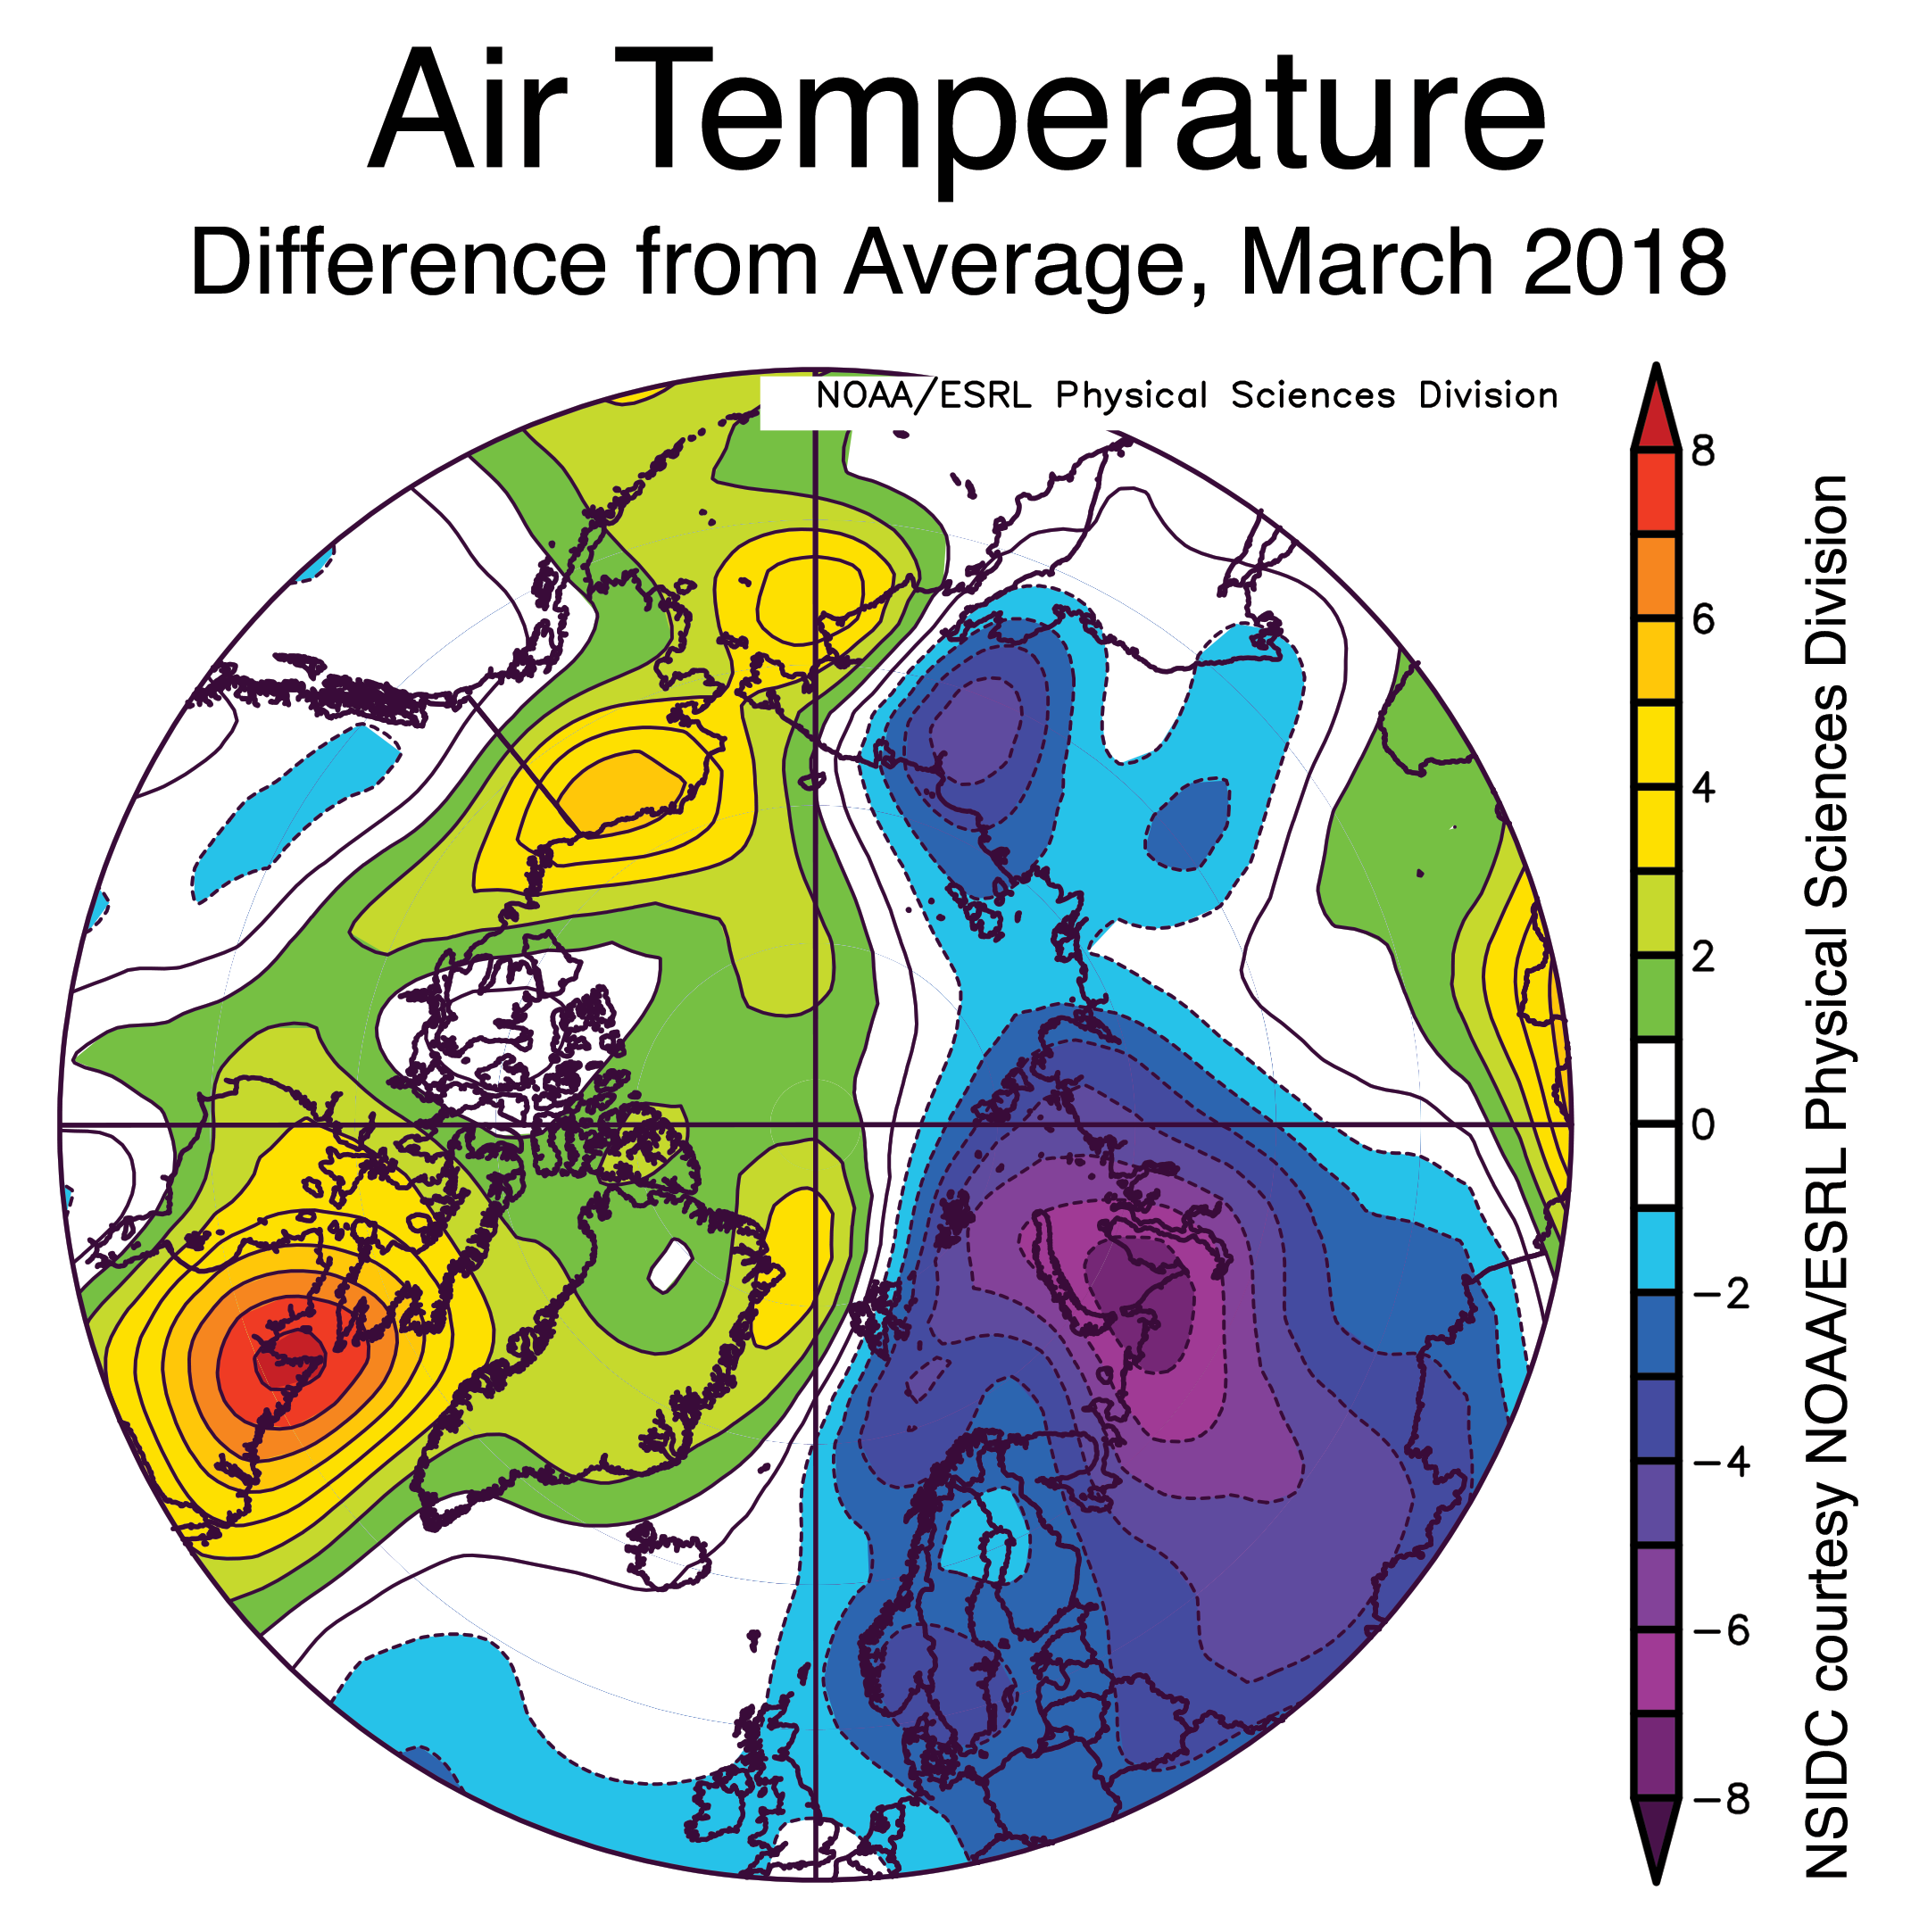
Figure 2b. This plot shows departure from average air temperature in the Arctic at the 925 hPa level, in degrees Celsius, for March 2018. Yellows and reds indicate higher than average temperature; blues and purples indicate lower than average temperature.
Credit: NSIDC courtesy NOAA Earth System Research Laboratory Physical Sciences Division
High-resolution image
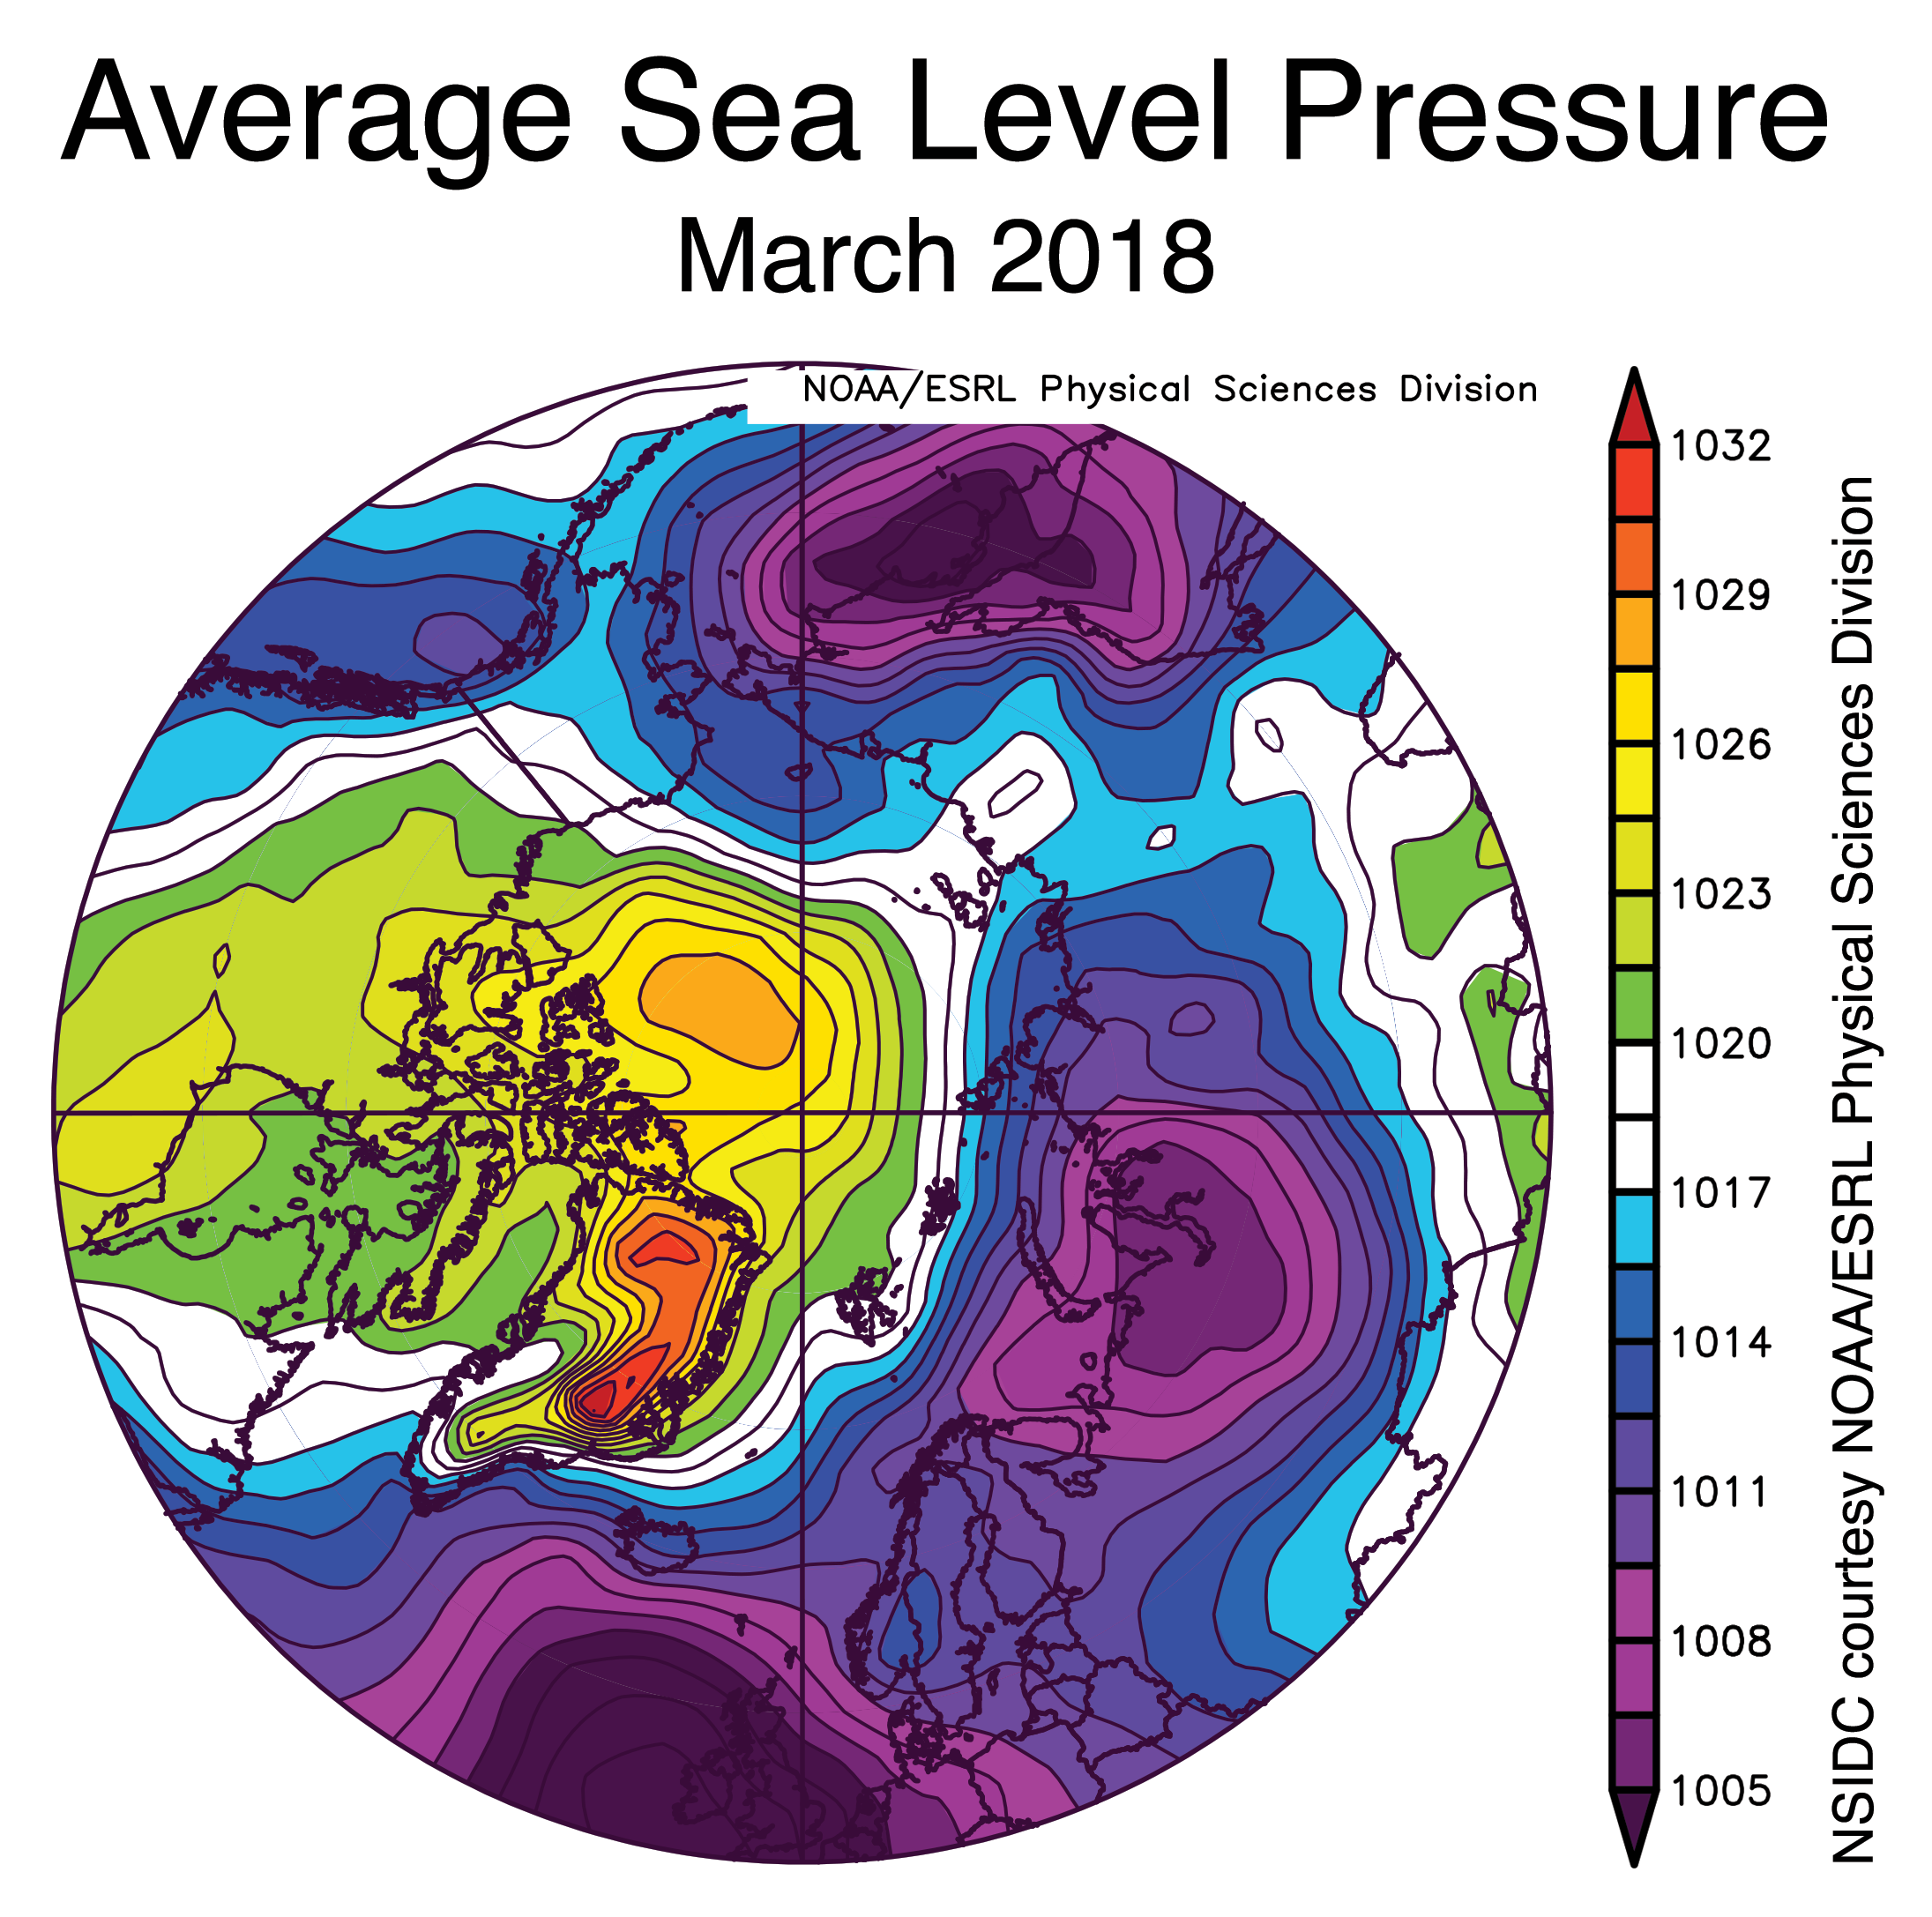
Figure 2c. This plot shows the average sea level pressure in the Arctic at the 925 hPa level, in millibars, for March 2018. Yellows and reds indicate higher than average air pressure; blues and purples indicate lower than average air pressure.
Credit: NSIDC courtesy NOAA Earth System Research Laboratory Physical Sciences Division
High-resolution image
Overall, ice extent for March 2018 changed little. Extent reached the annual maximum on March 17 and declined by March 31 to nearly the same level as at the beginning of the month. Ice loss following the seasonal maximum has been almost entirely restricted to the Bering Sea and the Sea of Okhotsk, with slight increases in extent in the Barents Sea and near Svalbard.
Air temperatures at the 925 hPa level (about 2,500 feet above sea level) were 2 to 4 degrees Celsius (4 to 7 degrees Fahrenheit) higher than average in regions near Greenland and Alaska. Cooler conditions prevailed over Scandinavia, the Kara Sea, and far eastern Siberia, where temperatures were generally 4 to 7 degrees Celsius (7 to 13 degrees Fahrenheit) below average.
Higher than average sea level pressure was present over the western Arctic, including Canada, the Beaufort Sea, and Greenland, while lower than average sea level pressure prevailed over most of Europe and Siberia. This pattern was associated with winds from the south in the Bering Sea and Alaska, helping to push ice toward the pole. Conversely, over Scandinavia and the Barents Sea this pressure pattern resulted in winds from the northeast that pushed Arctic air onto the northern Eurasian landmass leading to colder air temperatures.
The Arctic Oscillation (AO), an indicator for general wind, precipitation, and temperature patterns in the Arctic, was strongly negative in early March, reflecting the higher than average sea level pressure in the western Arctic. This negative phase is characterized by a weakening of the circumpolar wind pattern, a pattern that favors cold air outbreaks over much of the United States as well as parts of Europe and Asia.
March 2018 compared to previous years
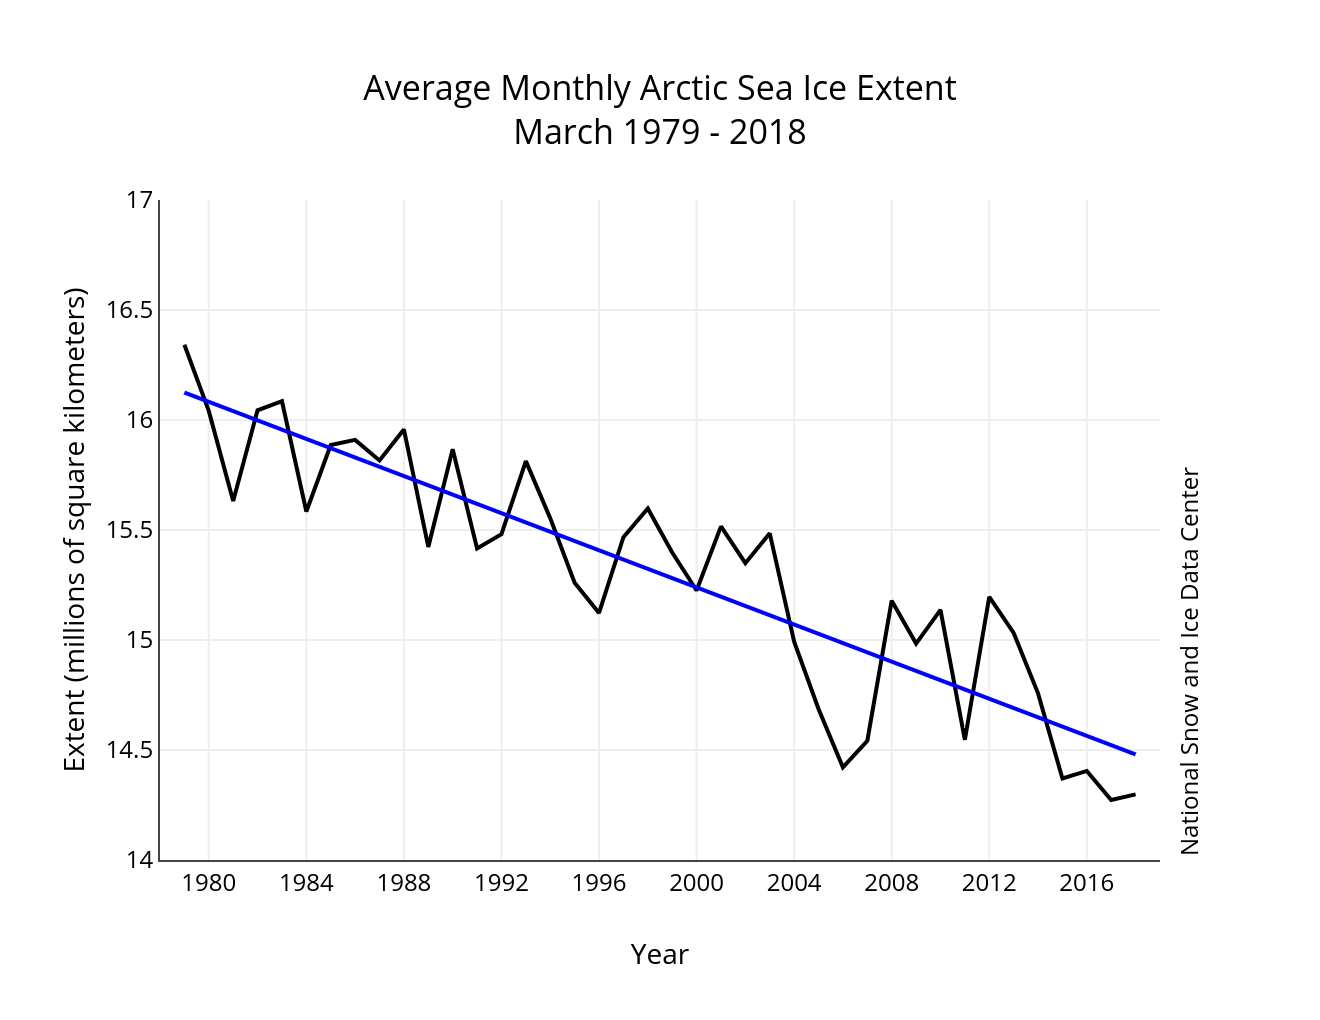
Figure 3. Monthly March ice extent for 1979 to 2018 shows a decline of 2.7 percent per decade.
Credit: National Snow and Ice Data Center
High-resolution image
The linear rate of decline for March ice extent is 42,200 square kilometers (16,400 square miles) per year, or 2.7 percent per decade relative to the 1981 to 2010 average.
Review of winter season 2017 to 2018
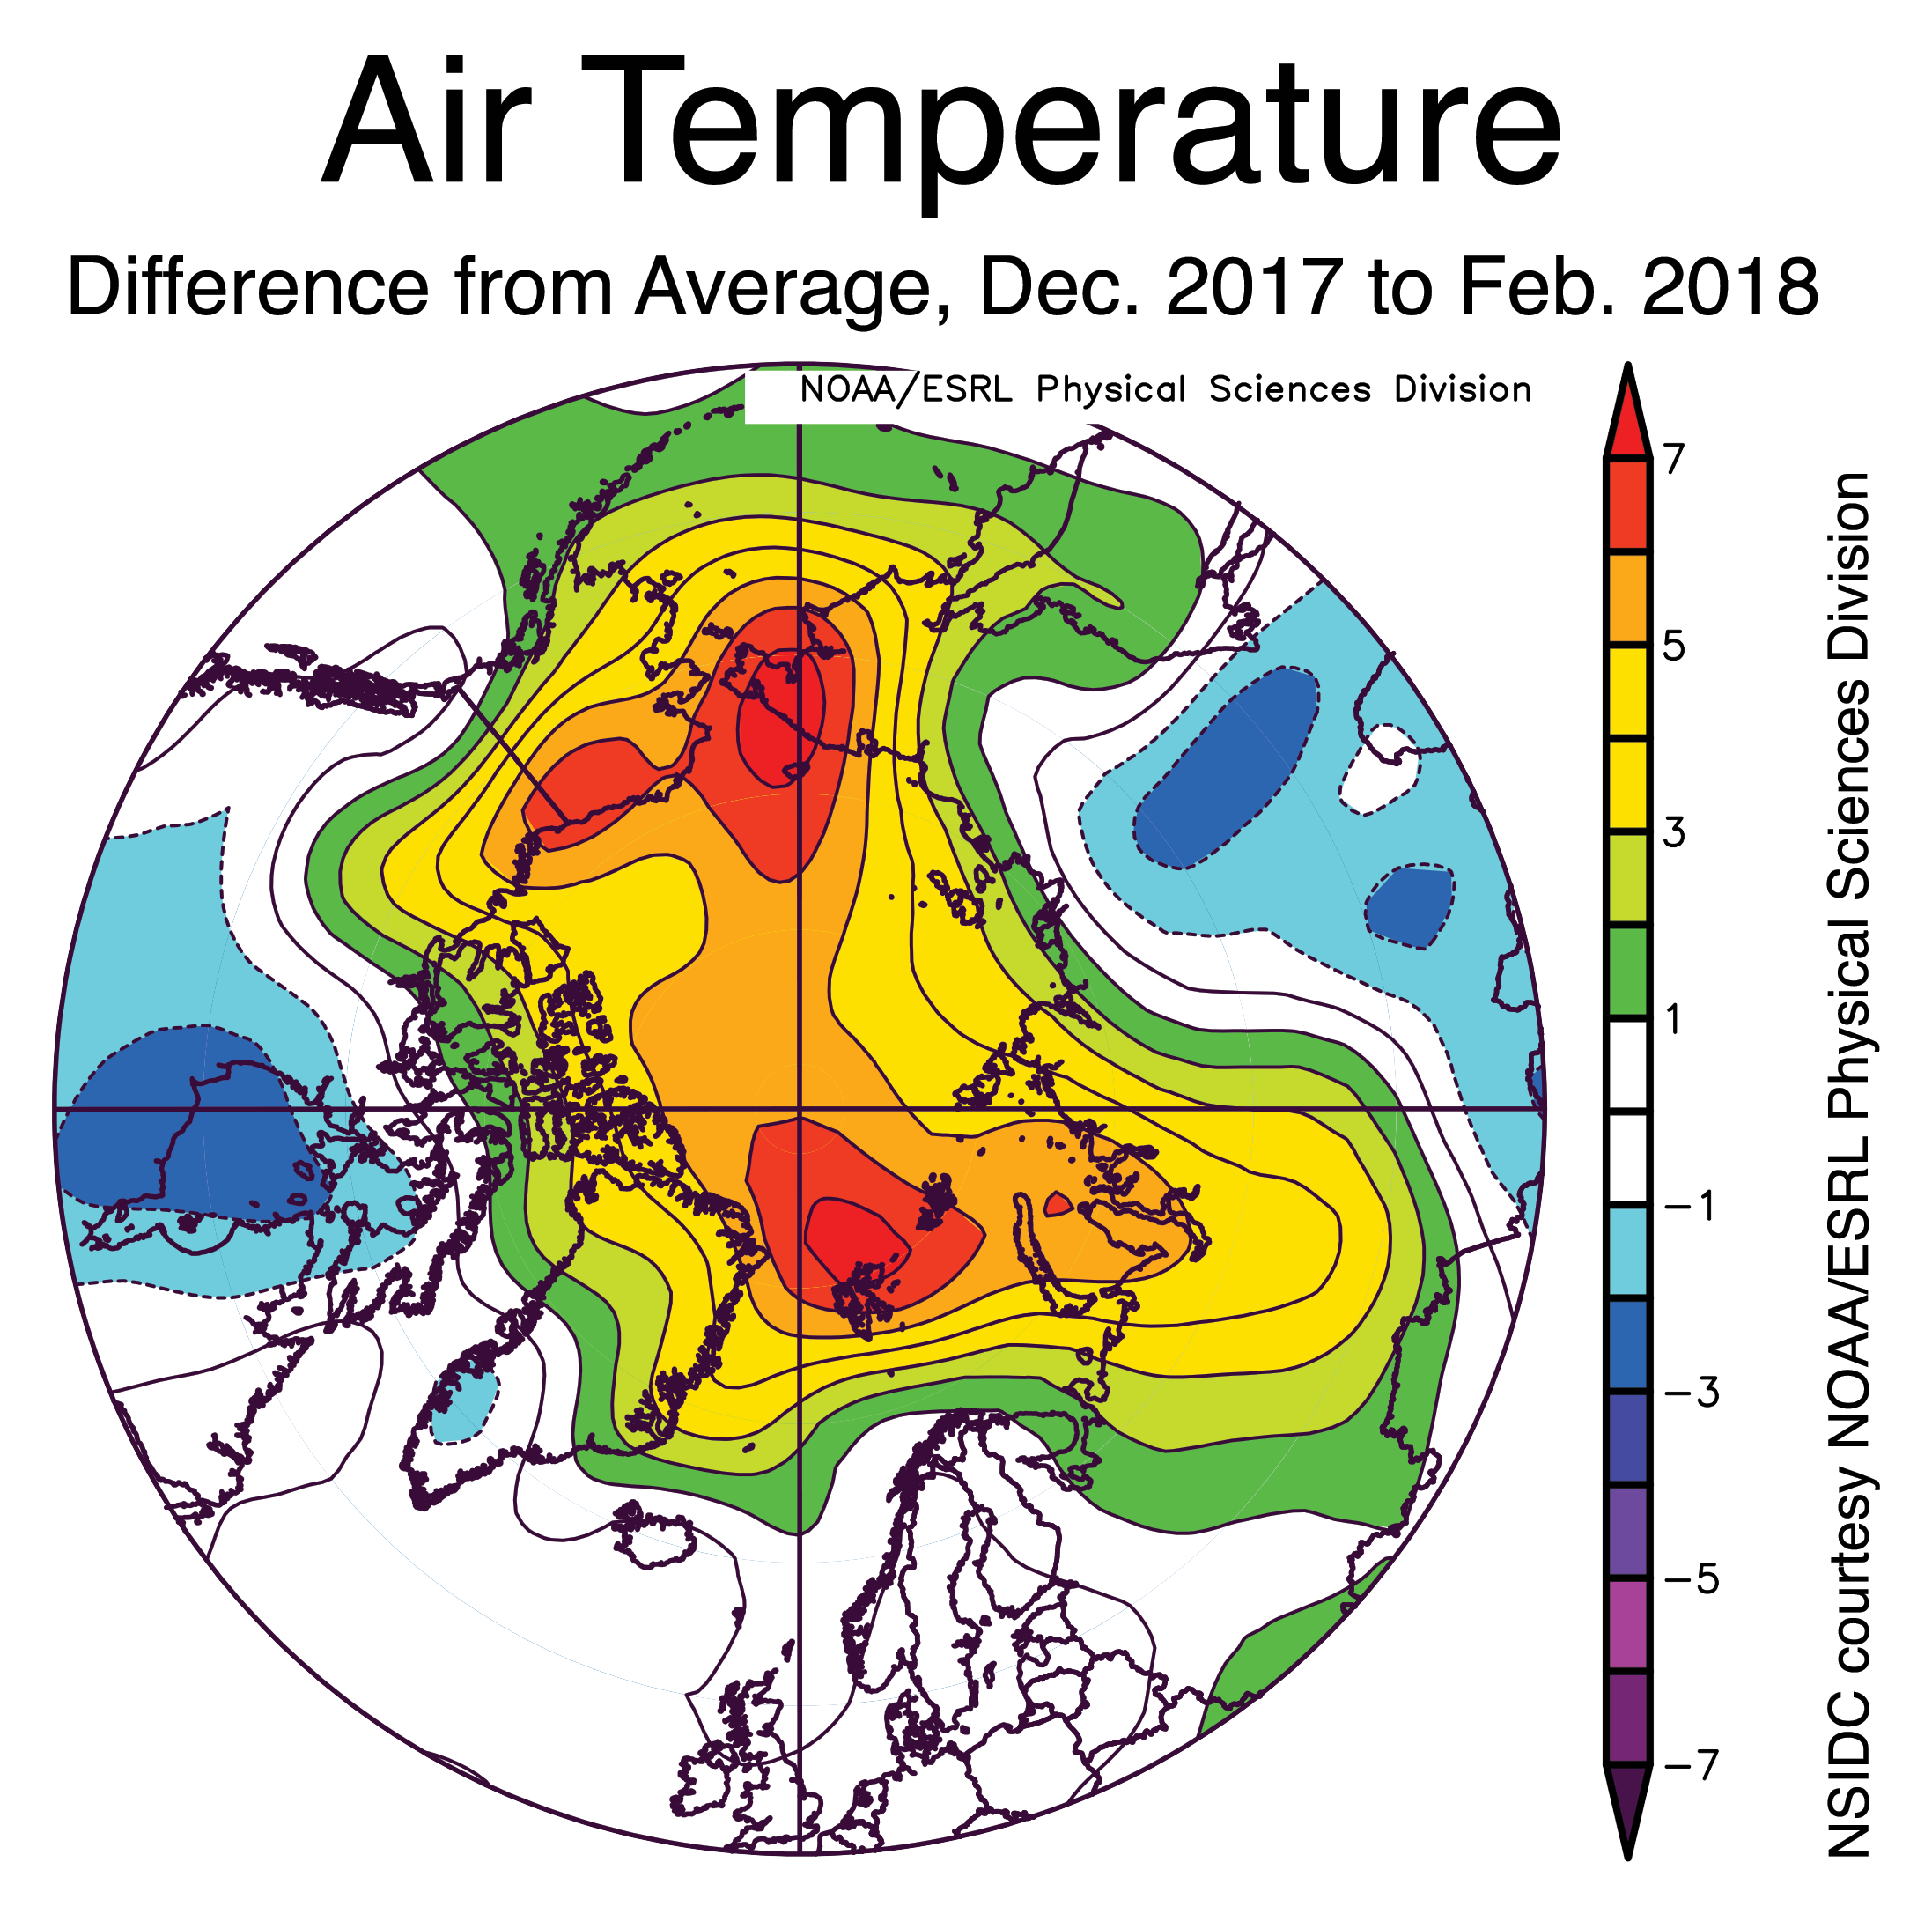
Figure 4. This plot shows the departure from average air temperature in the Arctic at the 925 hPa level, in degrees Celsius, for December 2017 and January and February in 2018. Yellows and reds indicate higher than average temperature; blues and purples indicate lower than average temperature.
Credit: NSIDC courtesy NOAA Earth System Research Laboratory Physical Sciences Division
High-resolution image
Unusually warm conditions and some prominent warm air intrusions characterized the 2017 to 2018 winter over the Arctic Ocean. Mean air temperature for the months of December, January, and February combined (the climatological winter season) was as much as 7 degrees Celsius (13 degrees Fahrenheit) higher than average, and nearly the entire Arctic Ocean was 4 degrees Celsius (7 degrees Fahrenheit) higher than average. This is the fourth year in a row that unusual jet stream patterns have led to warm air intrusions over the Arctic Ocean. However, some Arctic and subarctic land areas experienced unusually cold periods during the winter. Recent studies show that the frequency and intensity of warm air intrusions has increased in the last few years, particularly in the Atlantic sector, helping to reduce ice growth in the Barents Sea. The winter of 2017 to 2018 marks the second year in a row of pronounced warming events in the Pacific sector.
Deep snow in Russia and Europe

Figure 5. These images show Northern Hemisphere water equivalent of snow cover in millimeters (top) and Northern Hemisphere total snow mass in gigatons (bottom) from October 2017 to March 31, 2018.
Credit: GlobSnow Project and the Finnish Meteorological Institute
High-resolution image
Snow cover extent on the land masses surrounding the Arctic Ocean was average this past winter. However, an analysis of the snow cover thickness and density showed that the total snow mass this past winter was high. Estimates of total snow mass as of March 31 showed that the Northern Hemisphere had nearly 700 billion tons more snow this winter than the 1982 to 2012 average. Many areas of Russia and northern Europe had more than 150 millimeters (6 inches) of water-equivalent on the ground, present as deep snow cover. Snow extent had been above average the entire autumn-winter season but grew to exceptional levels beginning in February. Although the total snow mass has begun to decrease, it is still far above average. The analysis is based on many sources of snow and snow depth data, including passive microwave data produced by NSIDC (EASE-Grid Snow Water Equivalent and Daily Snow Cover), and data derived from several other groups from the European Space Agency and the National Oceanographic and Atmospheric Administration.
Sea ice drift in the Arctic Ocean
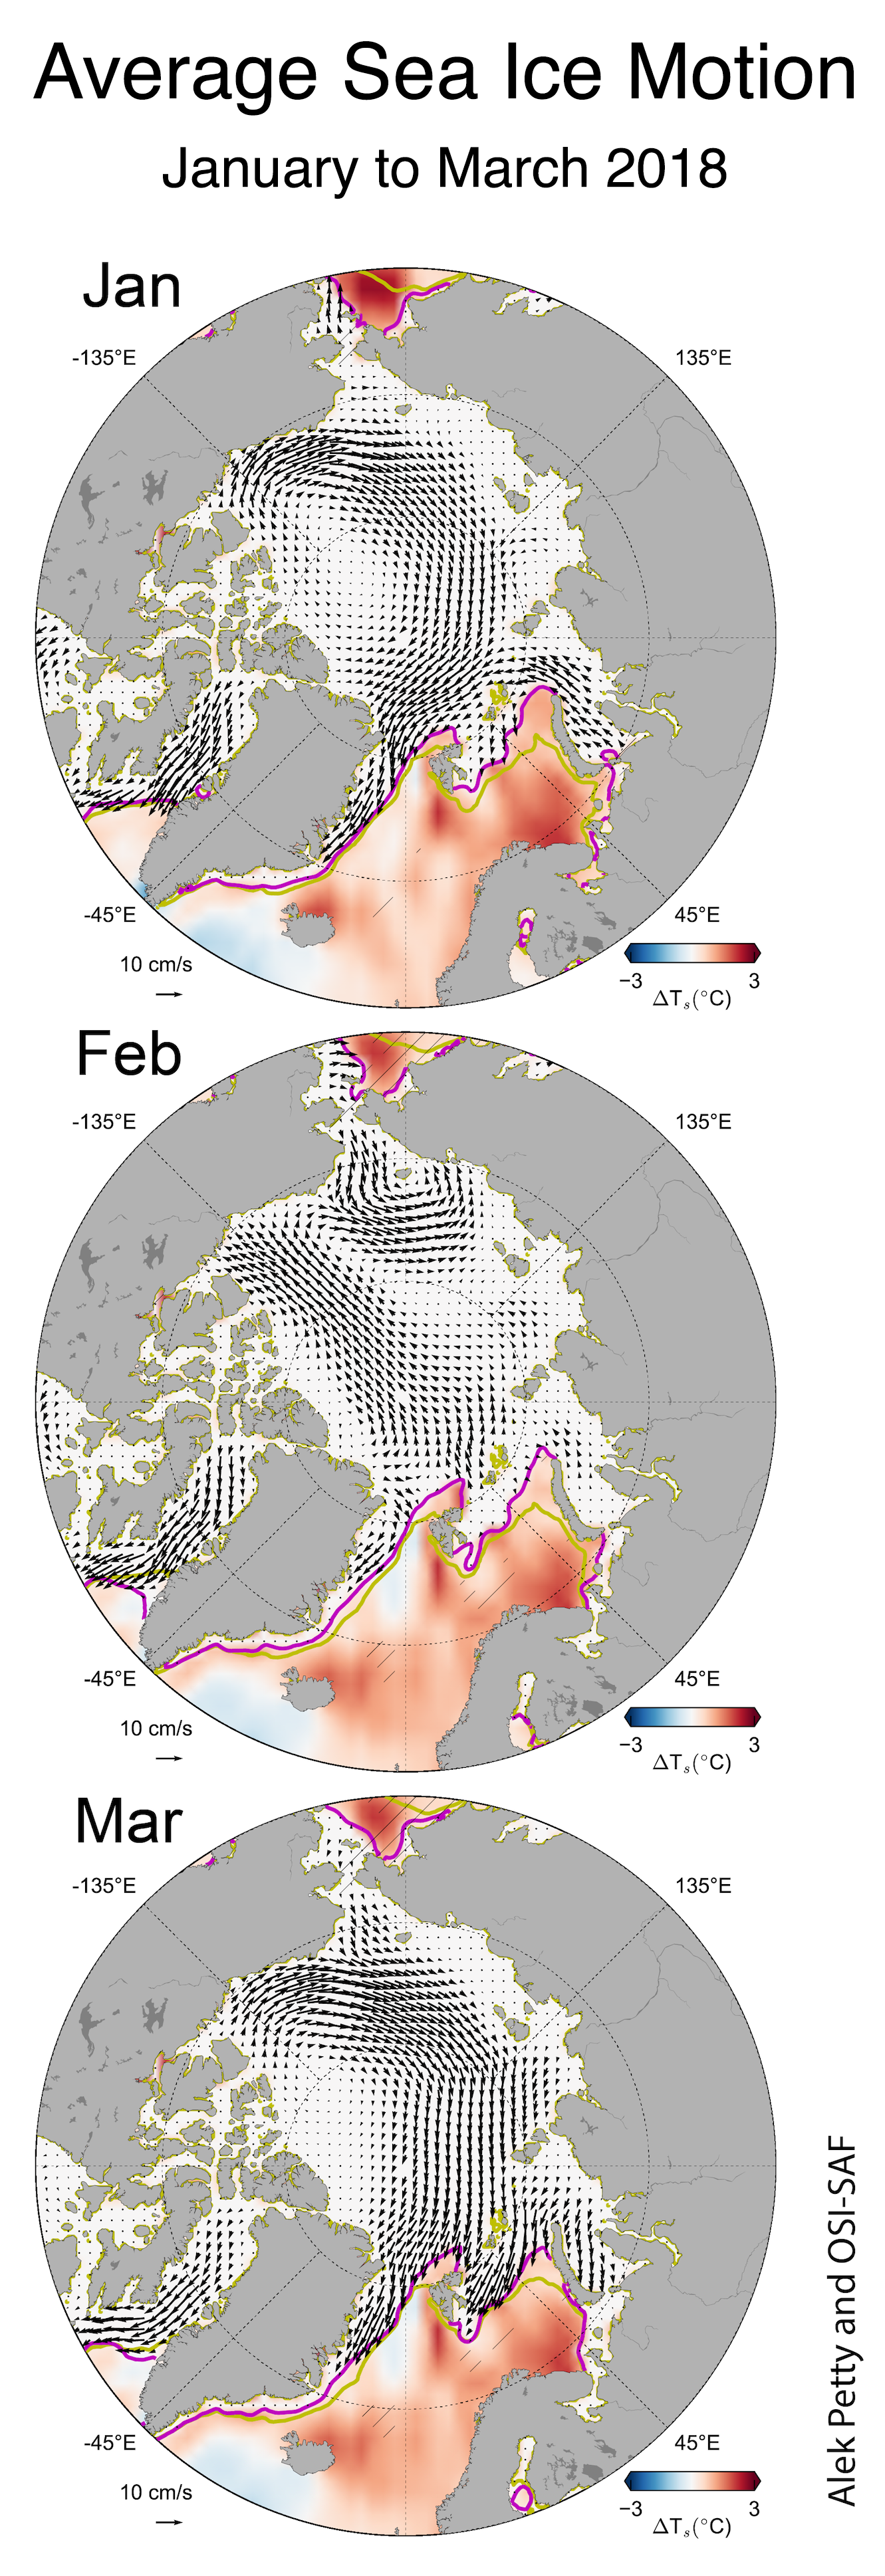
Figure 6. This plot shows monthly average sea ice motion in the Arctic, in centimeters per second, for the months of January, February, and March in 2018.
Credit: Alek Petty/NASA Goddard Space Flight Center (GSFC) and the Ocean and Sea Ice Satellite Application Facility (OSI-SAF)
High-resolution image
Plots of monthly average sea ice motion for January, February, and March 2018 reveal pronounced changes in drift direction, since sea ice movement is largely controlled by winds, and therefore storms and pressure patterns. The maps include averages of sea surface temperature outside of the ice-covered area, and indicate that the surface of both the northern Pacific and northern Atlantic were substantially warmer relative to a 1982 to 2015 reference period. Strong Beaufort Gyre and Transpolar Drift patterns were present for January and March of 2018. Ice motion and sea surface temperature data are based on a multi-sensor estimate created by the Ocean and Sea Ice Satellite Application Facility (OSI-SAF), a European meteorological consortium.
Seasonal increase in Antarctic sea ice
After reaching a minimum extent for the year on February 20 and 21, Antarctic sea ice grew rapidly in March 2018. Sea ice extent averaged 3.53 million square kilometers (1.36 million square miles) for the month, not far below the 1981 to 2010 average of 4.03 million square kilometers (1.56 million square miles). Growth was especially rapid in the Amundsen and Ross Seas, nearly erasing the area of below-average sea ice extent that had been in the eastern Ross Sea and western Amundsen in early March.
Rapid sea ice growth in the Amundsen and eastern Ross Seas was reflected in temperatures at the 925 hPa level that were 1 to 3 degrees Celsius (2 to 5 degrees Fahrenheit) below average across the Pine Island Bay region. This is likely related to cool winds from the south coming up against the west side of a low-pressure area over the Bellingshausen Sea. By comparison, temperatures 2.5 to 4.5 degrees Celsius (4 to 8 degrees Fahrenheit) higher than average were the rule over much of the continental interior from Dronning Maud Land to northern Victoria Land along the Transantarctic Mountains. The index of the strength of the circumpolar vortex (or Southern Annular Mode) was near-neutral for March.
References
Boisvert, L. N., A. A. Petty, and J. Stroeve. 2016. The Impact of the Extreme Winter 2015/16 Arctic Cyclone on the Barents–Kara Seas, Bulletin of the American Meteorological Society, doi:10.1175/MWR-D-16-0234.1.
Graham, R. M., L. Cohen, A. A. Petty, L. N. Boisvert, A. Rinke, S. R. Hudson, M. Nicolaus, and M. A. Granskog. 2017. Increasing frequency and duration of Arctic winter warming events, Geophysical Research Letters, 44, 6974–6983, doi:10.1002/2017GL073395.
Ricker, R., S. Hendricks, F. Girard-Ardhuin, L. Kaleschke, C. Lique, X. Tian-Kunze, M. Nicolaus, and T. Krumpen. 2017. Satellite observed drop of Arctic sea ice growth in winter 2015-2015, Geophysical Research Letters, doi:10.1002/2016GL072244.
Rinke, A., M. Maturilli, R. M. Graham, H. Matthes, D. Handorf, L. Cohen, S. R. Hudson, and J. C. Moore. 2017. Extreme cyclone events in the Arctic: Wintertime variability and trends , Environmental Research Letters, 12 (9), 094006, doi:10.1088/1748-9326/aa7def.
Correction
On April 20, we revised a sentence under the section Seasonal increase in Antarctic sea ice. The sentence originally read “Growth was especially rapid in the Amundsen and eastern Ross Sea, where sea ice was nearly absent at the time of the minimum extent, and along the East Antarctic coast, where many areas now exceed the daily median extent for the end of March.” We revised it to “Growth was especially rapid in the Amundsen and Ross Seas, nearly erasing the area of below-average sea ice extent that had been in the eastern Ross Sea and western Amundsen in early March.”

