Arctic sea ice appears to have reached its annual maximum extent on March 17. This is the second lowest Arctic maximum in the 39-year satellite record. The four lowest maximum extents in the satellite record have all occurred in the past four years. NSIDC will post a detailed analysis of the 2017 to 2018 winter sea ice conditions in our regular monthly post in early April.
Overview of conditions
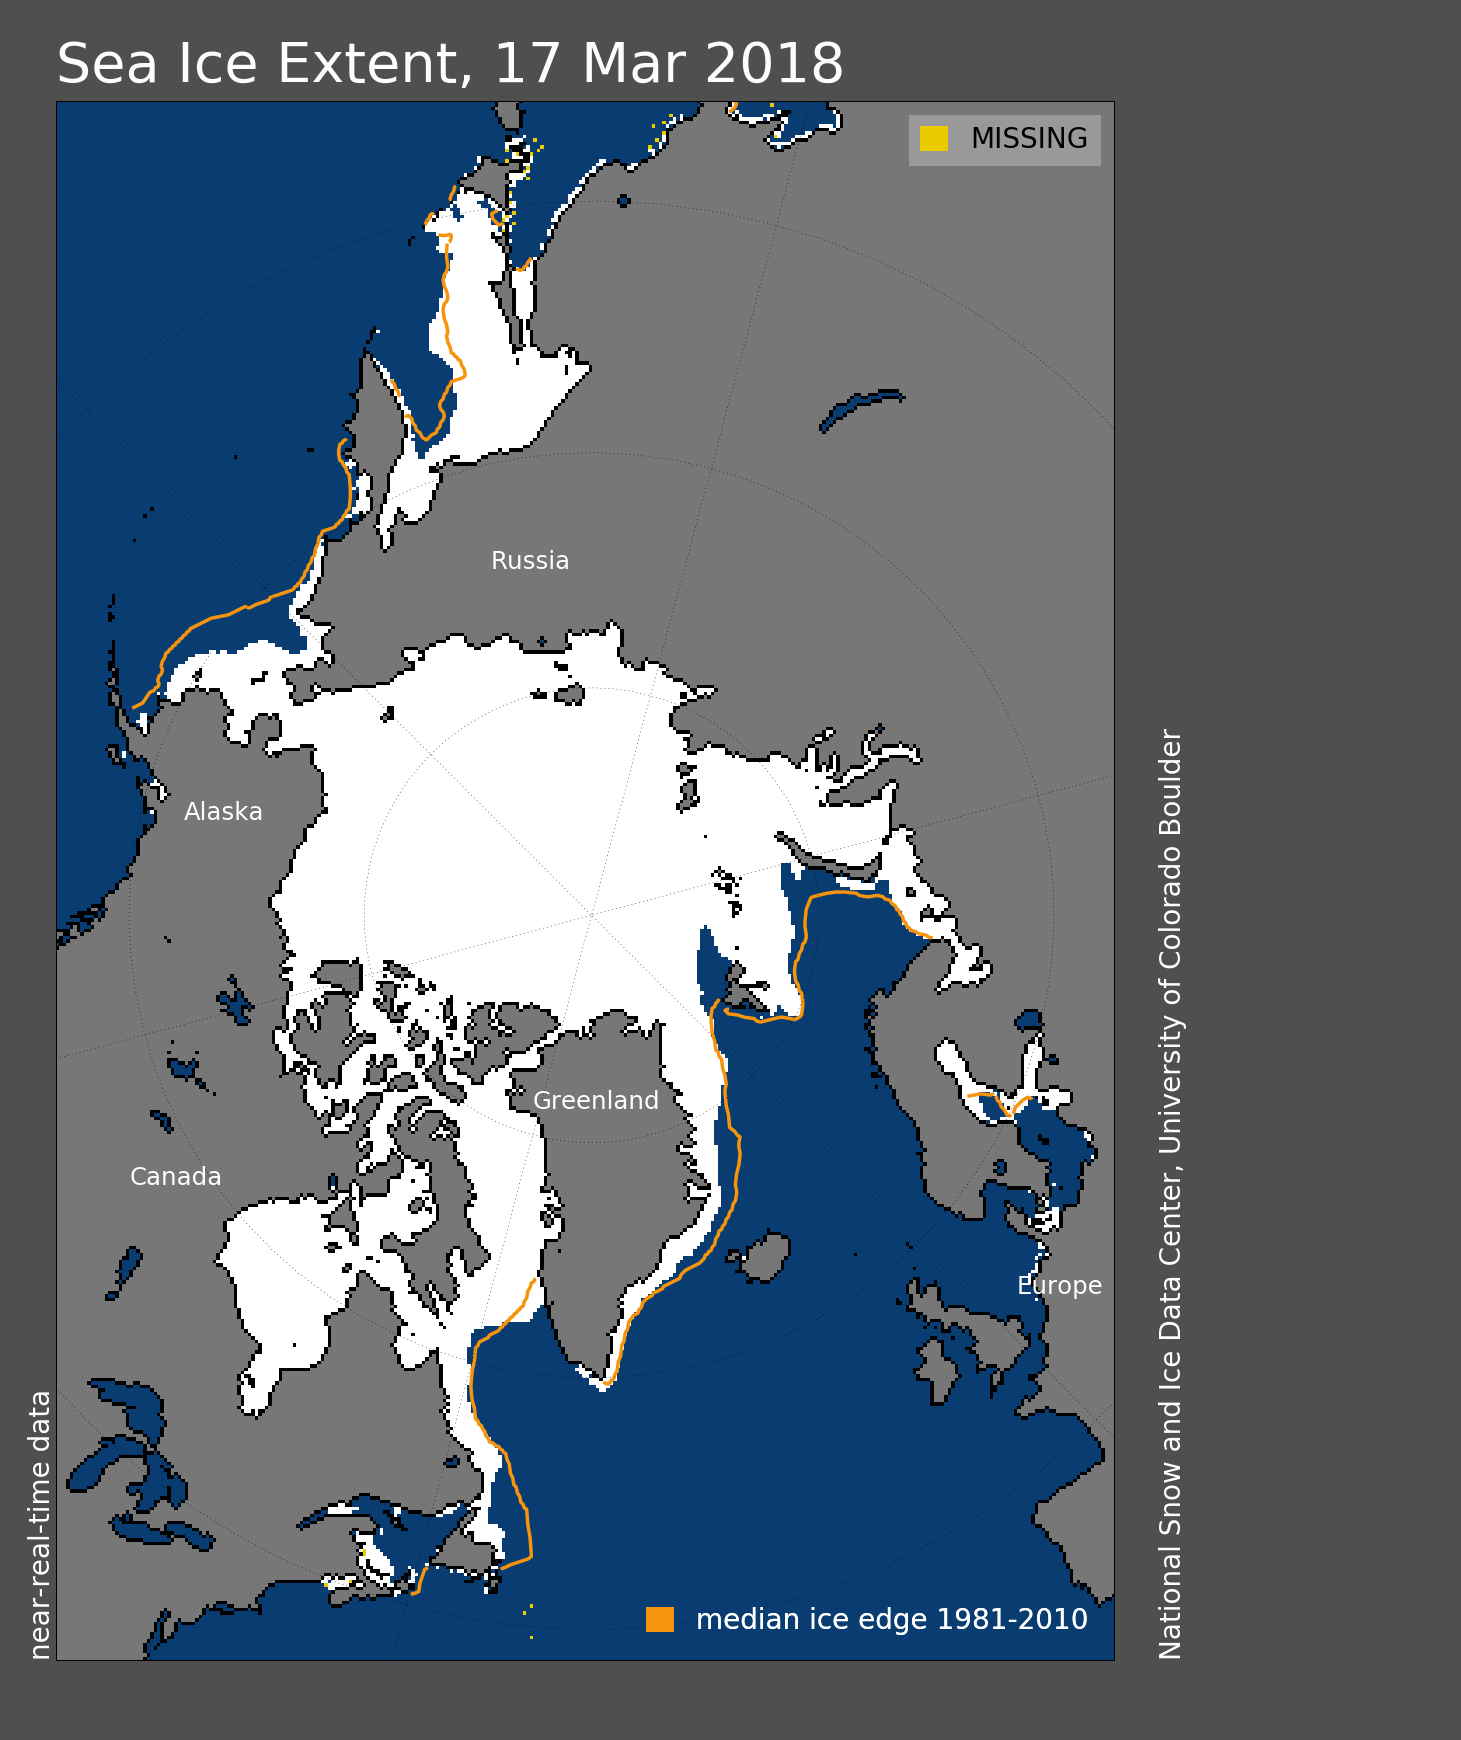
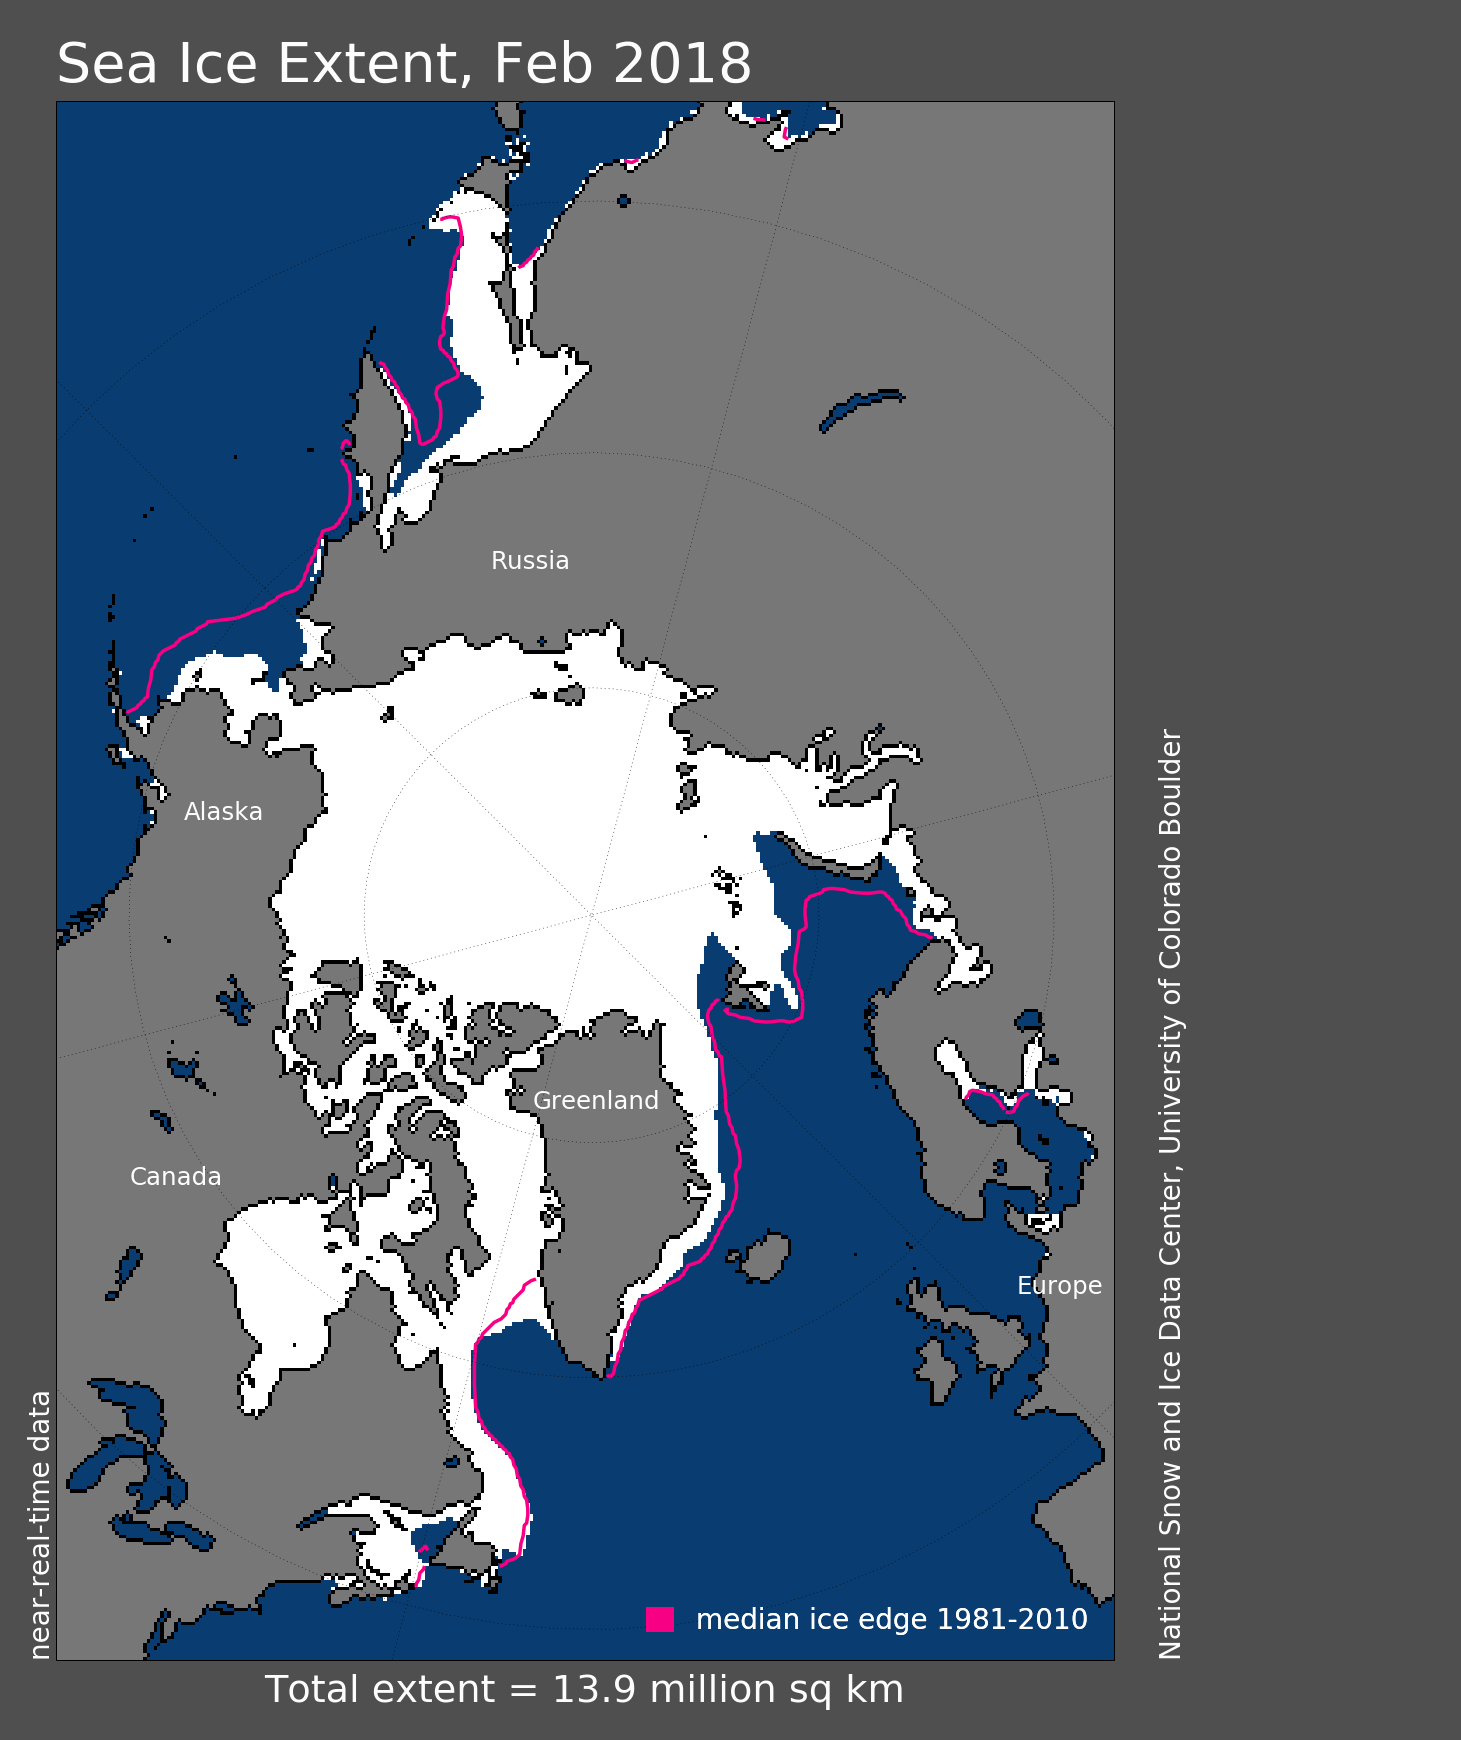
Figure 1. Arctic sea ice extent for March 17, 2018 was 14.48 million square kilometers (5.59 million square miles). The orange line shows the 1981 to 2010 average extent for that day. Sea Ice Index data. About the data
Credit: National Snow and Ice Data Center
High-resolution image
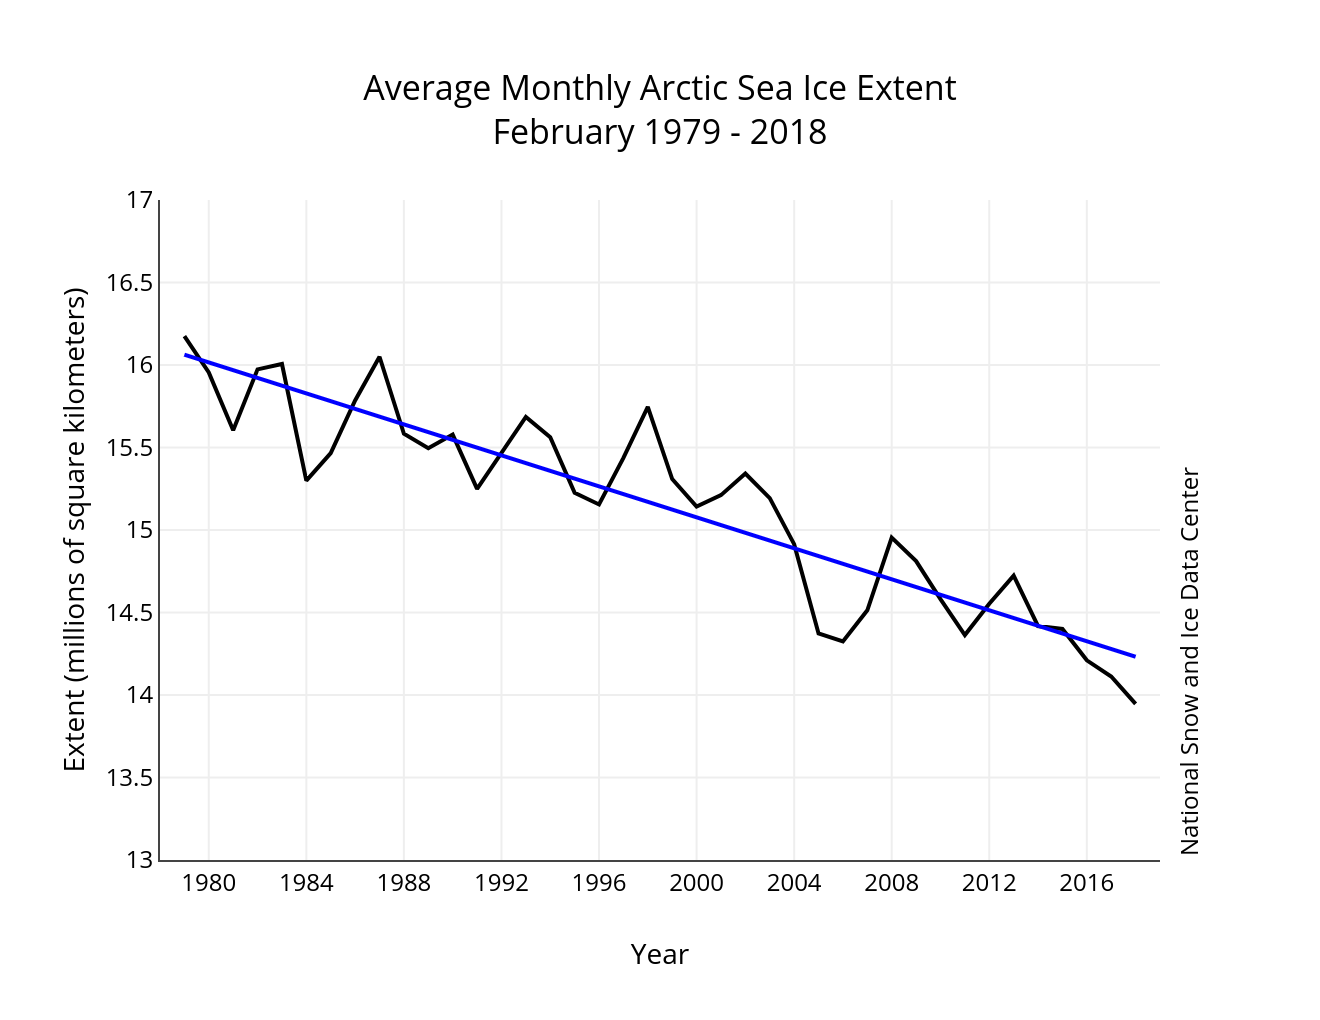
On March 17, 2018, Arctic sea ice likely reached its maximum extent for the year, at 14.48 million square kilometers (5.59 million square miles), the second lowest in the 39-year satellite record, falling just behind 2017. This year’s maximum extent is 1.16 million square kilometers (448,000 square miles) below the 1981 to 2010 average maximum of 15.64 million square kilometers (6.04 million square miles).
The four lowest seasonal maxima have all occurred during the last four years. The 2018 maximum is 60,000 square kilometers (23,200 square miles) above the record low maximum that occurred on March 7, 2017; 40,000 square kilometers (15,400 square miles) below the 2015 and 2016 maxima (now tied for third lowest); and is 190,000 square kilometers (73,400 square miles) below the 2011 maximum, which is now fifth lowest.
In March 2017, we reported a new record maximum being set, with 2016 sliding to the second lowest, and 2015 the third lowest. In November 2017, we updated our calculation of the monthly average sea ice extent in the NSIDC Sea Ice Index, resulting in 2016 tying with 2015.
The date of the maximum this year, March 17, was five days later than normal compared to the 1981 to 2010 median date of March 12.
Conditions in context
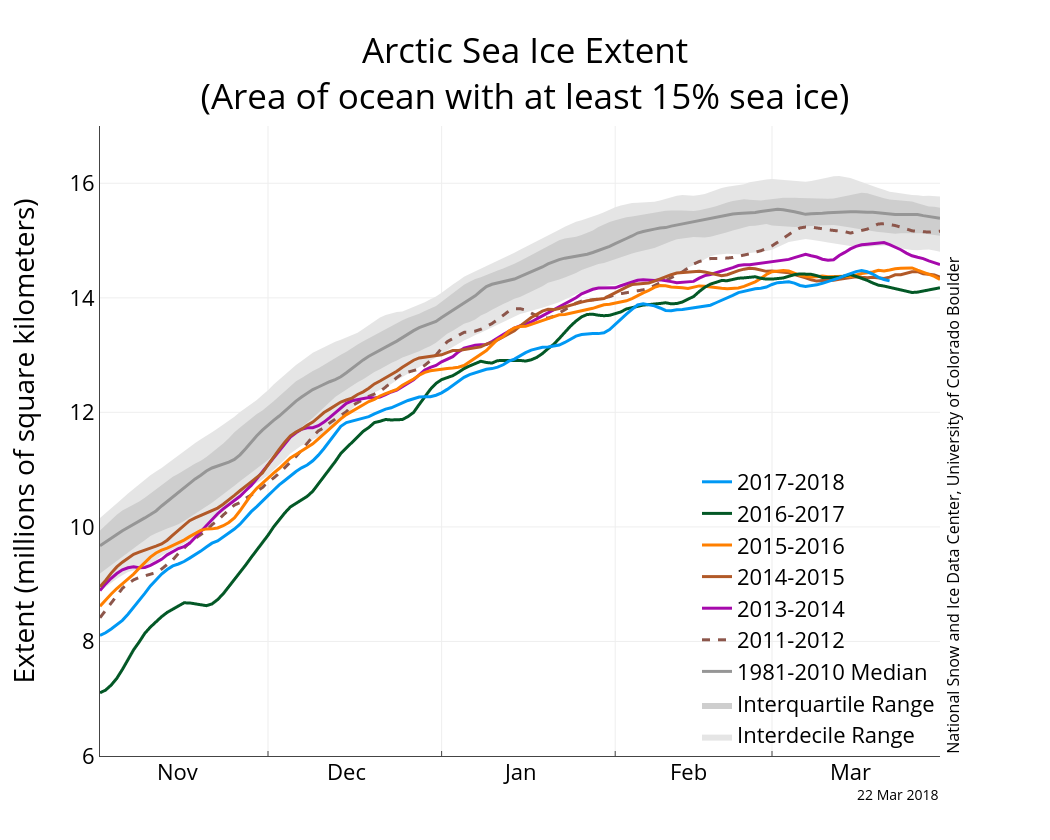
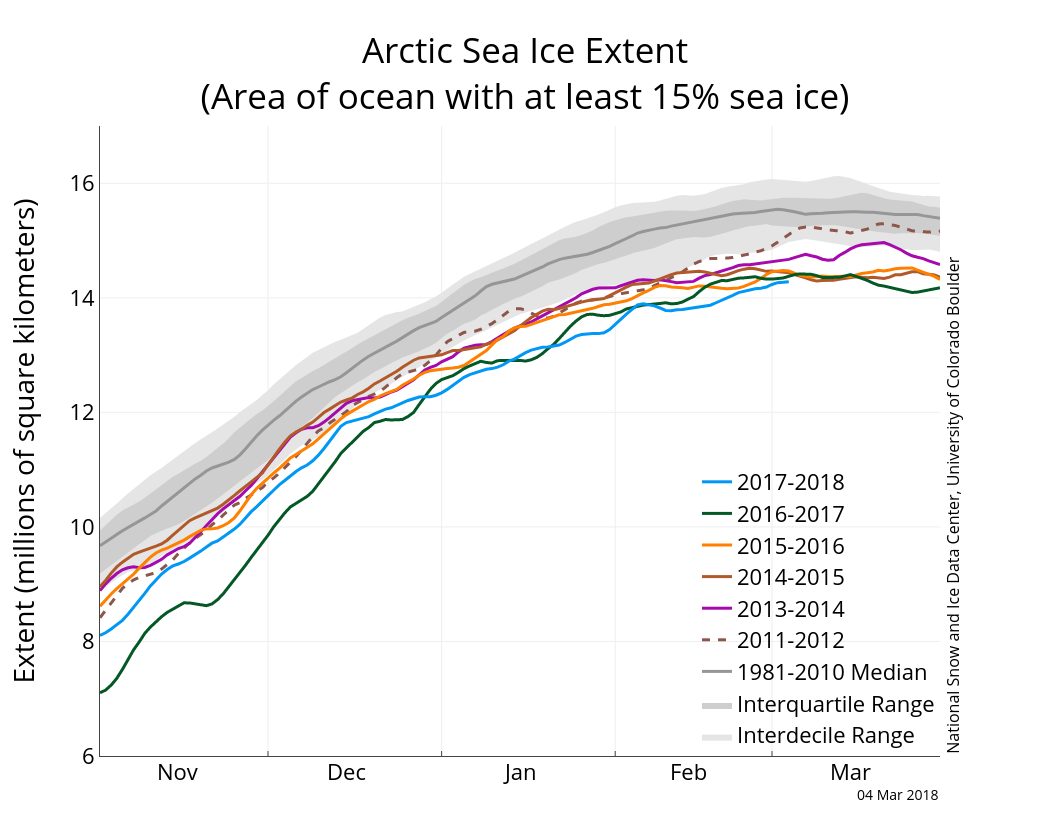
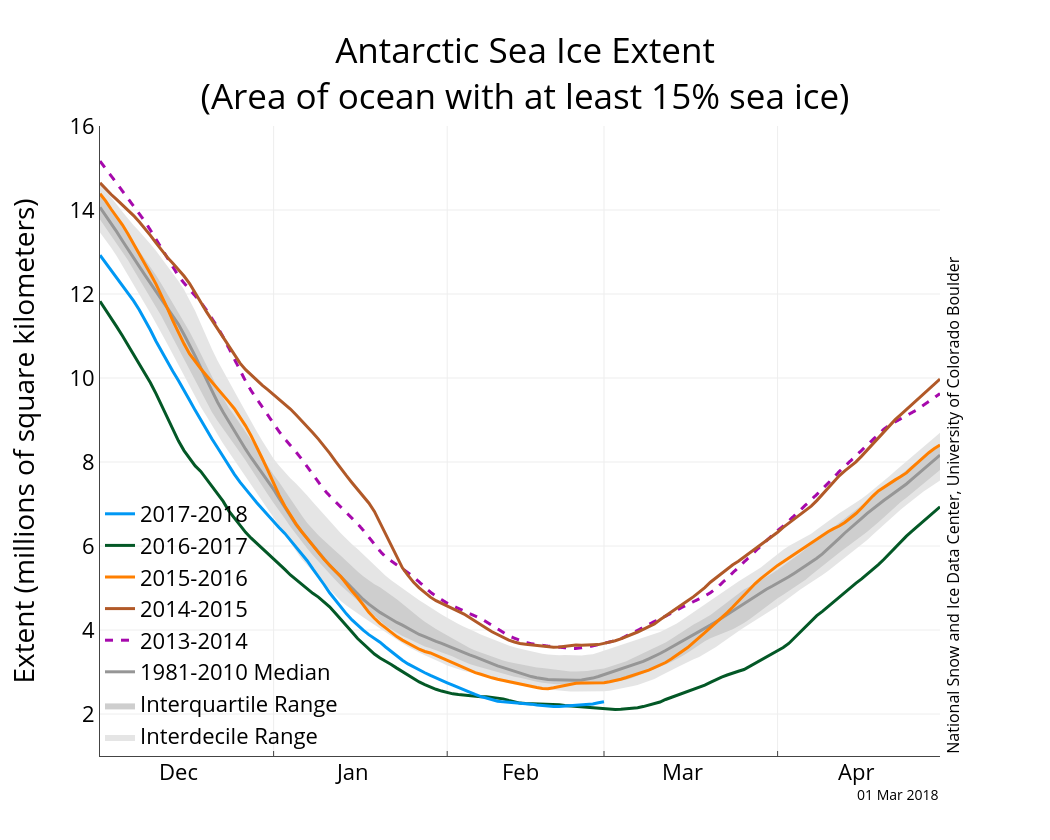
Figure 2. The graph above shows Arctic sea ice extent as of March 22, 2018, along with daily ice extent data for four previous years and the record low year. 2017 to 2018 is shown in blue, 2016 to 2017 in green, 2015 to 2016 in orange, 2014 to 2015 in brown, 2013 to 2014 in magenta, and the record low year 2011 to 2012 in dashed brown. The 1981 to 2010 median is in dark gray. The gray areas around the median line show the interquartile and interdecile ranges of the data. Sea Ice Index data.
Credit: National Snow and Ice Data Center
High-resolution image
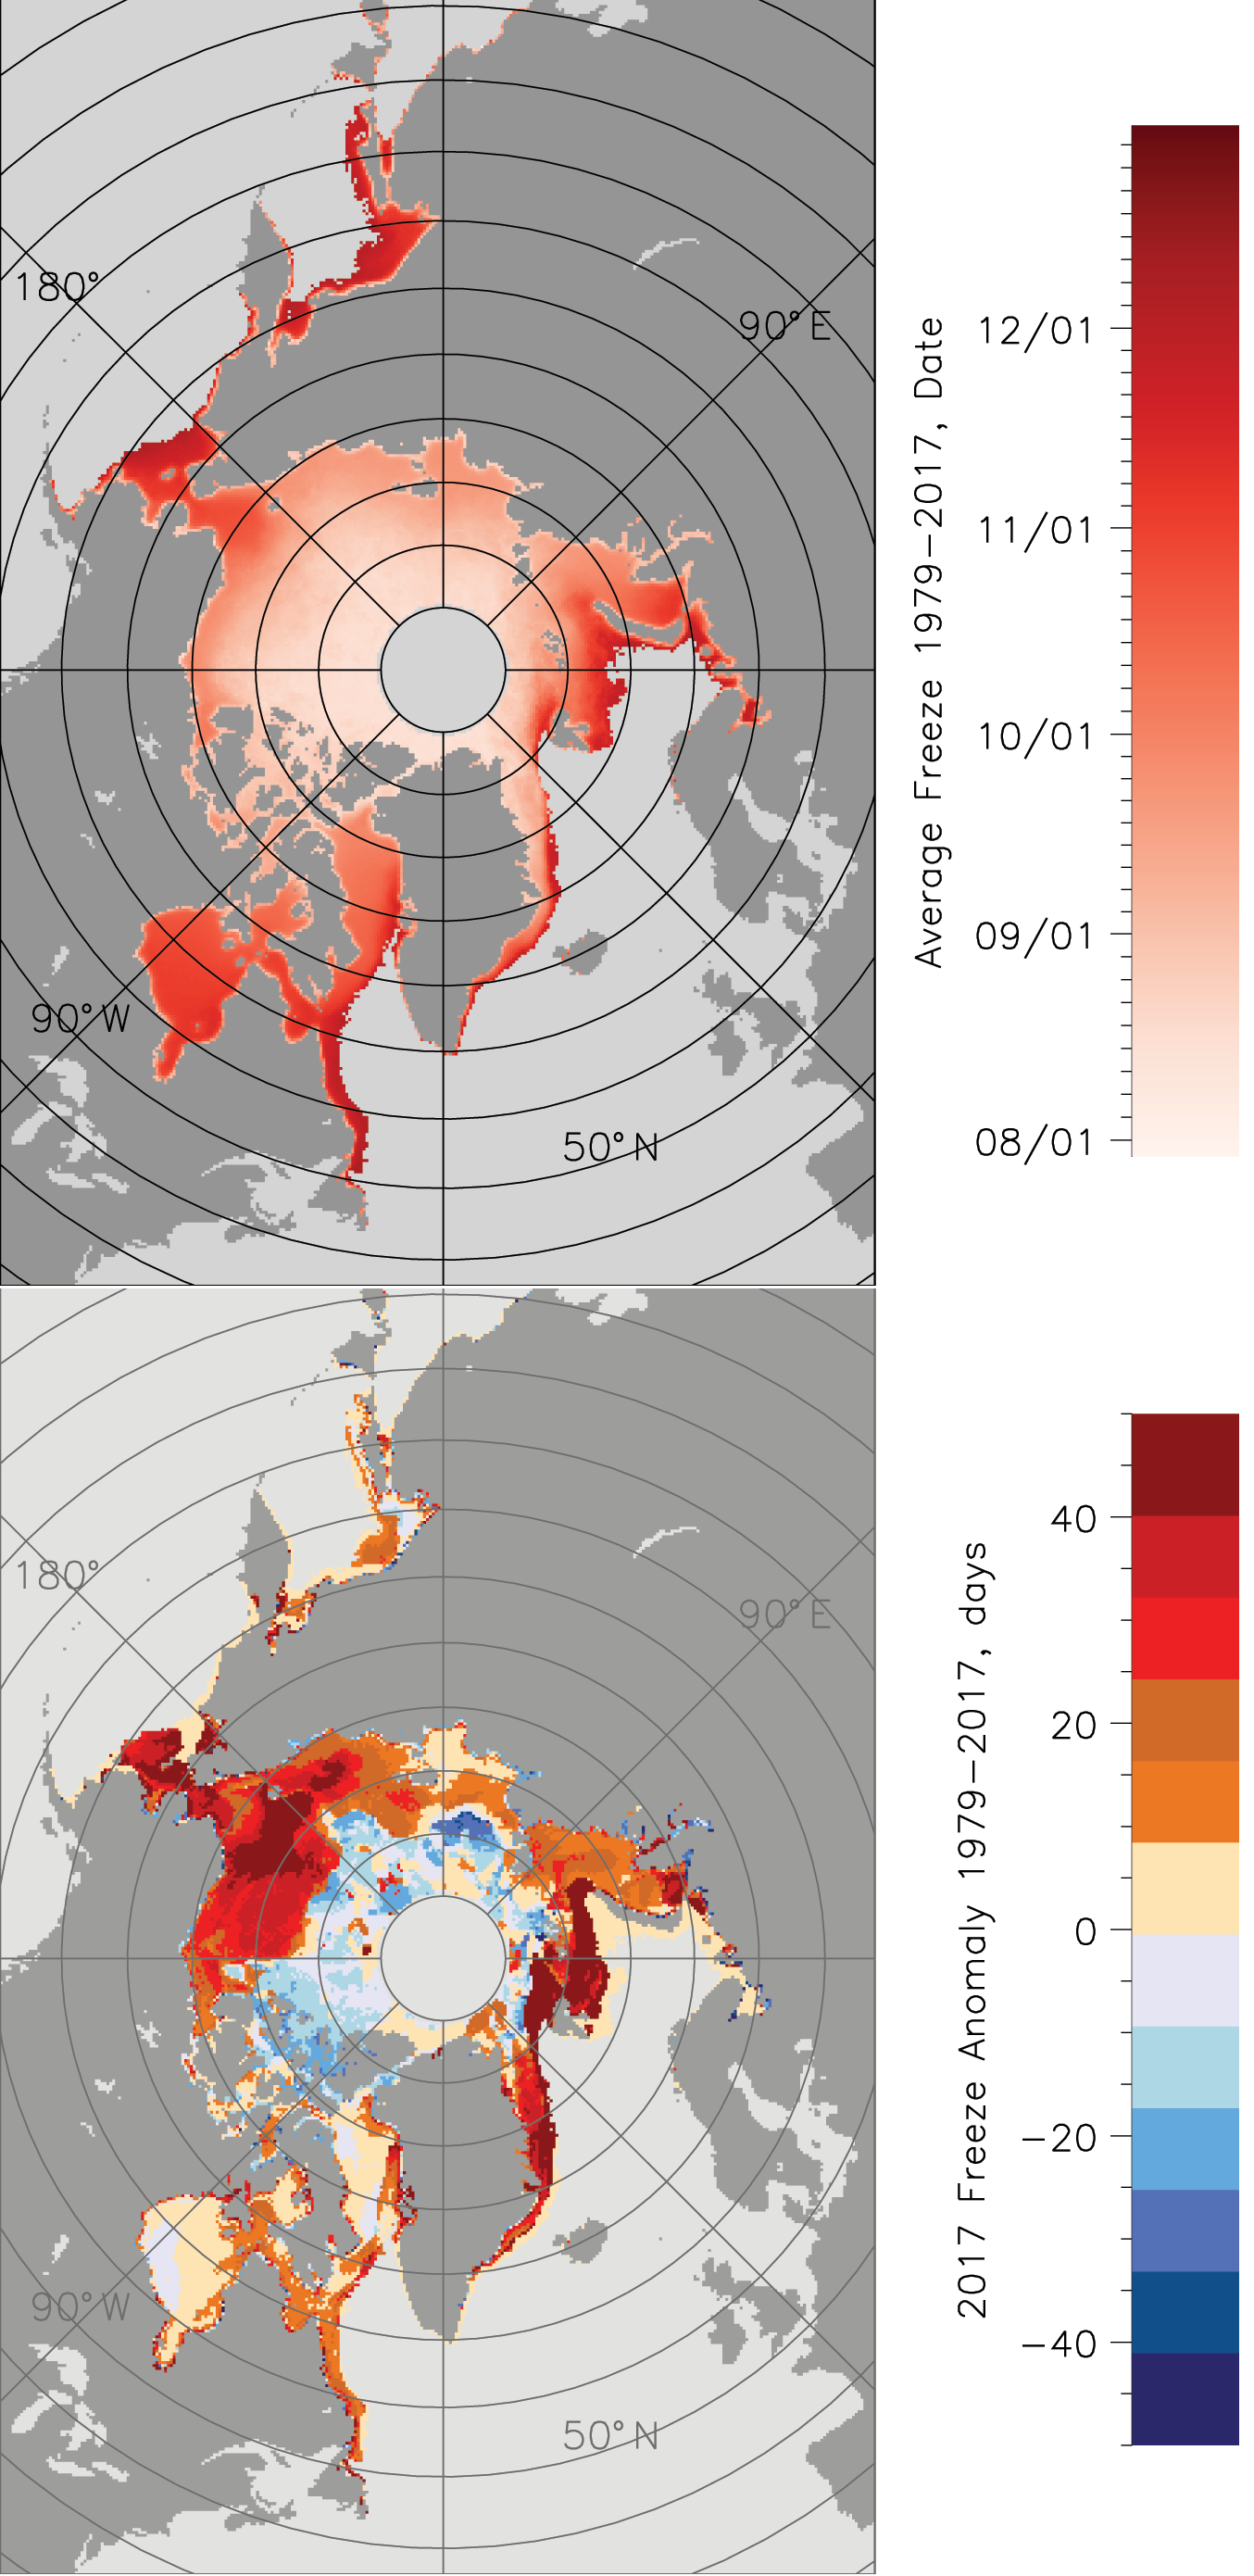
The ice growth season ended with very low sea ice extents in the Bering Sea in the Pacific side of the Arctic, and in the Barents Sea in the Atlantic side of the Arctic. The regions of reduced ice cover reflect the combined influences of late autumn freeze-up as well as persistent high air temperatures throughout the winter. Freeze-up was especially late in the Chukchi Sea, due in part to the effects of strong ocean heat transport into the area through the Bering Strait. February then saw an early retreat of sea ice in the Bering Sea. Sea ice extent on the Atlantic side remained below average throughout the winter, which also appears linked to warm ocean waters. While air temperatures at the 925 hPa level (about 2,500 feet above sea level) remained well above average through most of winter, February saw an extreme heat wave over the Arctic Ocean. This is the fourth winter in a row that such heat waves have been recorded over the Arctic Ocean.
A late spurt in sea ice growth just prior to the maximum occurred in the Barents Sea near Novaya Zemlya; sea ice retreat just after the maximum was led by ice loss in the Bering Sea.
Table 1. Ten lowest maximum Arctic sea ice extents (satellite record, 1979 to present)
| Rank | Year | In millions of square kilometers | In millions of square miles | Date |
| 1 | 2017 | 14.42 | 5.57 | March 7 |
| 2 | 2018 | 14.48 | 5.59 | March 17 |
| 3 | 2015 | 14.52 | 5.61 | February 25 |
| 3 | 2016 | 14.52 | 5.61 | March 24 |
| 5 | 2011 | 14.67 | 5.66 | March 9 |
| 5 | 2006 | 14.68 | 5.67 | March 12 |
| 7 | 2007 | 14.77 | 5.7 | March 12 |
| 8 | 2005 | 14.95 | 5.77 | March 12 |
| 8 | 2014 | 14.96 | 5.78 | March 21 |
| 10 | 2009 | 15.17 | 5.84 | March 5 |
The Antarctic minimum
As noted in our previous post, in the Southern Hemisphere, sea ice reached its minimum extent for the year on February 20 and 21, at 2.18 million square kilometers (842,000 square miles). This year’s minimum extent was the second lowest in the satellite record, 70,000 square kilometers (27,00 square miles) above the record low set on March 3, 2017. The Antarctic minimum extent is 670,000 square kilometers (259,000 square miles) below the 1981 to 2010 average minimum of 2.85 million square kilometers (1.10 million square miles).
The February 20 and 21 timing of the minimum (the same extent was recorded on both dates) was just slightly earlier than the 1981 to 2010 median date of February 24 for the minimum. Over the satellite record, the Antarctic minimum has occurred as early as February 15 and as late as March 6.
Compared to the Arctic, air temperatures over the sea ice regions of Antarctica over the past season (austral summer) have been closer to their climatological average, hovering within 2 degrees Celsius (4 degrees Fahrenheit) of the 1981 to 2010 average. Relatively rapid and early growth of ice along the eastern Weddell Sea ice edge led the beginning of the autumn sea ice expansion.
Final analysis pending
Please note this is a preliminary announcement. At the beginning of April, NSIDC scientists will release a full analysis of winter conditions in the Arctic, along with monthly data for March.