Average sea ice extent for August 2017 ended up third lowest in the satellite record. Ice loss rates through August were variable, but slower overall than in recent years. Extensive areas of low concentration ice cover (40 to 70 percent) are still present across much of the Eurasian side of the Arctic Ocean.
Overview of conditions
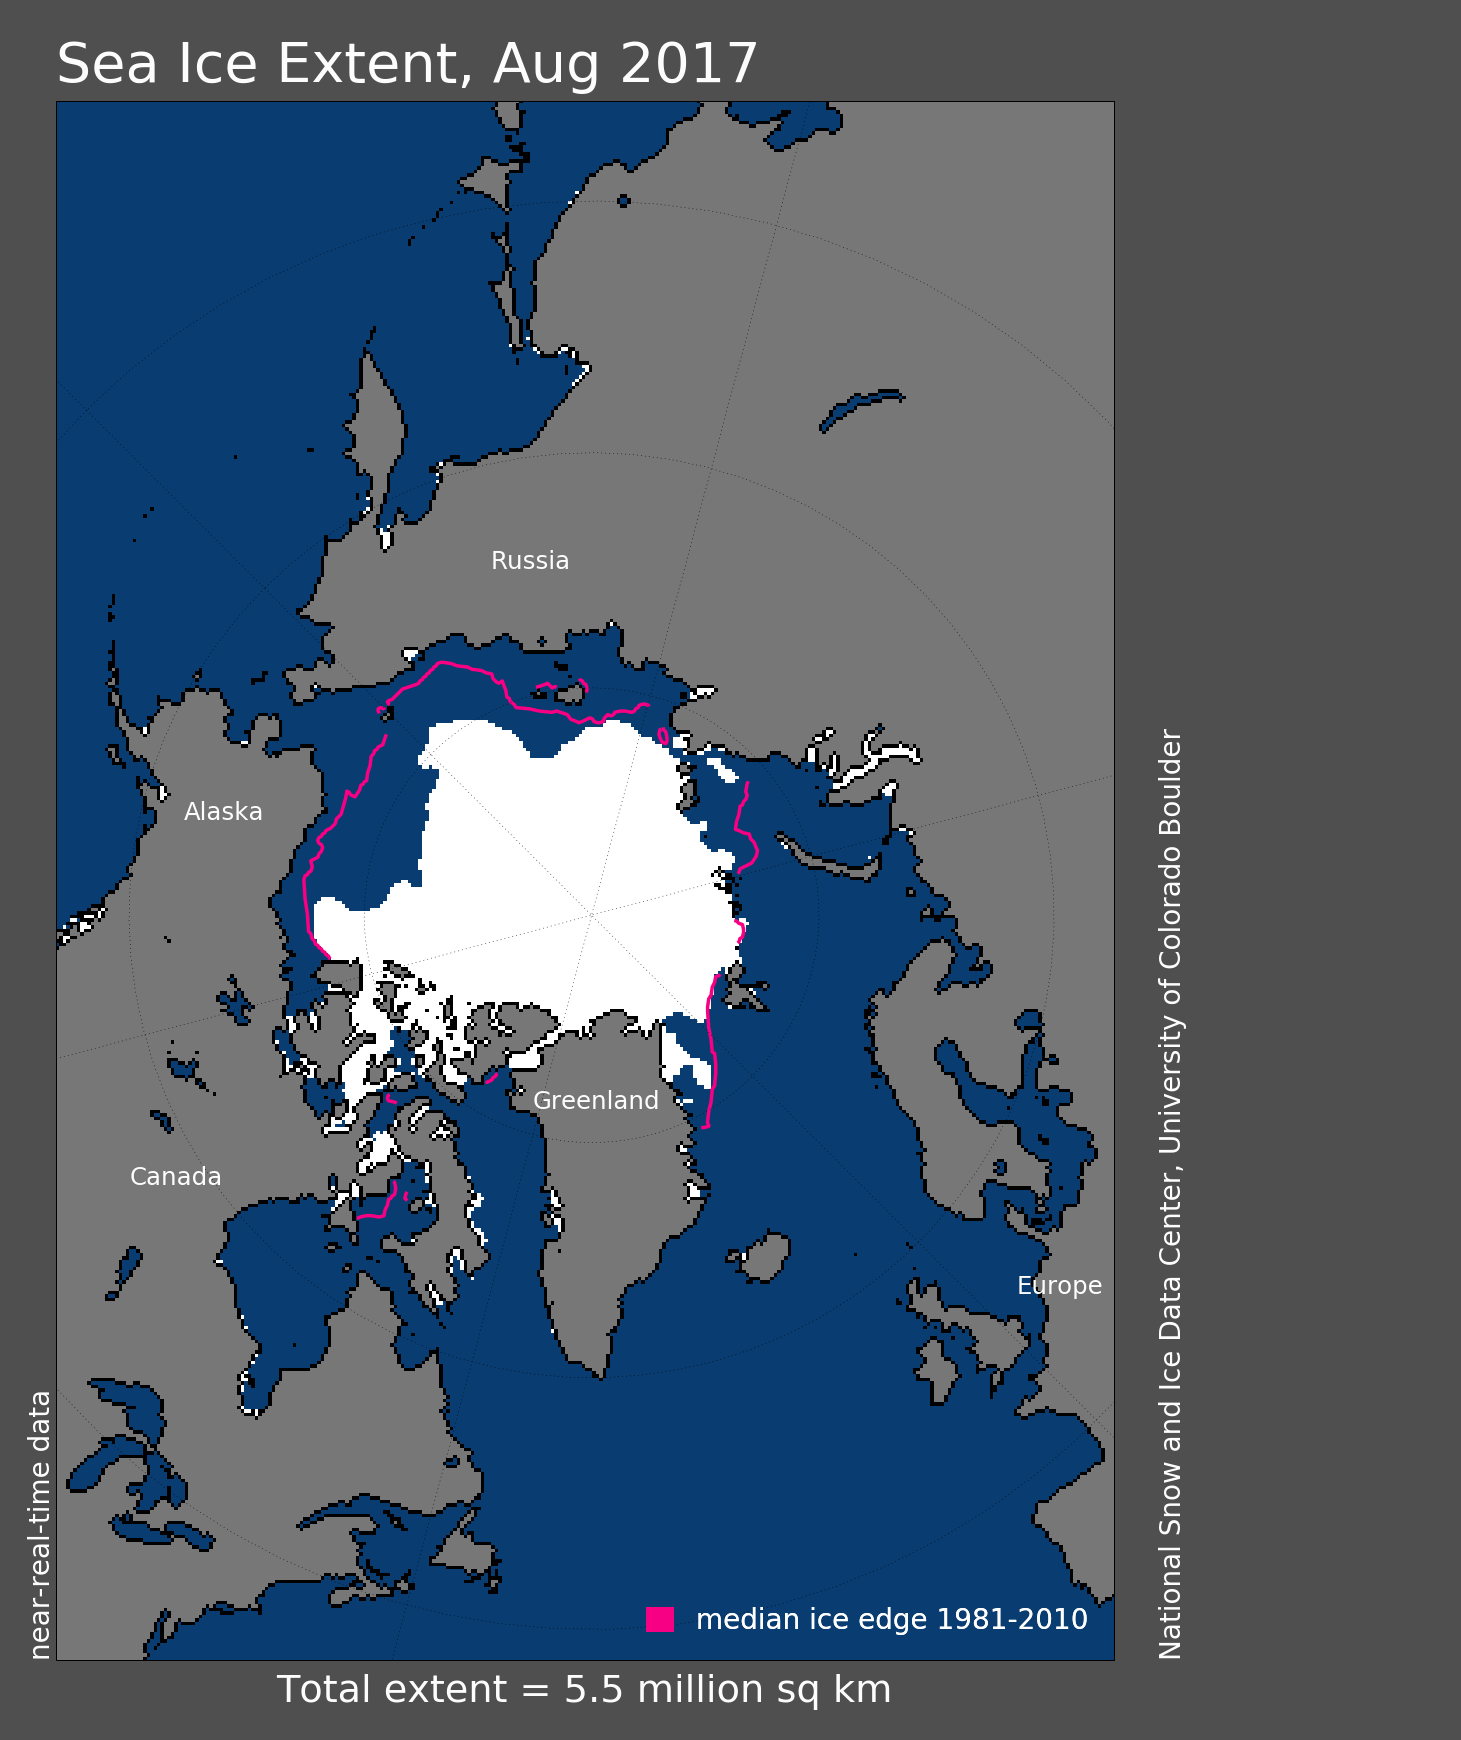
Figure 1. Arctic sea ice extent for August 2017 was 5.51 million square kilometers (2.13 million square miles). The magenta line shows the 1981 to 2010 average extent for that month. Sea Ice Index data. About the data
Credit: National Snow and Ice Data Center
High-resolution image
Arctic sea ice extent for August 2017 averaged 5.51 million square kilometers (2.13 million square miles), the third lowest August in the 1979 to 2017 satellite record. This was 1.77 million square kilometers (683,000 square miles) below the 1981 to 2010 average, and 800,000 square kilometers (309,000 square miles) above the record low August set in 2012.
Ice retreat was most pronounced in the western Beaufort Sea. A large region in the Beaufort Sea and East Siberian Sea has low concentration sea ice (40 to 70 percent). Patches of low concentration sea ice and some open water northeast of the Taymyr Peninsula are also present.
While a record low minimum extent in the Arctic is unlikely this year, the ice edge in the Beaufort Sea is extremely far north. In parts of this region, the ice edge is farther north than at any time since the satellite record began in 1979. This highlights the pronounced regional variability in ice conditions from year to year. A couple of the models that contribute to the Sea Ice Prediction Network Sea Ice Outlooks forecasted significantly less ice in the Beaufort Sea in July this year compared to average conditions.
Conditions in context
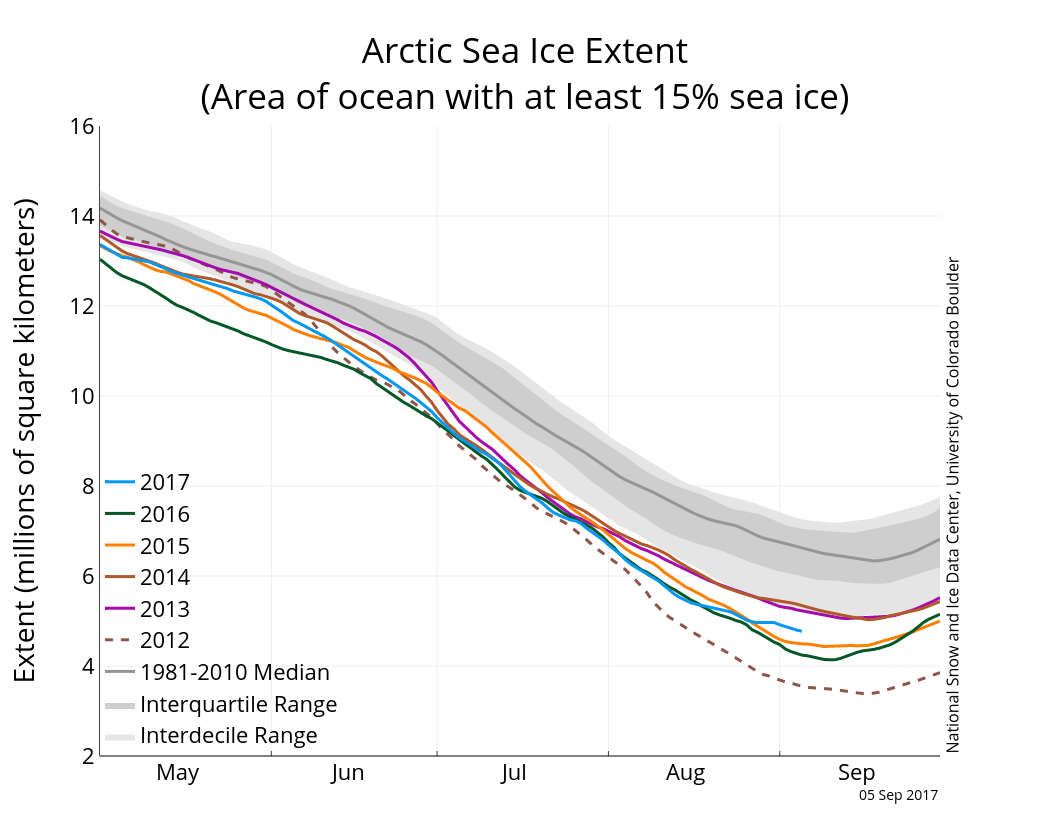
Figure 2a. The graph above shows Arctic sea ice extent as of September 5, 2017, along with daily ice extent data for five previous years. 2017 is shown in blue, 2016 in green, 2015 in orange, 2014 in brown, 2013 in purple, and 2012 in dotted brown. The 1981 to 2010 median is in dark gray. The gray areas around the median line show the interquartile and interdecile ranges of the data. Sea Ice Index data.
Credit: National Snow and Ice Data Center
High-resolution image
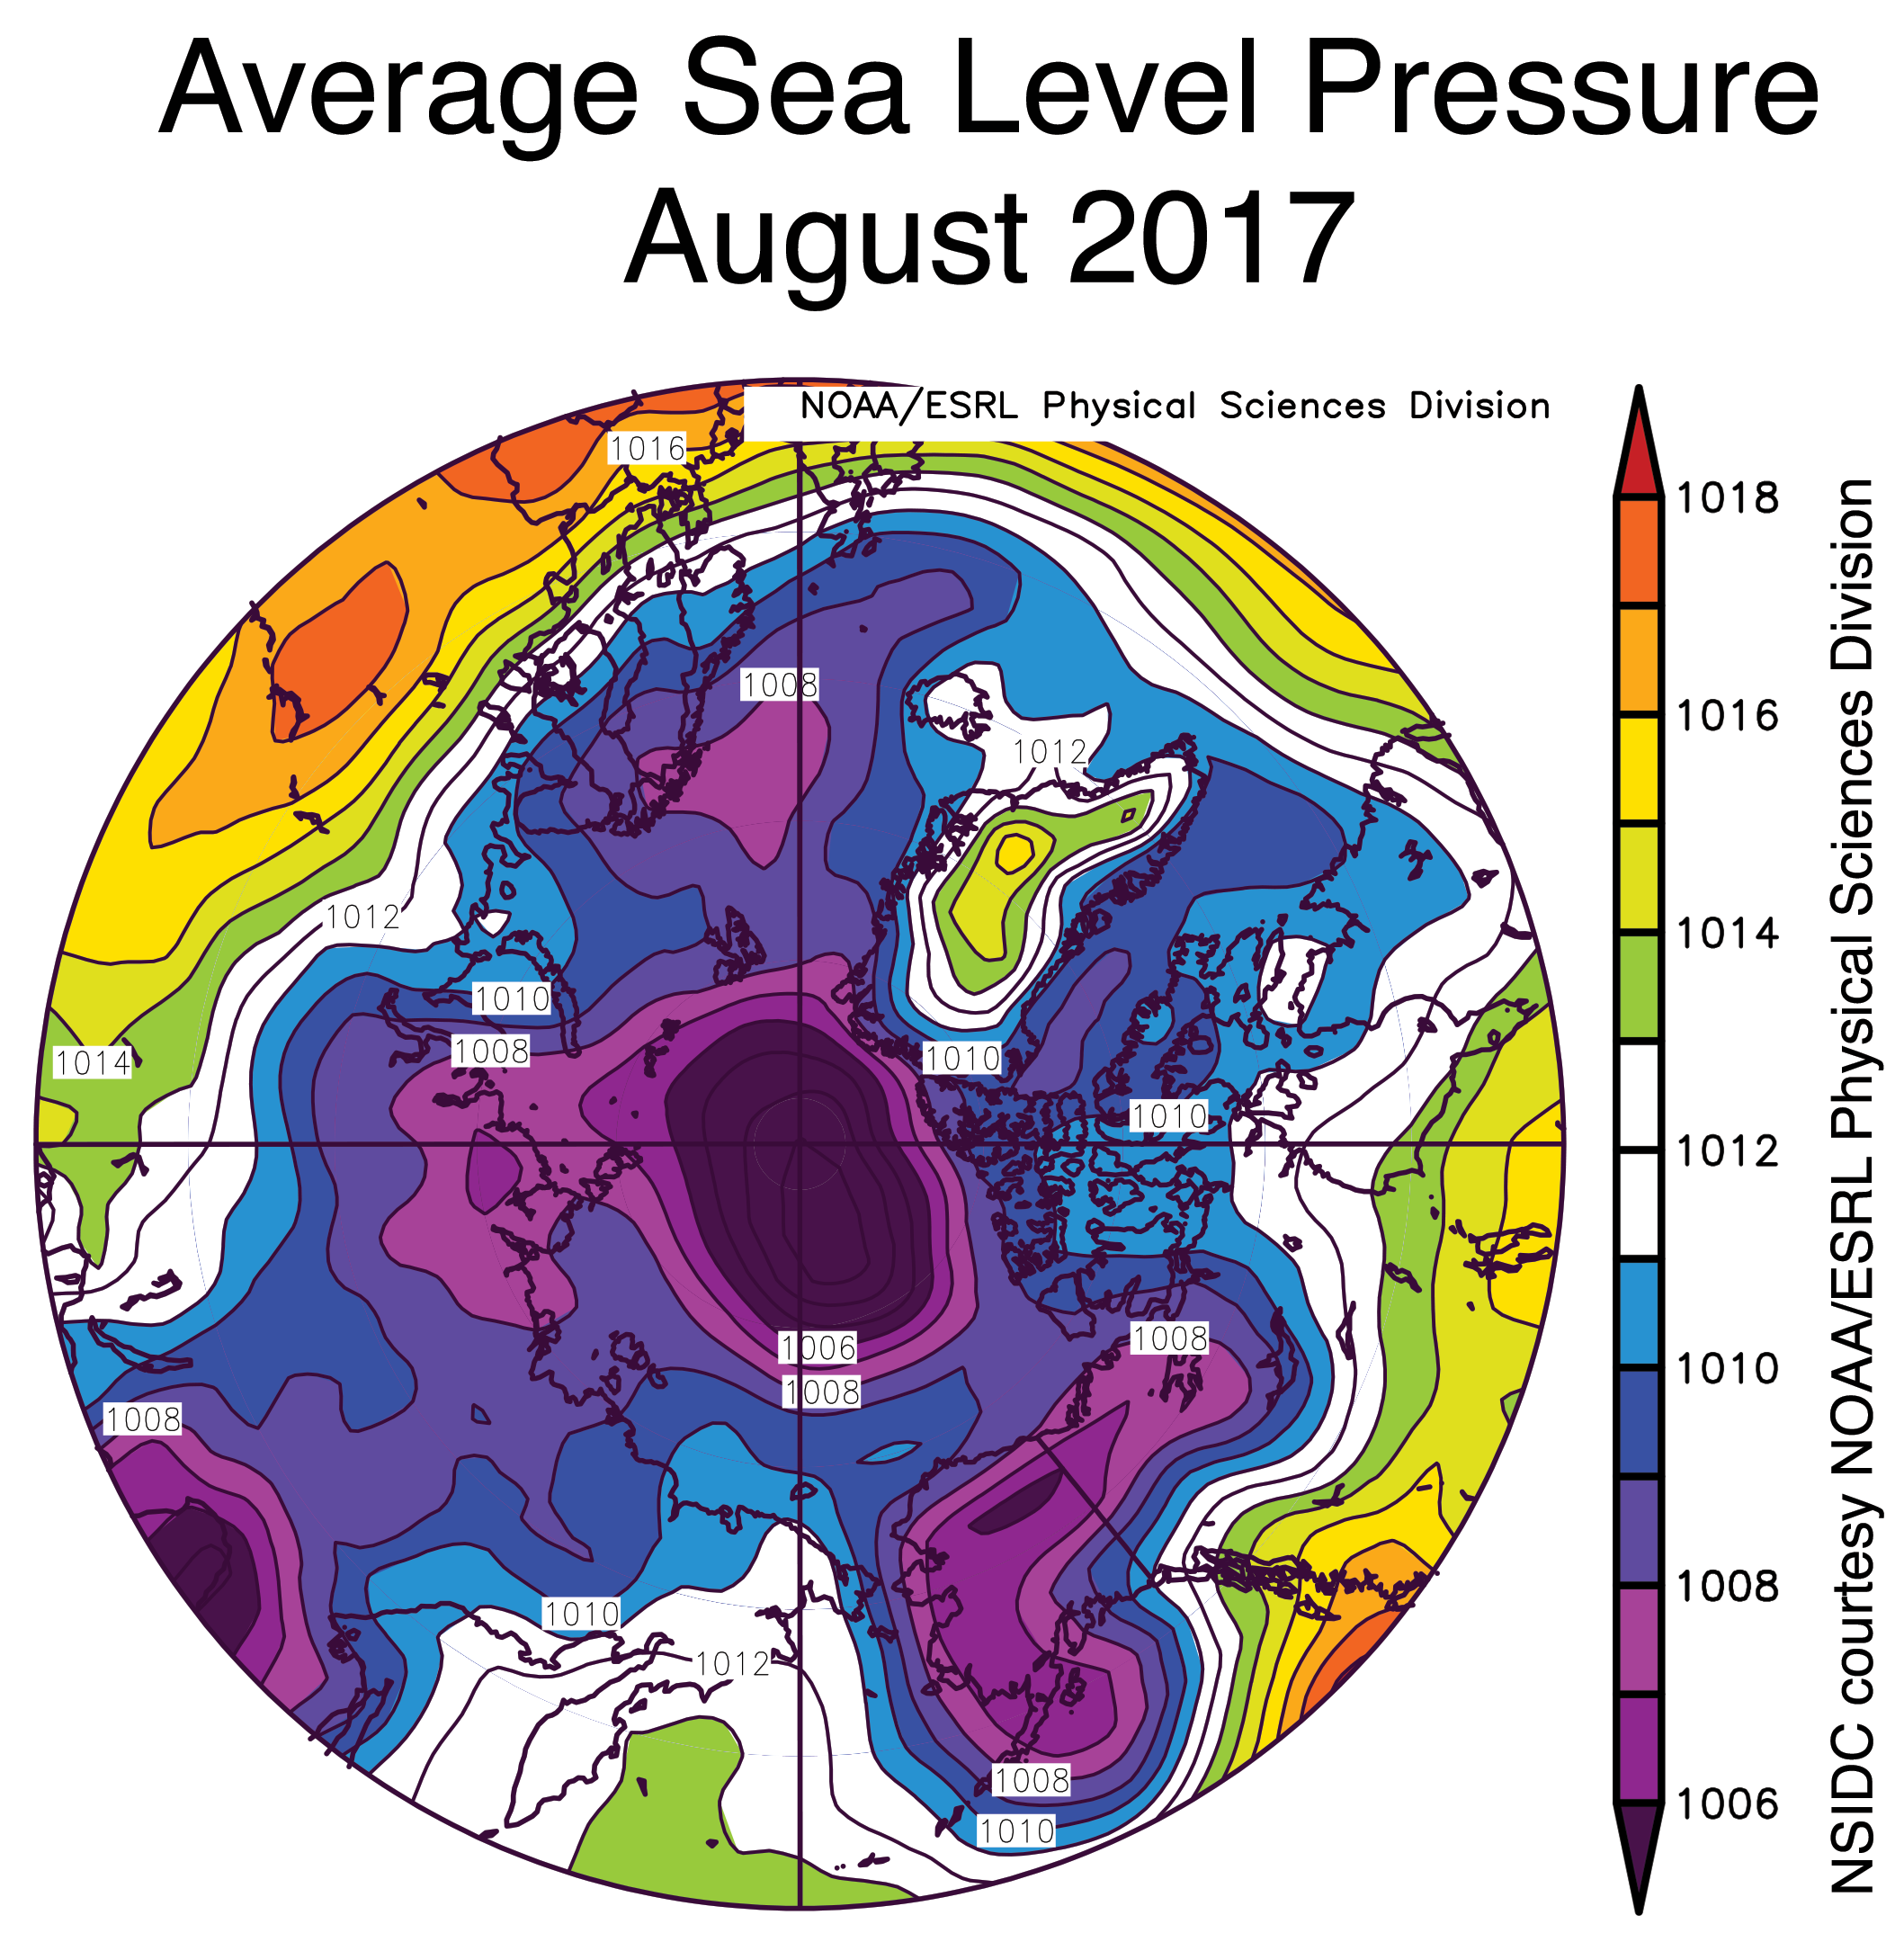
Figure 2b. This image shows average sea level pressure in millibars over the Arctic for the month of August 2017.
Credit: NSIDC courtesy NOAA Earth System Research Laboratory Physical Sciences Division
High-resolution image
Over the month, low atmospheric pressure prevailed over much of the Arctic Ocean, centered over the northern Beaufort Sea (Figure 2b). This helped to push the ice edge in that region northward. Summers dominated by low pressure, as has been the case for 2017, are generally not conducive to ice loss. Low pressure brings generally cool conditions and the cyclonic (counterclockwise) winds help spread the ice over a larger area. However, it appears that strong individual storms, such as the intense summer cyclone of 2012, may break up the ice and mix warm ocean waters into the sea ice, contributing to ice loss.
August 2017 compared to previous years
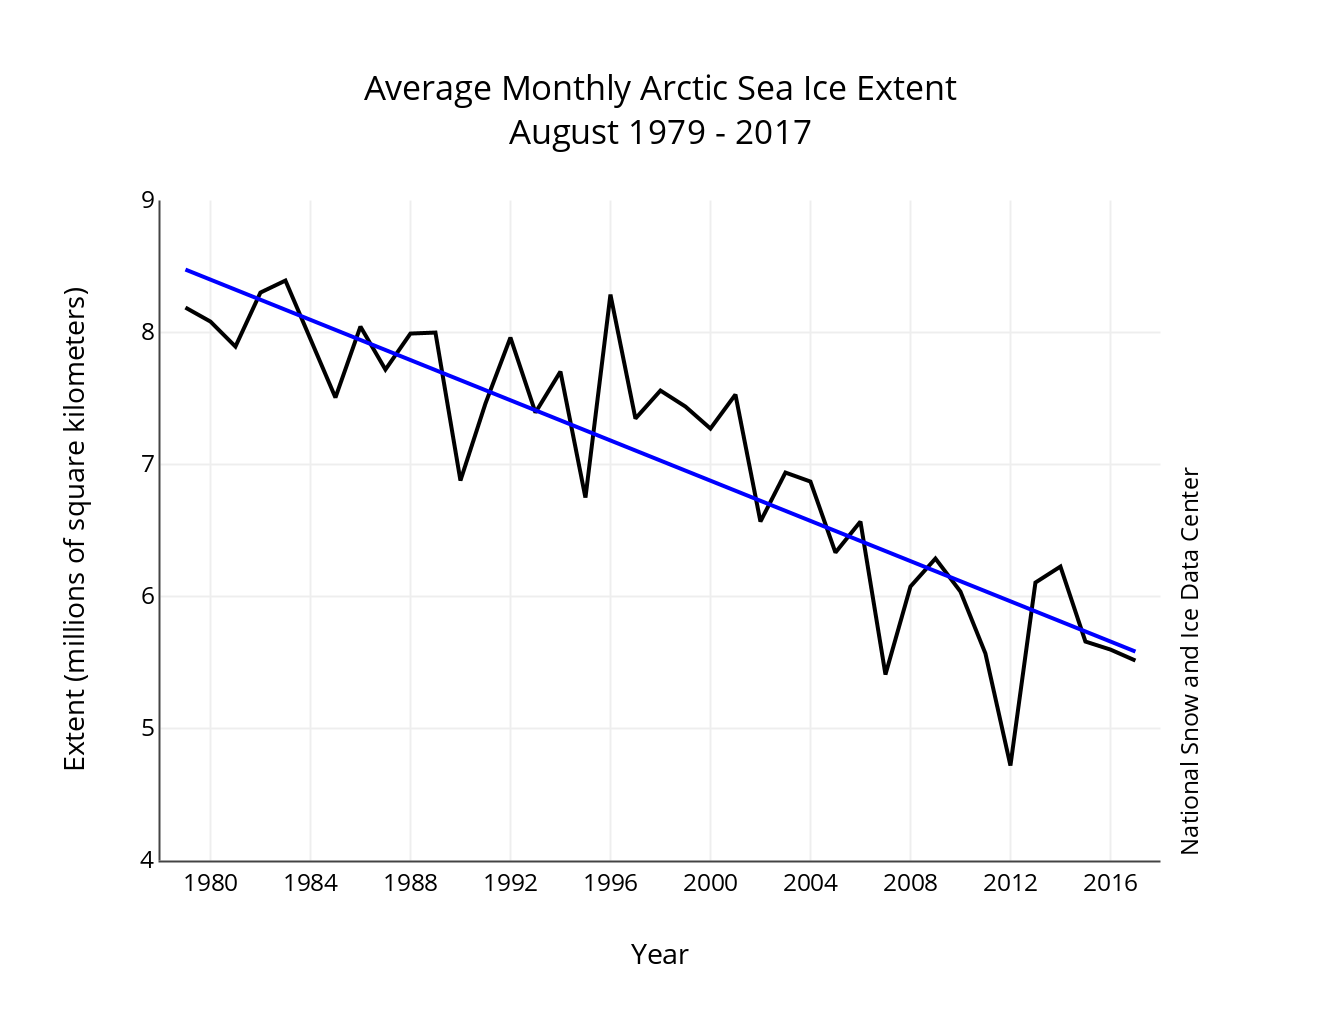
Figure 3. Monthly August ice extent for 1979 to 2017 shows a decline of 10.5 percent per decade.
Credit: National Snow and Ice Data Center
High-resolution image
The linear rate of decline for August 2017 is 76,300 square kilometers (29,000 square miles) per year, or 10.5 percent per decade. The daily ice loss rate was variable over the month, slowing considerably during the middle and end of the month. Overall, the loss rate during August 2017 was slower than recent years, particularly 2012, when extent decreased rapidly during the first half of the month after a the passage of a strong storm.
A report on the Northwest Passage
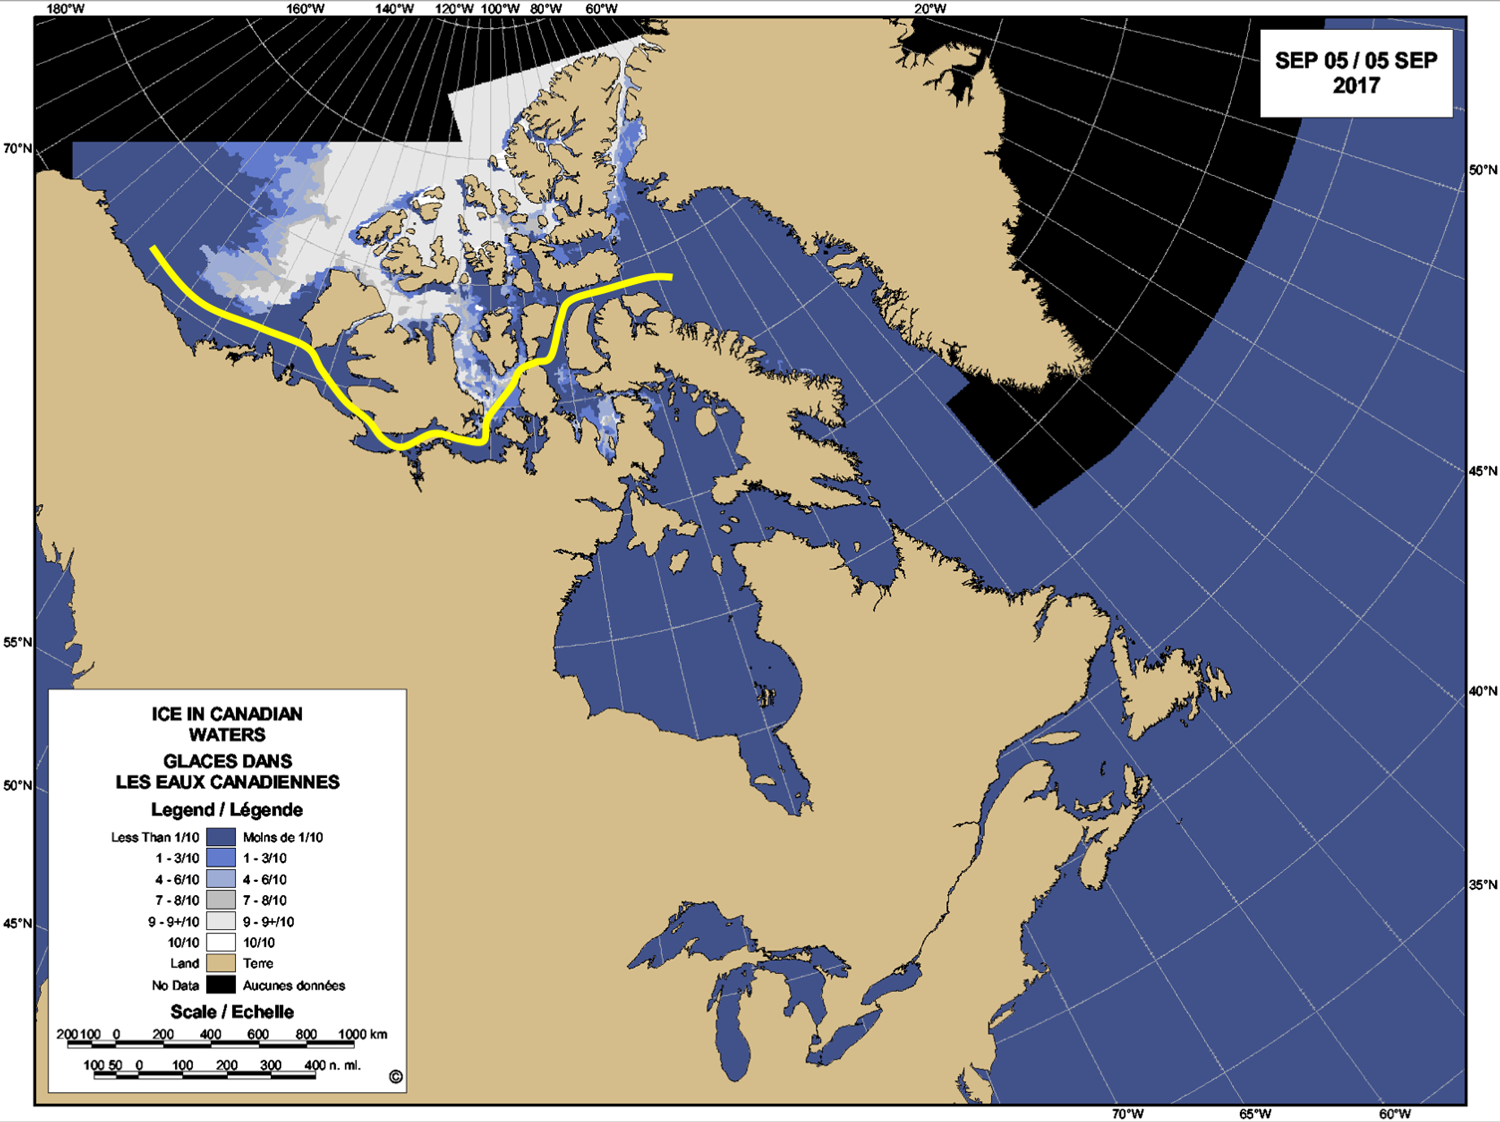
Figure 4a. This shows the route of the Crystal Serenity (yellow line) overlaid on a map of ice cover in the Northwest Passage region for September 5, 2017.
Credit: Canadian Ice Service Daily and Regional Ice Charts
High-resolution image
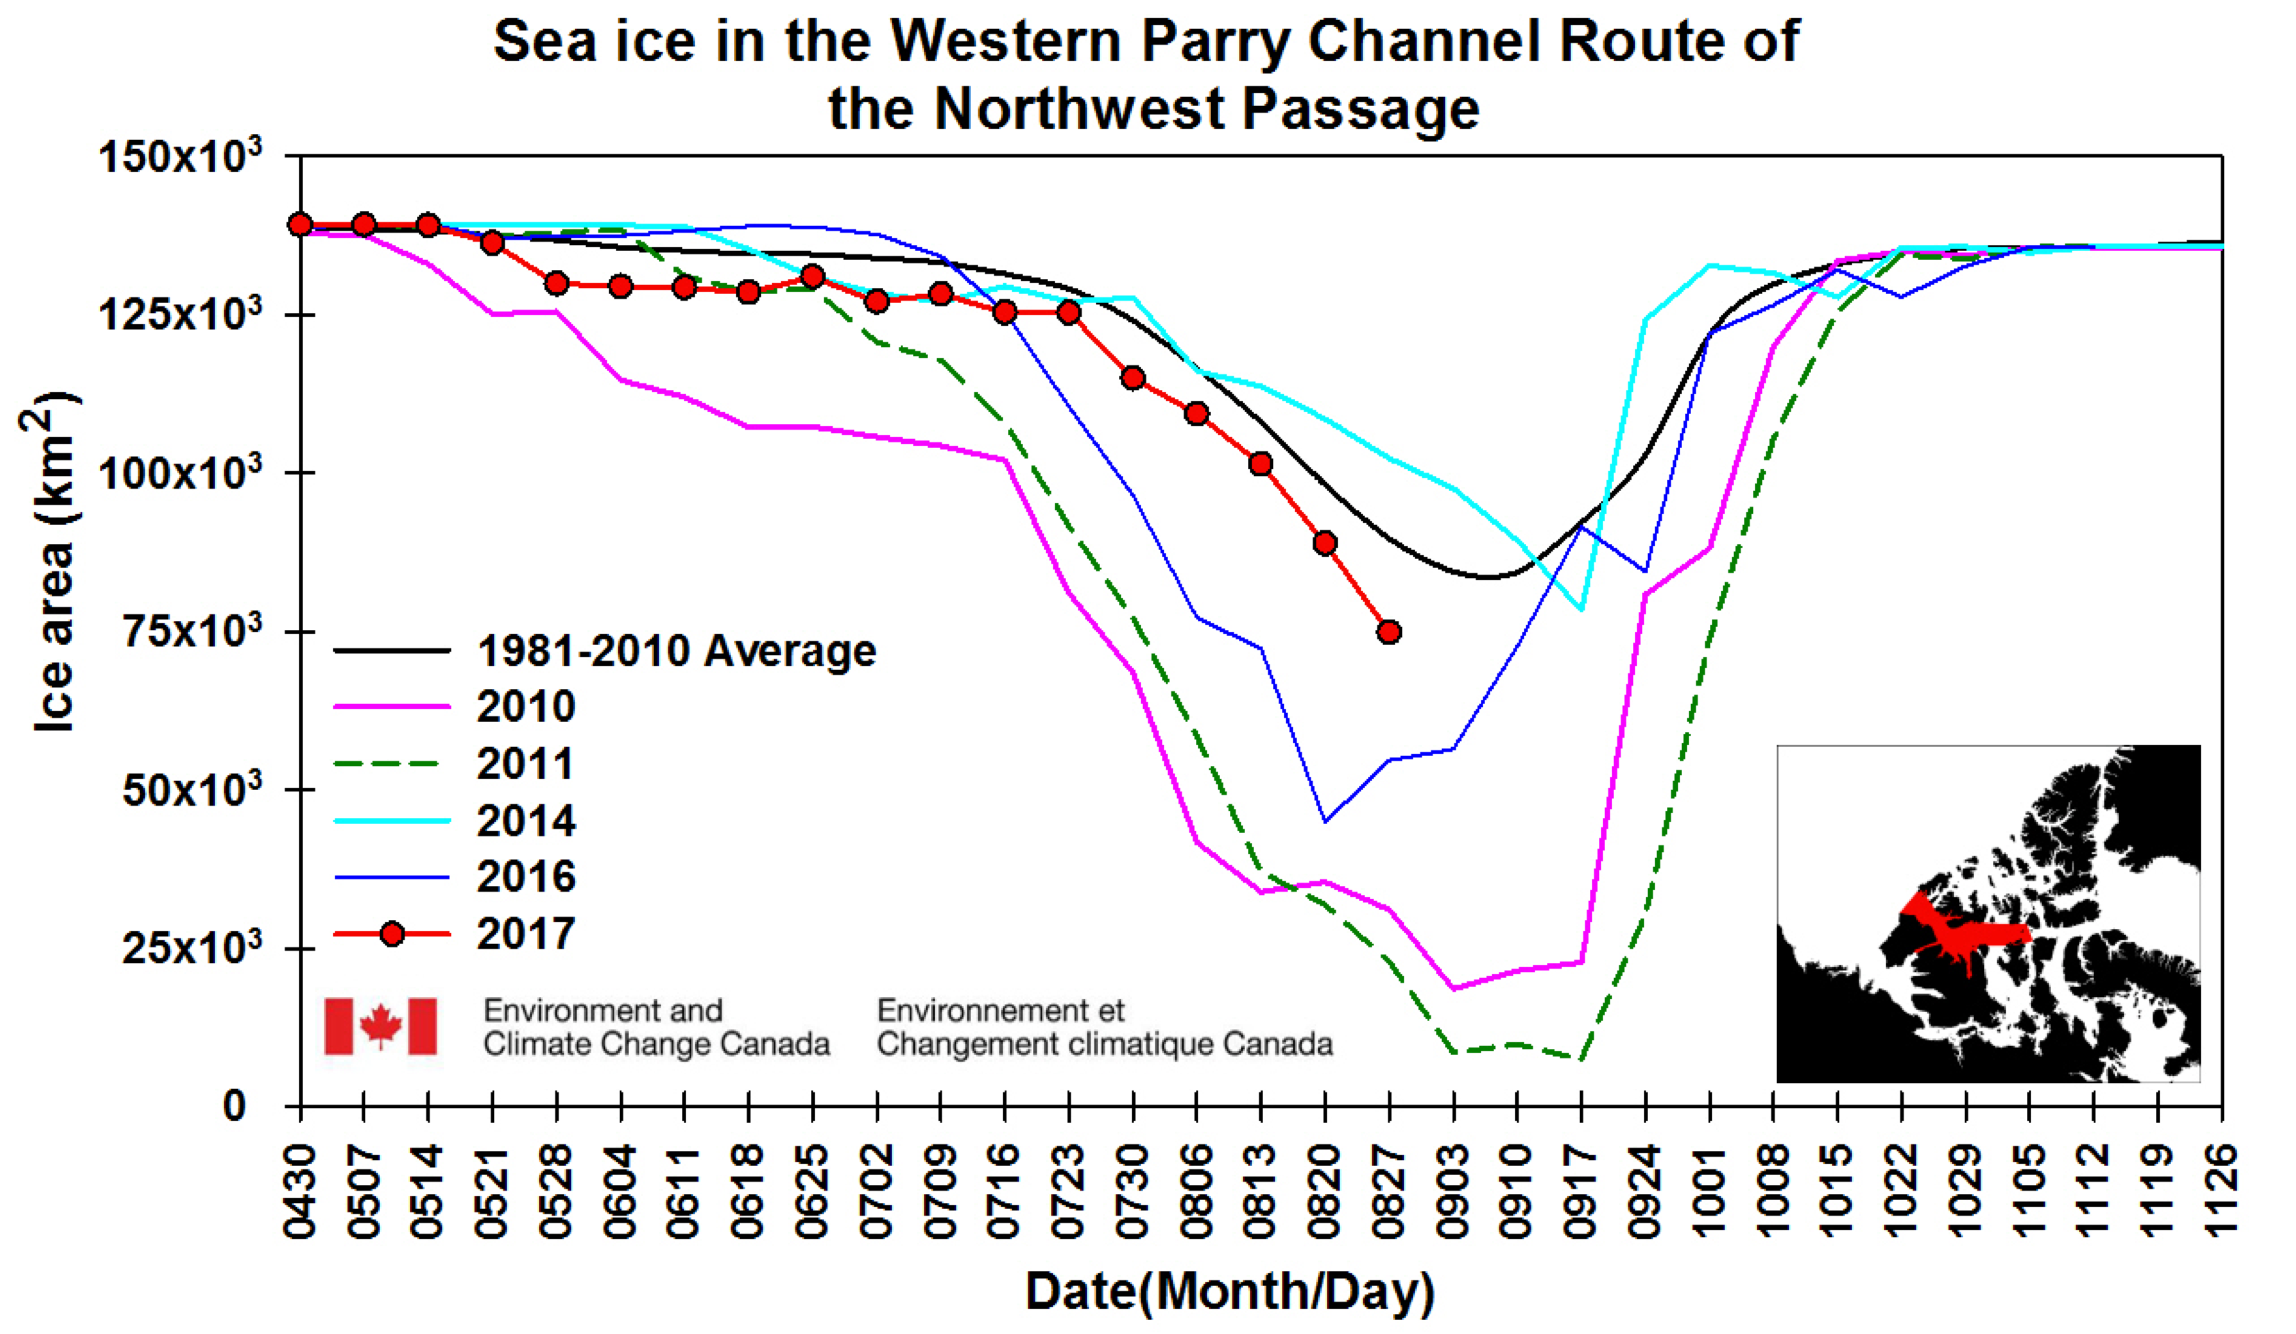
Figure 4b. This chart shows sea ice area in the Parry Channel region of the Canadian Archipelago from April 30 to November 26 for the years 2010 (magenta), 2011 (dashed green), 2014 (blue green), 2016 (purple), and 2017 (red). The black line shows the 1981 to 2010 long-term average.
Credit: Environment and Climate Change Canada
High-resolution image

Figure 4c. This photo shows sea ice conditions along the route of the Crystal Serenity.
Credit: C. Haas, York University
High-resolution image
Of particular interest each year are the ice conditions in the Northwest Passage. Our colleagues, Stephen Howell and Michael Brady of the Climate Research Division at Environment and Climate Change Canada, provided a status update based on sea ice charts produced by the Canadian Ice Service.
As of August 28, the northern route of the Northwest Passage was blocked by high concentration ice at the western (Parry Channel) entrance (Figure 4a), but overall extent in the passage is still tracking below the 1981 to 2010 average (Figure 4b). The record low seasonal extent in the northern route was in 2011. Low ice years in the northern route are typically the result of early breakup associated with above-average sea level pressure over the Beaufort Sea and Canadian Basin; this pattern tends to displace ice away from the western entrance. Conversely, low sea level pressure over the Beaufort Sea, such as seen this summer, packs ice up against the western entrance. It is unlikely the northern route will open in this year. Ice concentrations are much milder in the southern route (Amundsen’s Passage) but some ice still blocks the eastern part of that passage. This is primarily first year ice that may melt out in the coming weeks. During low ice summers, thick multi-year ice originating from the Arctic Ocean is typically advected into the channels of both the northern and southern routes, representing a significant hazard to transiting ships.
The Crystal Serenity luxury cruise ship, accompanied by an icebreaker, is attempting a repeat of last year’s cruise through the passage. Professor Christian Haas of York University in Toronto, who is providing sea ice expertise on board the ship, sent us a first-hand account of conditions:
“On August 29 and 30, we encountered some high concentration ice, up to 90 percent, just before entering Bellot Strait. The ice was mostly first-year ice, with about 30 percent multi-year ice having thicknesses greater than 2 meters (6.5 feet). Due to the relatively severe ice conditions, we were supported by the Canadian Coast Guard icebreaker Des Groseilliers, which helped clear some ice on our route into Franklin Strait. Overall, ice conditions have been much more severe than during the first transit of the Northwest Passage of the Crystal Serenity in 2016, when no ice was encountered at all.”
Figure 4c shows conditions along the route. The ship’s latest position is available at the cruise’s blog.
Also of note, the Finnish icebreaker MSV Nordica, set a new record for the earliest transit through the passage on July 29, traveling 10,000 kilometers (6,000 miles) in 24 days.
On the other side of the Arctic, the Northeast Passage (or Northern Sea Route) along the coast of Siberia appears largely open as shown by NSIDC data, though operational analysis by the U.S. National Ice Center shows some remaining ice along the coast of the Taymyr Peninsula.
A radar view of the Arctic
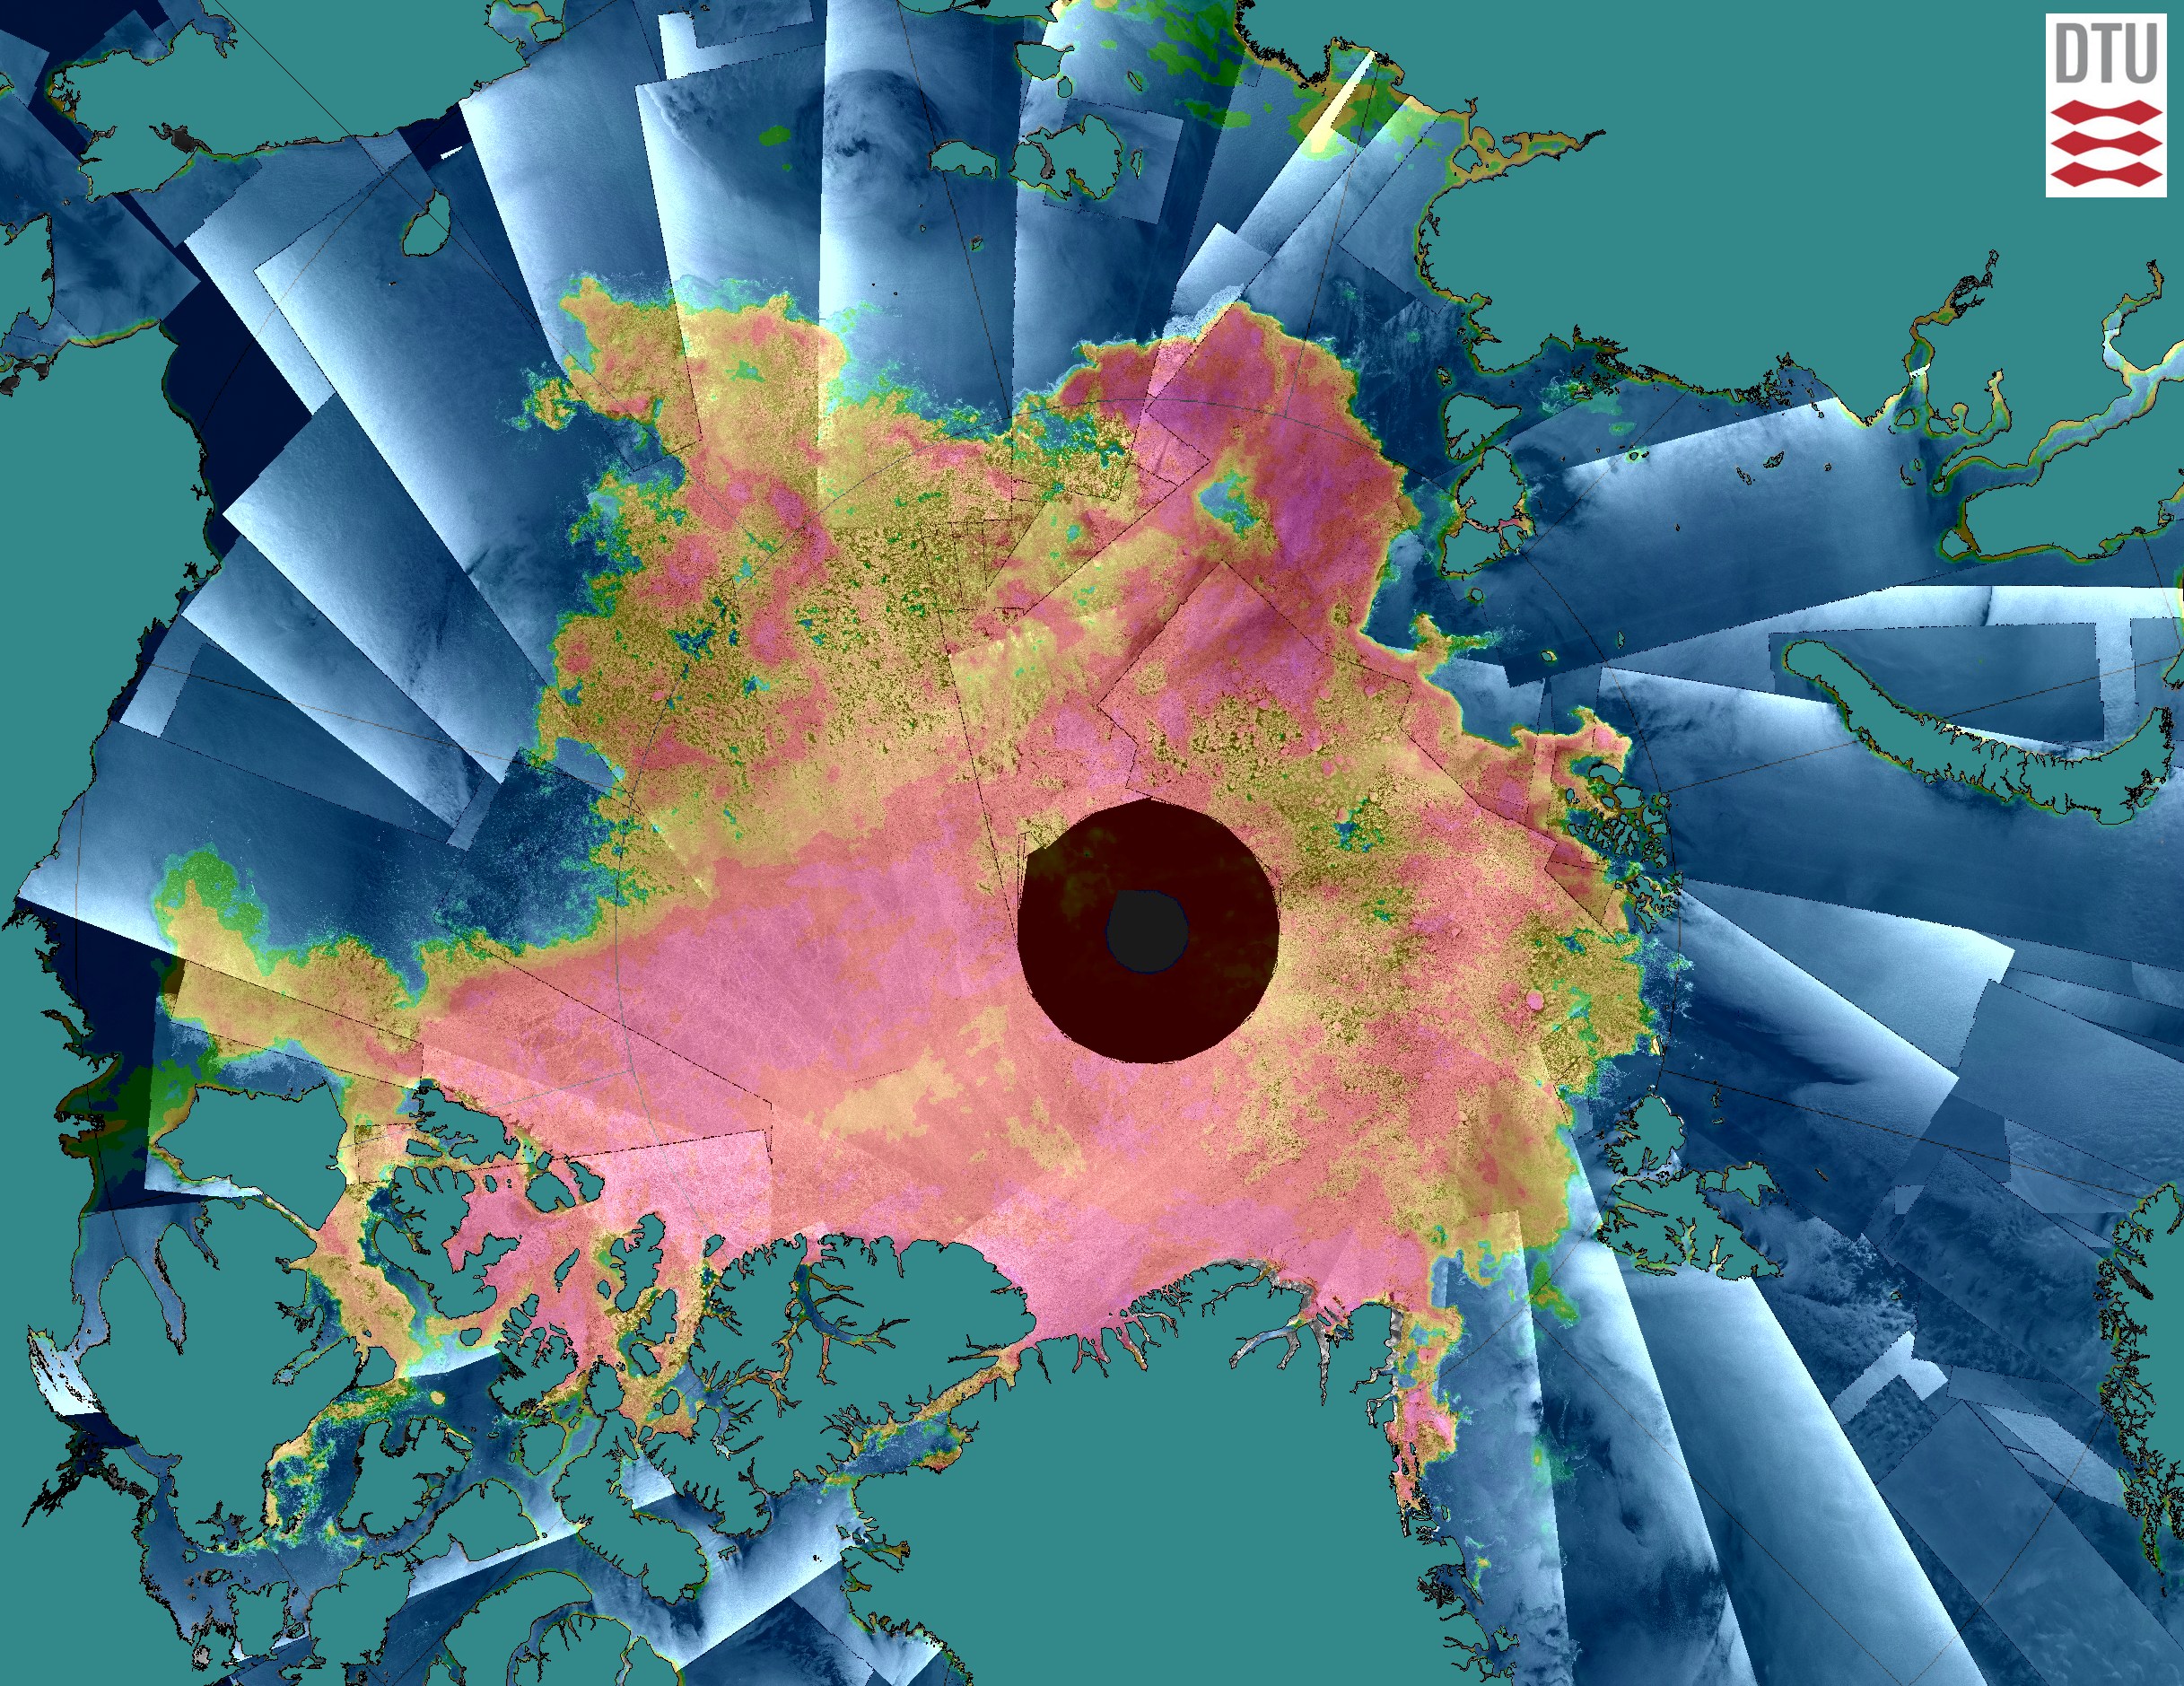
Figure 5. This figure shows a composite image from Sentinel-1 SAR imagery for August 29, 2017 overlaid with passive microwave sea ice concentration from the Japan Aerospace Exploration Agency (JAXA) Advanced Microwave Scanning Radiometer 2 (AMSR2) sensor. Red/pink shades indicate regions of high (more than 90 percent) concentration, while green/brown shades indicate lower (~30-70 percent) concentration. Open water is in black to blue/gray shades. Open water is evident between floes of ice in the low concentration regions.
Credit: Image from Danish Technical University, courtesy Leif Pedersen and Roberto Saldo
High-resolution image
The passive microwave satellite imagery that NSIDC uses is ideal for showing long-term changes in sea ice because it provides a continuous record extending back to 1979. Its drawback is low spatial resolution. Satellite radar images, though more limited in spatial and temporal coverage, provide a more detailed picture of the ice cover. A daily composite of images from the European Space Agency’s Sentinel-1 satellite, with a synthetic aperture radar (SAR) instrument, shows substantial open water well within the ice pack, north of 80° N latitude.

