On September 11, Arctic sea ice reached its likely minimum extent for 2015. The minimum ice extent was the fourth lowest in the satellite record, and reinforces the long-term downward trend in Arctic ice extent. Sea ice extent will now begin its seasonal increase through autumn and winter. In the Antarctic, sea ice extent is average, a substantial contrast with recent years when Antarctic winter extents reached record high levels.
Please note that this is a preliminary announcement. Changing winds or late-season melt could still reduce the Arctic ice extent, as happened in 2005 and 2010. NSIDC scientists will release a full analysis of the Arctic melt season, and discuss the Antarctic winter sea ice growth, in early October.
Overview of conditions
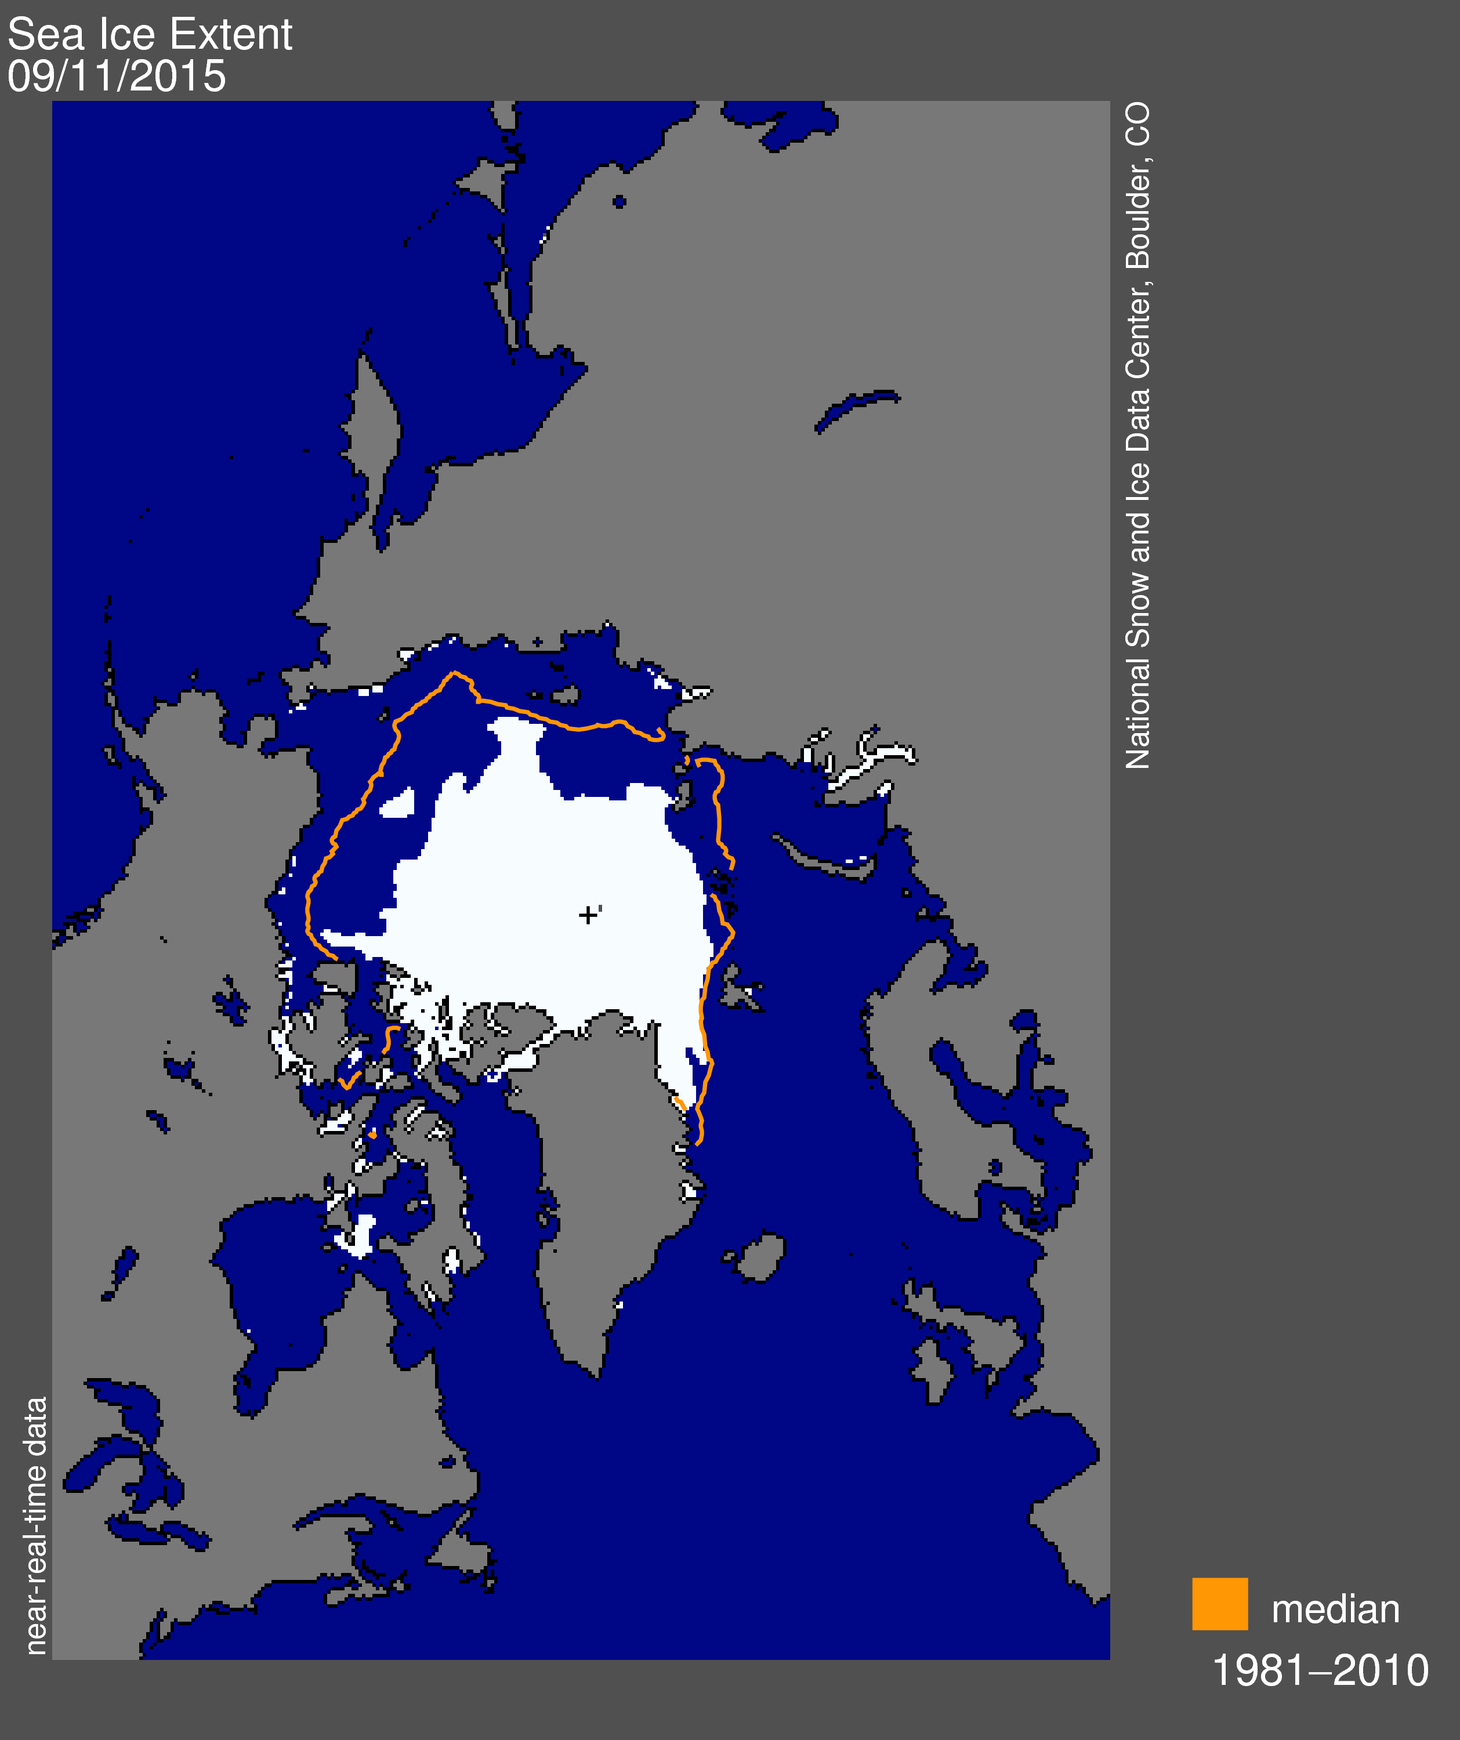
Figure 1. Arctic sea ice extent for September 11, 2015, was 4.41 million square kilometers (1.70 million square miles). The orange line shows the 1981 to 2010 average extent for the day. The black cross indicates the geographic North Pole. Sea Ice Index data. About the data
Credit: National Snow and Ice Data Center
High-resolution image
On September 11, 2015, sea ice extent dropped to 4.41 million square kilometers (1.70 million square miles), the fourth lowest minimum in the satellite record. This appears to be the lowest extent of the year. In response to the setting sun and falling temperatures, ice extent will now climb through autumn and winter. However, a shift in wind patterns or a period of late season melt could still push the ice extent lower.
The minimum extent was reached four days earlier than the 1981 to 2010 average minimum date of September 15. The extent ranked behind 2012 (lowest), 2007 (second lowest), and 2011 (third lowest). Moreover, the nine lowest extents in the satellite era have all occurred in the last nine years.
Both the Northern Sea Route, along the coast of Russia, and Roald Amundsen’s route through the Northwest Passage are open. How long they remain open depends on weather patterns and the amount of heat still present in the ocean mixed layer (about the top 50 feet of the ocean). The deeper and wider Northwest Passage route through Parry Channel, which consists of M’Clure Strait, Barrow Strait, and Lancaster Sound, still has some ice in it.
Conditions in context

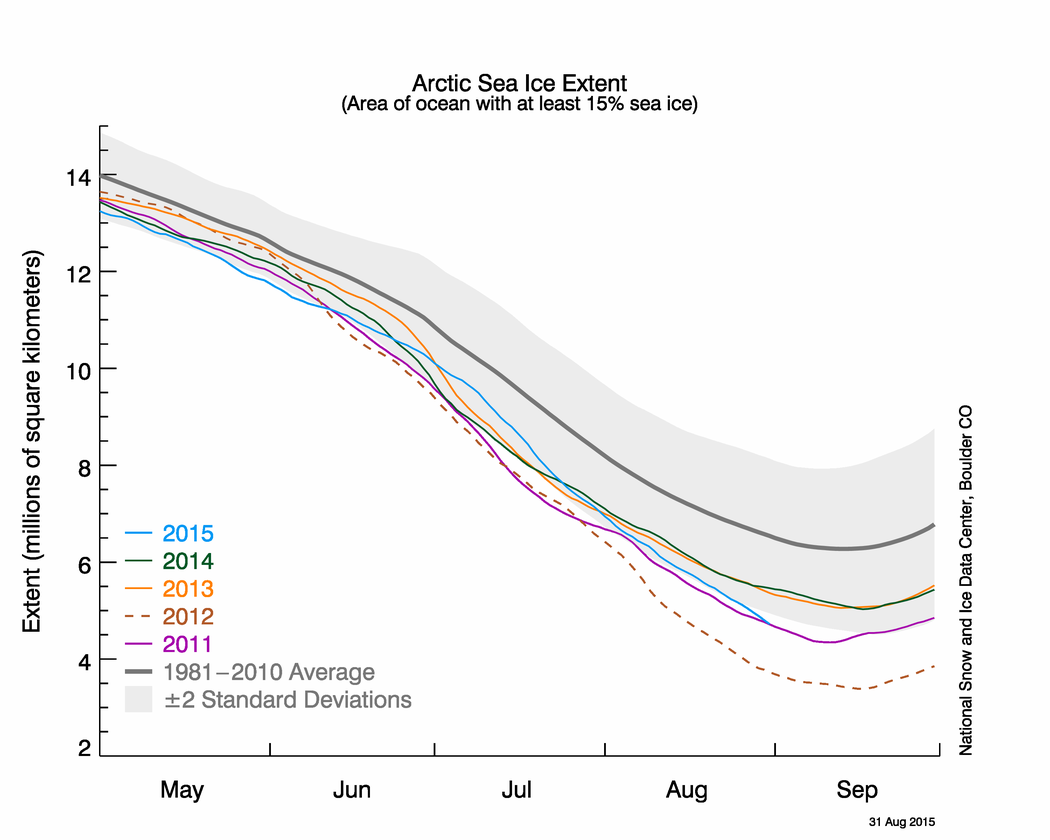
Figure 2a. The graph above shows Arctic sea ice extent as of September 14, 2015, along with daily ice extent data for last year and the three lowest ice extent years (2012, 2007, and 2011). 2015 is shown in blue, 2014 in green, 2012 in orange, 2011 in brown, and 2007 in purple. The 1981 to 2010 average is in dark gray. The gray area around the average line shows the two standard deviation range of the data. Sea Ice Index data. About the data
Credit: National Snow and Ice Data Center
High-resolution image
This year’s minimum was 1.02 million square kilometers (394,000 square miles) above the record minimum extent in the satellite era, which occurred on September 17, 2012, and 1.81 million square kilometers (699,000 square miles) below the 1981 to 2010 average minimum.
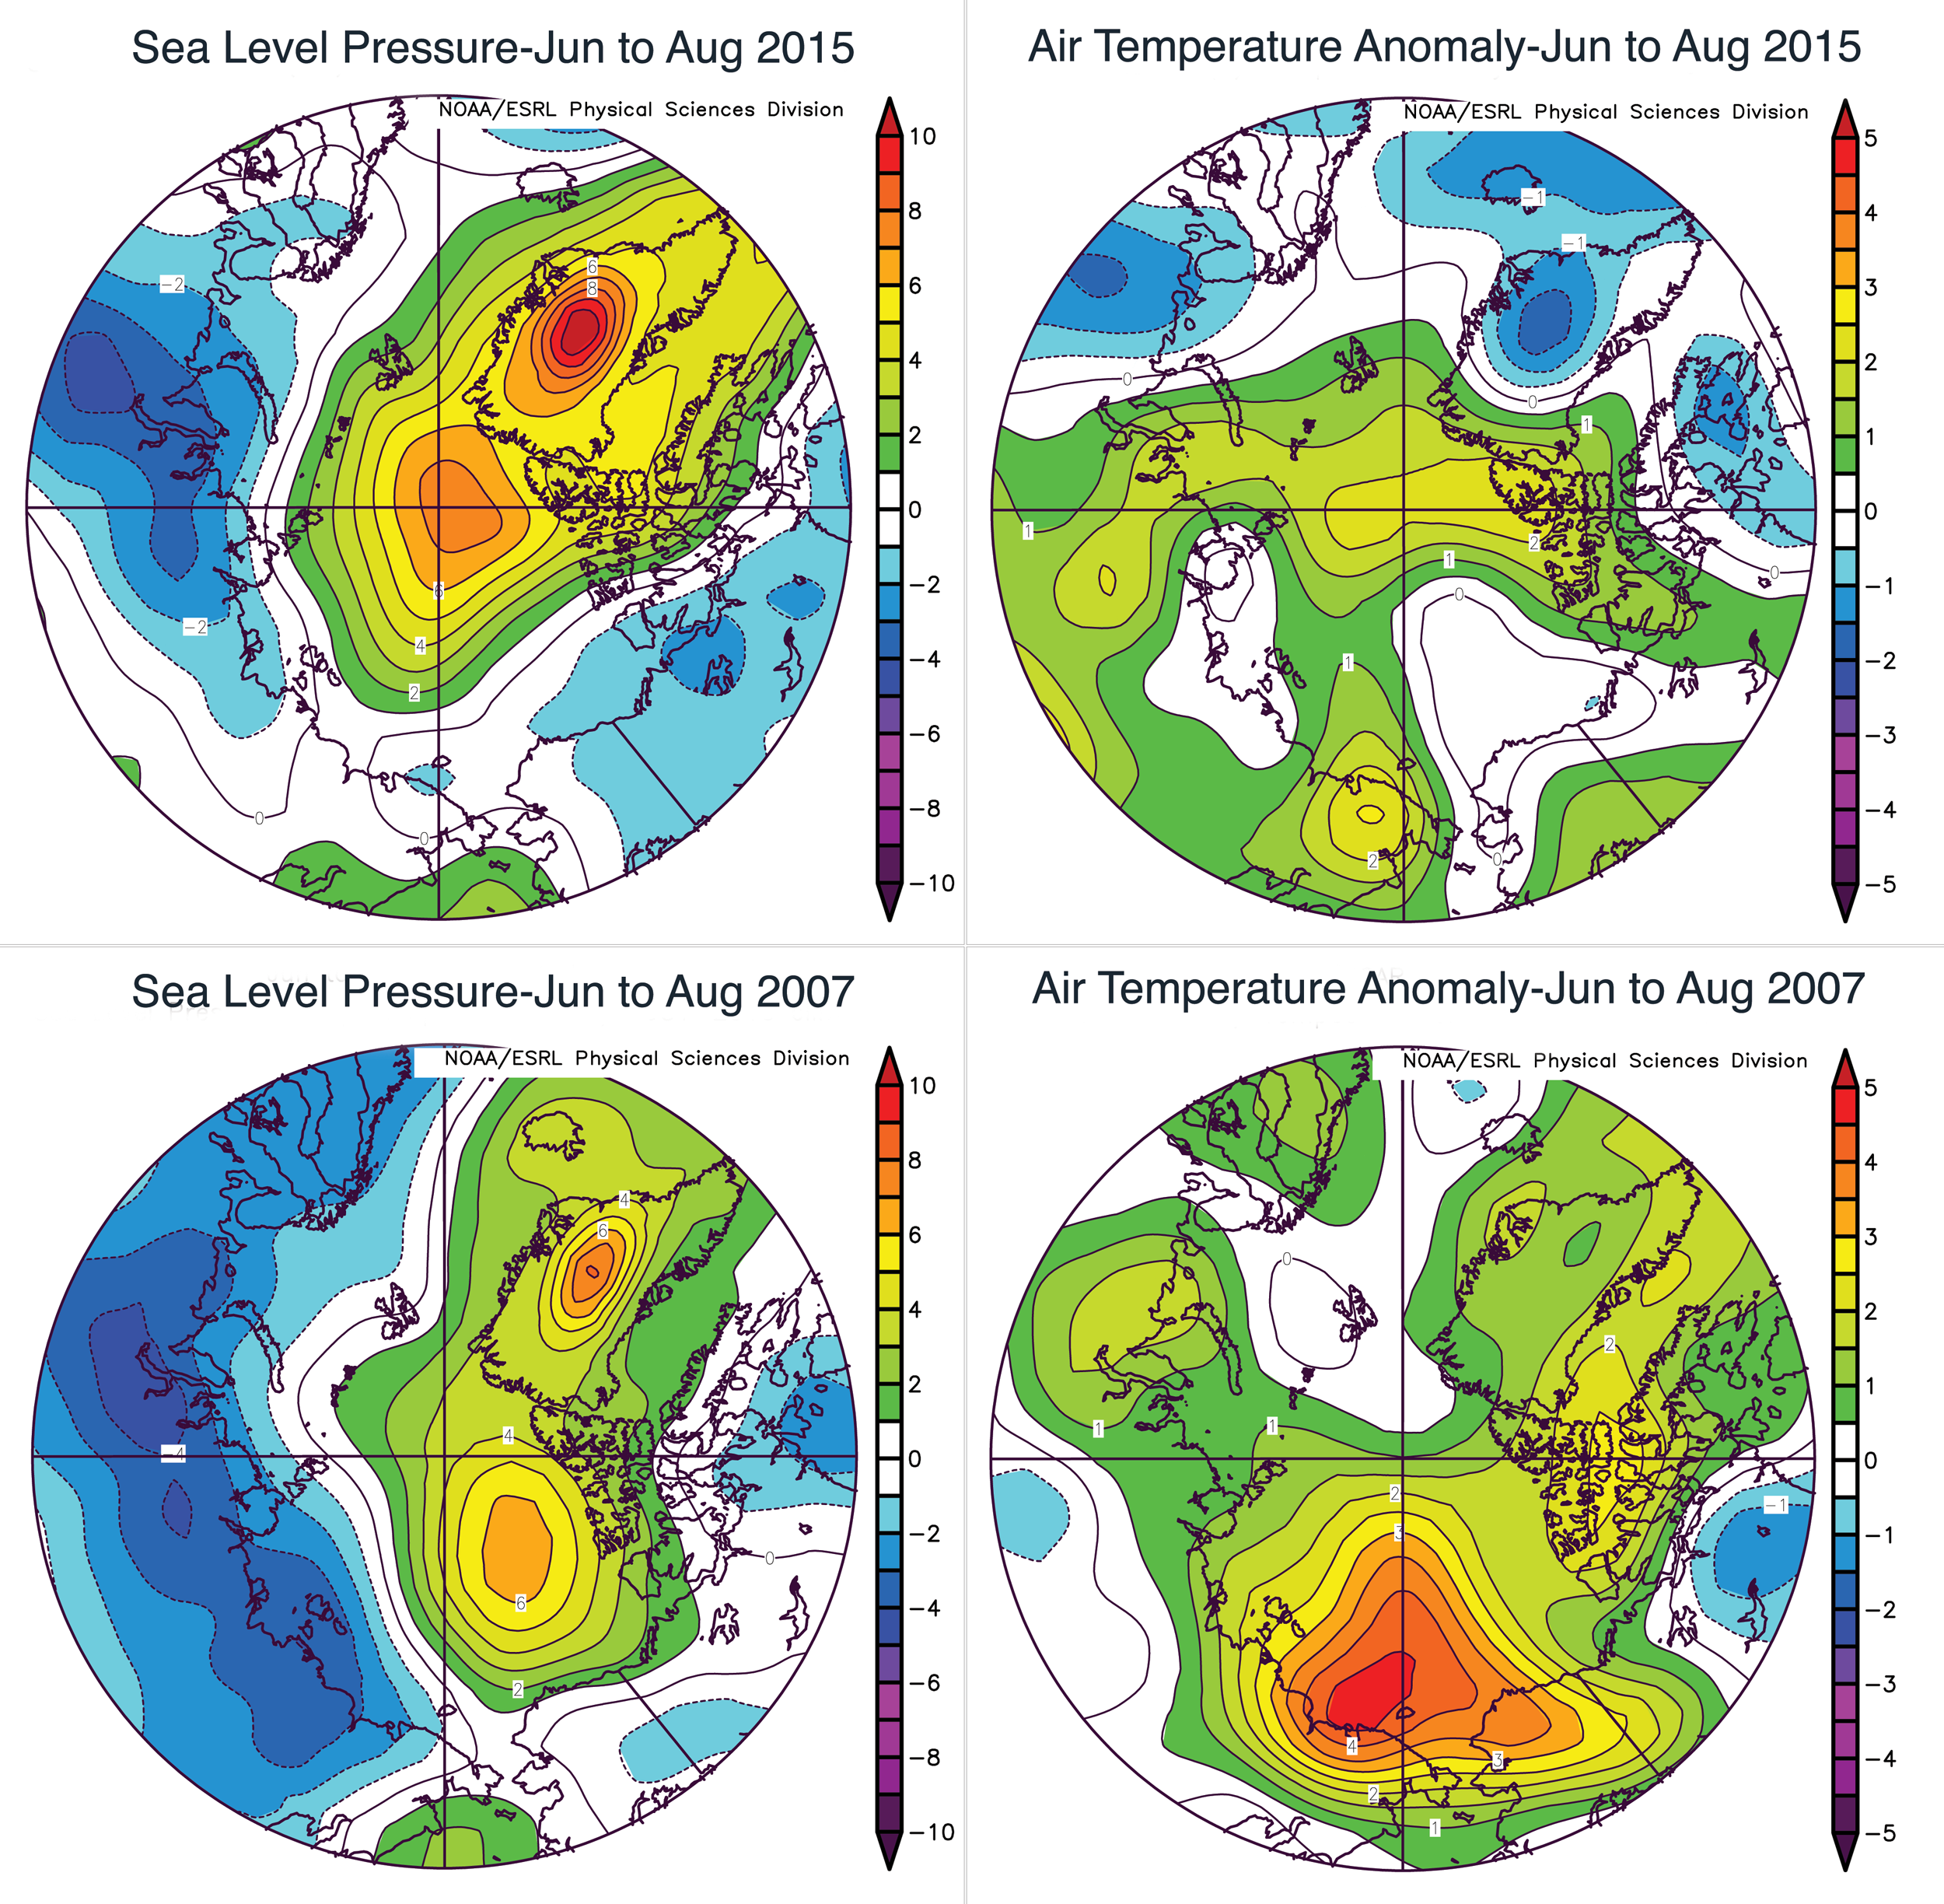
Figure 2b. This figure shows patterns of sea level pressure and air temperature at the 925 hPa level for the summers (June through August) of 2015 and for 2007, expressed as differences from the 1981 to 2010 average. The patterns for 2015 contributed to low September extent, but were not as favorable for producing low extent as the patterns seen in 2007.
Credit: NOAA/ESRL Physical Sciences Division
High-resolution image
Research has shown that especially low September sea extent tends to occur in years when the summer atmospheric circulation over the central Arctic Ocean is dominated by high atmospheric pressure, or anticyclonic conditions. This is because anticyclonic conditions tend to bring relatively sunny and warm conditions, and a clockwise wind pattern promotes ice convergence, making for a more compact, and thus smaller ice cover. The best example of this pattern occurred during the summer of 2007, which had the second lowest September extent in the satellite record. Conversely, Septembers with high extent tend to occur when the atmospheric circulation over the central Arctic Ocean is more cyclonic (counterclockwise), meaning unusually low pressure at the surface. This pattern brings more clouds, lower temperatures, and winds that spread the ice over a larger area.
Viewed in this framework, the pattern of atmospheric circulation for summer 2015 as a whole (June through August) favored a low September extent. Sea level pressures were higher than average over the central Arctic Ocean, as well as over Greenland and the surrounding region. Pressures were below average over north-central Eurasia. This was associated with air temperatures at the 925 hPa level (about 3,000 feet above the surface) that were above average over much of the Arctic Ocean, especially along the coast of eastern Siberia, in the Laptev Sea, and the Canadian Arctic Archipelago extending to the pole. However, it was not nearly as favorable as the 2007 pattern, when the area of unusually high pressure was located further south and east (over the northern Beaufort Sea), and unusually low pressure extended along much of the coast of northern Eurasia. This led to a pattern of warm winds from the south over the East Siberian and Chukchi Seas, promoting strong melt and transport of ice away from the coast. For both 2015 and 2007, the summer pressure patterns led to winds directed down the Fram Strait, helping to transport ice out of the Arctic Ocean into the East Greenland Sea.
Varying distribution of ice in 2015 versus 2012

Figure 3. This image compares differences in ice-covered areas between September 11, 2015 and September 17, 2012, the record low minimum extent. Light blue shading indicates the region where ice occurred in both 2015 and 2012, while white and medium blue areas show ice cover unique to 2012 and to 2015, respectively. Sea Ice Index data. About the data
Credit: National Snow and Ice Data Center
High-resolution image
While minimum extent was higher this year compared to 2012, there are many similarities in the spatial pattern of the ice cover. Both years had considerable ice loss in the Beaufort, Chukchi, and East Siberian seas, though this year the ice extent did not retreat as far north as in 2012. Both also show a tongue of ice extending further southward on the Siberian side of the Arctic. In 2012, the tongue extended toward the Laptev Sea. This year, the tongue is farther east, in the western part of the East Siberian Sea, and is related to thicker, older ice that did not melt completely. North of Svalbard and in the Kara Sea, sea ice extent was slightly higher this year than in 2012.
Previous minimum Arctic sea ice extents
| YEAR | MINIMUM ICE EXTENT | DATE | |
|---|---|---|---|
| IN MILLIONS OF SQUARE KILOMETERS | IN MILLIONS OF SQUARE MILES | ||
| 2006 | 5.77 | 2.28 | September 17 |
| 2007 | 4.15 | 1.60 | September 18 |
| 2008 | 4.59 | 1.77 | September 20 |
| 2009 | 5.12 | 1.98 | September 13 |
| 2010 | 4.61 | 1.78 | September 21 |
| 2011 | 4.34 | 1.67 | September 11 |
| 2012 | 3.39 | 1.31 | September 17 |
| 2013 | 5.05 | 1.95 | September 13 |
| 2014 | 5.03 | 1.94 | September 17 |
| 2015 | 4.41 | 1.70 | September 11 |
| 1979 to 2000 average | 6.70 | 2.59 | September 13 |
| 1981 to 2010 average | 6.22 | 2.40 | September 15 |
Ten lowest minimum Arctic sea ice extents (1981 to 2010 average)
| RANK | YEAR | MINIMUM ICE EXTENT | DATE | |
|---|---|---|---|---|
| IN MILLIONS OF SQUARE KILOMETERS | IN MILLIONS OF SQUARE MILES | |||
| 1 | 2012 | 3.39 | 1.31 | September 17 |
| 2 | 2007 | 4.15 | 1.60 | September 18 |
| 3 | 2011 | 4.34 | 1.67 | September 11 |
| 4 | 2015 | 4.41 | 1.70 | September 11 |
| 5 | 2008 | 4.59 | 1.77 | September 20 |
| 6 | 2010 | 4.61 | 1.78 | September 21 |
| 7 | 2014 | 5.03 | 1.94 | September 17 |
| 8 | 2013 | 5.05 | 1.95 | September 13 |
| 9 | 2009 | 5.12 | 1.98 | September 13 |
| 10 | 2005 | 5.32 | 2.05 | September 22 |
Note that the dates and extents of the minima have been re-calculated from what we posted in previous years. In March 2015, NSIDC made two revisions to Arctic Sea Ice Index extent values used in our analyses, to improve scientific accuracy. These changes do not significantly affect sea ice trends and year-to-year comparisons, but in some instances users may notice very small changes in values from the previous version of the data. First, calculations of ice extent near the North Pole were improved whenever a newer satellite orbited closer to the pole than older satellites in the series, by using a sensor-specific pole hole for the extent calculations. Second, the accuracy of ice detection near the ice edge was slightly improved by adopting an improved residual weather effect filter. Details on the changes are discussed in the Sea Ice Index documentation.
U.S. icebreaker reaches the North Pole
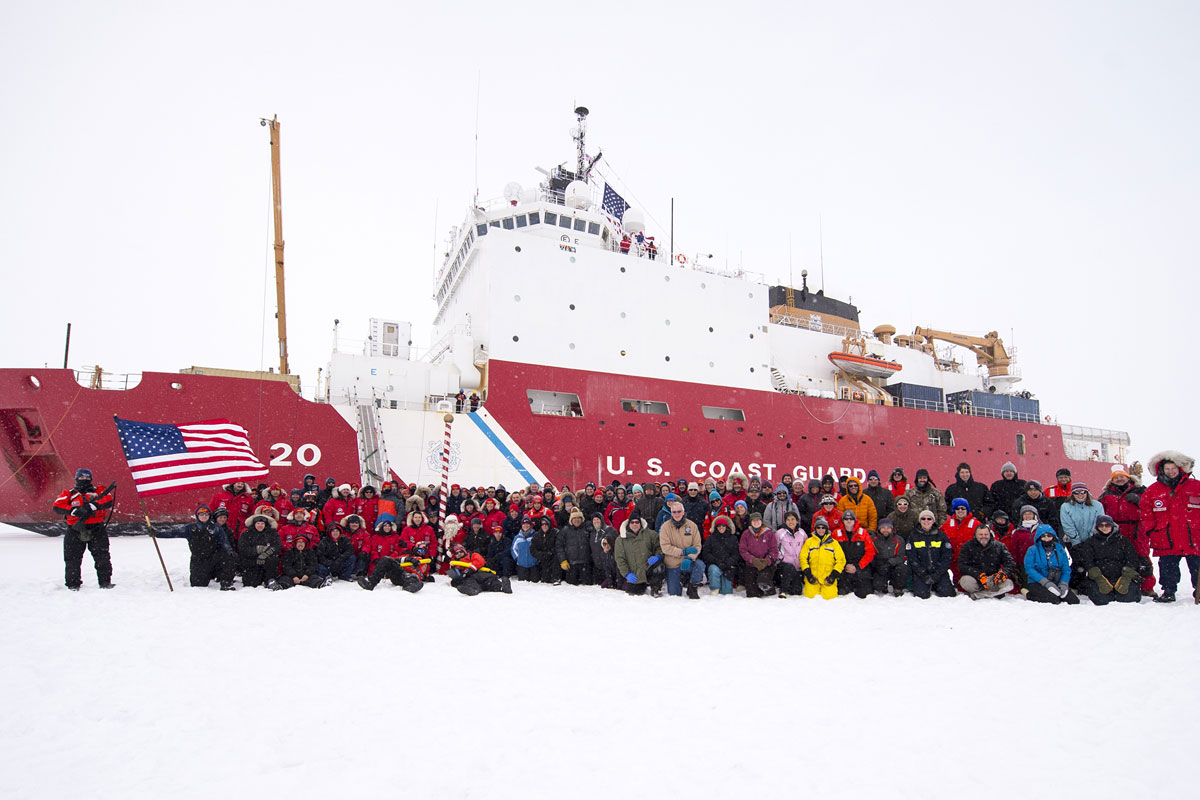
Figure 4. Scientists and the crew of U.S. Coast Guard Icebreaker Healy have their portrait taken at the North Pole on September 7, 2015. The Healy reached the pole on September 5.
Credit: U.S. Coast Guard photo by Petty Officer 2nd Class Cory J. Mendenhall
High-resolution image
After four weeks at sea, the Coast Guard Icebreaker Healy reached the North Pole on September 5. The ship left Dutch Harbor on August 9 with about 145 people on board, including about fifty scientists. The Healy is a medium-duty icebreaker and in the years past would not have been suitable to navigate through thick ice floes to reach the pole. This is the first time that a U.S. ship has made a solo traverse of the North Pole. As clear evidence that the melt season was coming to a close, air temperatures were 21 degrees Fahrenheit (-6 degrees Celsius). The U.S. icebreaker’s capability is far behind that of Russia and other Arctic nations, and plans are ongoing for the U.S. to build a new polar-class icebreaking vessel.
Impact of sea ice convergence in 2013
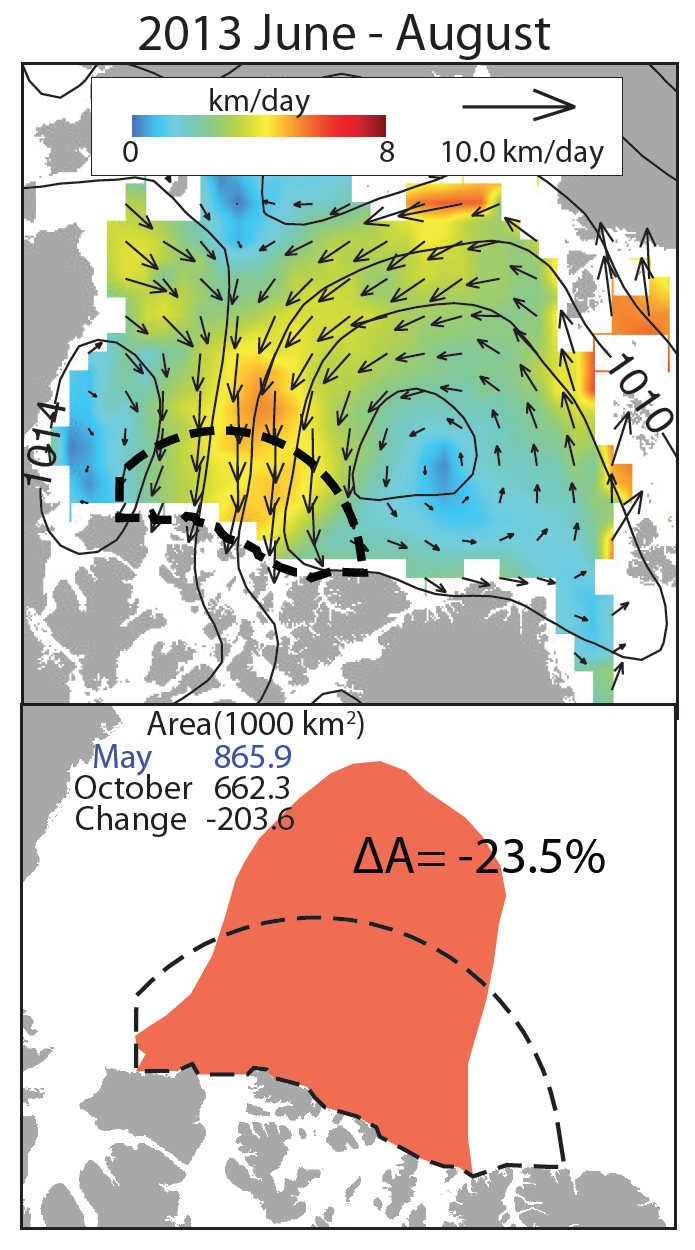
Figure 5. These graphs show onshore ice drift during the summer of 2013. Due to ice convergence, an ice area in May (in red) is compressed by ~23% by the end of the summer (dashed line).
Credit: Ron Kwok, NASA Jet Propulsion Laboratory
High-resolution image
Thick, deformed ice, made up of pressure ridges with deep keels, is formed when the sea ice cover is pushed against or converges on the coast. Sea ice convergence along the coasts of Greenland and the Canadian Arctic Archipelago is a source of the thickest ice (tens of meters) in the Arctic Ocean. The thicker ice is more likely to survive the summer to form the Arctic Ocean’s perennial ice cover. A new paper by Ron Kwok at the NASA Jet Propulsion Laboratory shows that in summer of 2013, strong wind-driven onshore ice drift was forced by the relative location of high- and low- pressure centers over the Arctic Ocean (see Figure 5). A sampled ice parcel (in red) shows an area compression of 23% between May and October; the dashes indicate its area by end of summer. This is equivalent to an increase in thickness of ~30% within that area. If this thicker ice were transported to areas of high melt rates (like that in the southern Beaufort), it would have an impact on summer ice coverage. The presence of a band of sea ice that survived a large part of the summer in 2015, is likely due to the thicker ice that formed in this region.
Reference
Kwok, R. 2015. Sea ice convergence along the Arctic coasts of Greenland and the Canadian Arctic Archipelago: Variability and extremes (1992–2014). Geophysical Research Letters, (Accepted) doi:10.1002/2015GL065462.