Arctic sea ice extent is well below average for this time of year, although ice has persisted in Baffin Bay and Hudson Bay. The Northern Sea Route appears to be mostly open, except for a narrow section along the Taymyr Peninsula. The Northwest Passage is still clogged with ice. Antarctic sea ice extent remains high, but the growth rate has slowed and extent is now closer to its long-term average for this time of year.
Overview of conditions
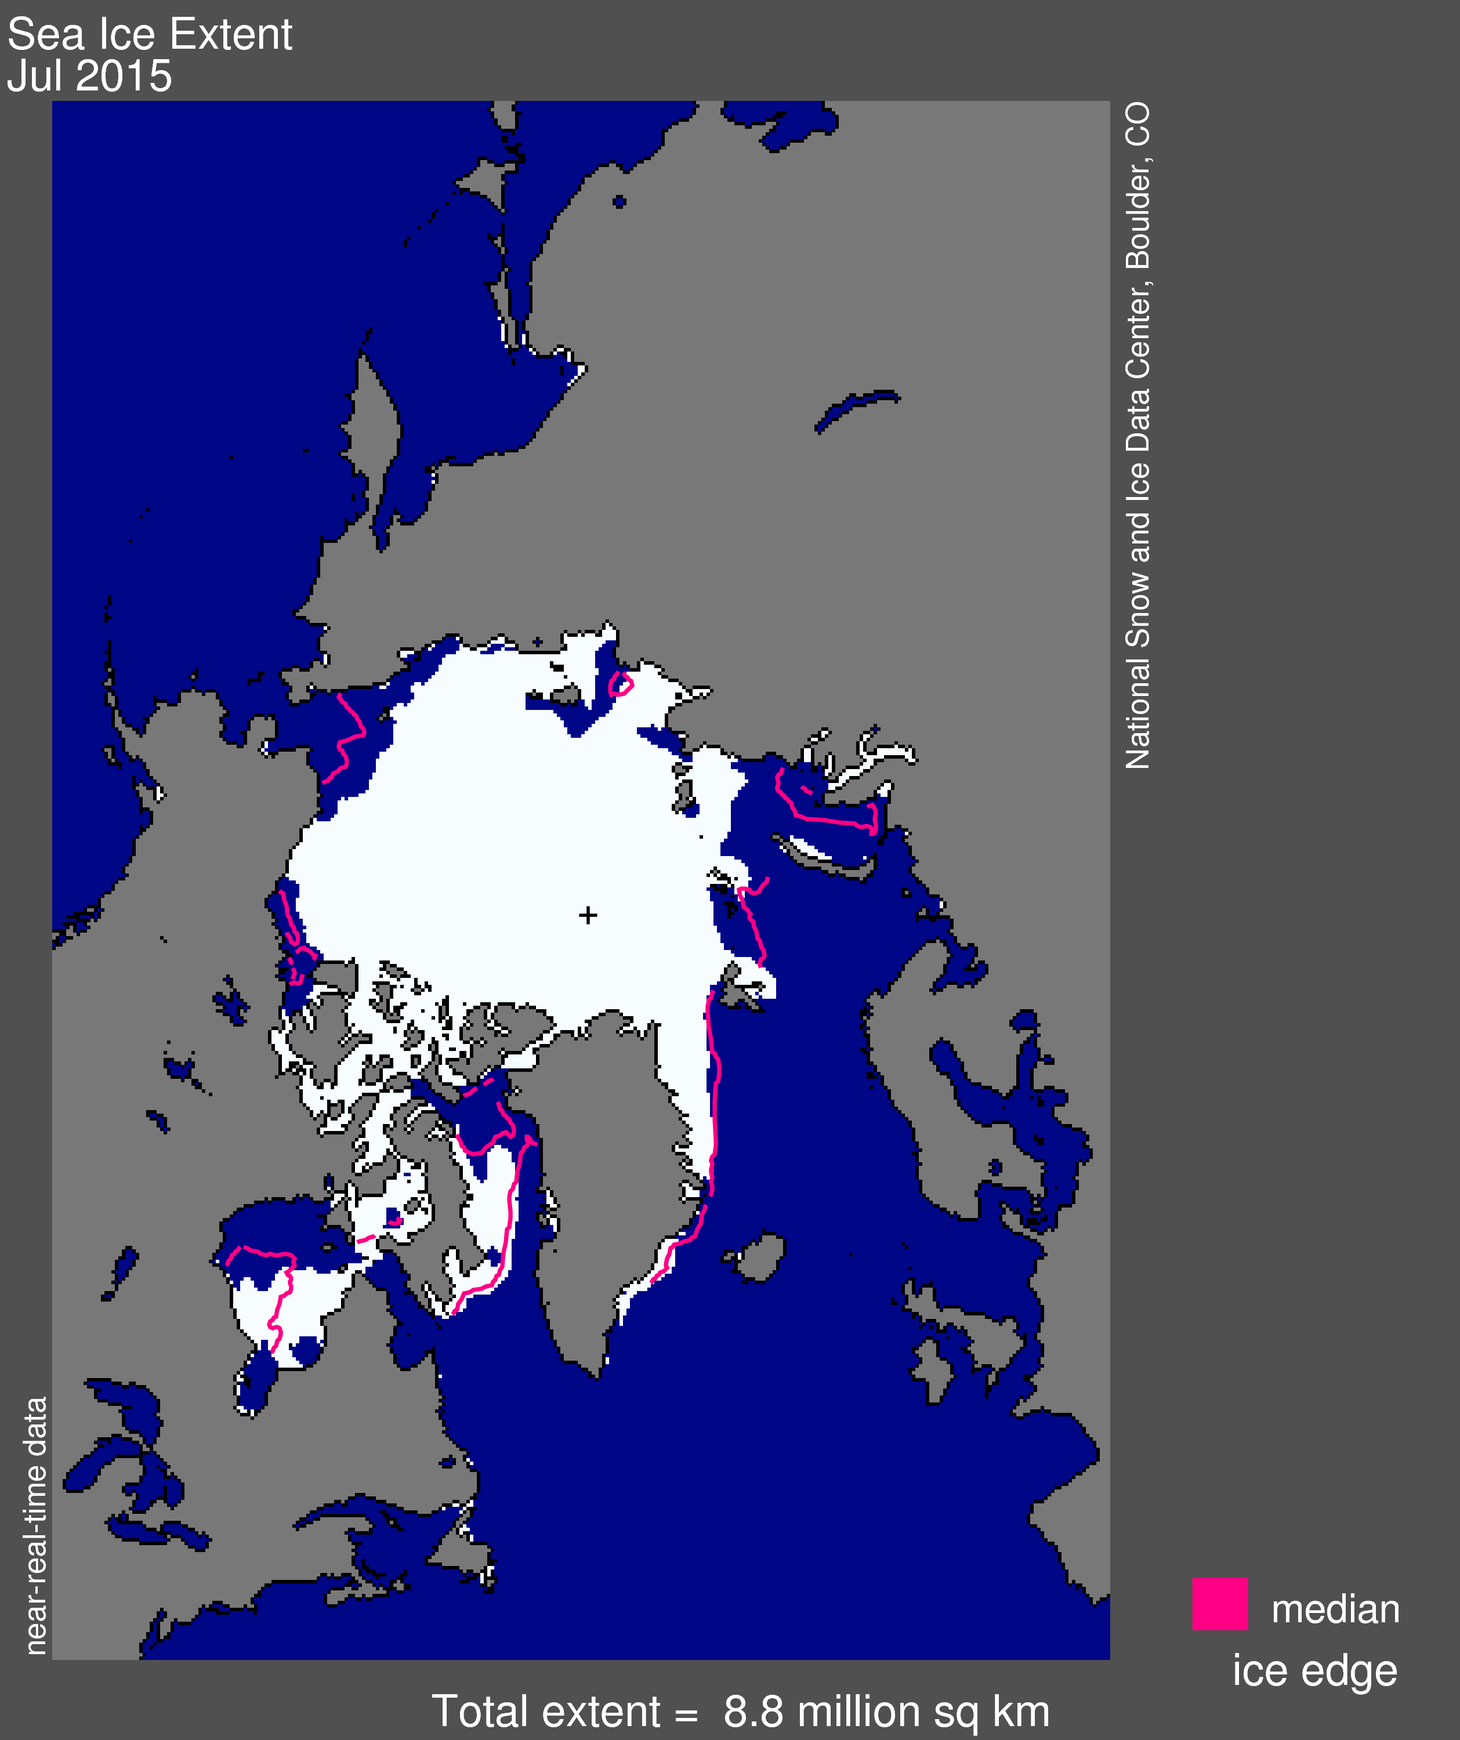
Figure 1. Arctic sea ice extent for July 2015 was 8.77 million square kilometers (3.38 million square miles). The magenta line shows the 1981 to 2010 median extent for that month. The black cross indicates the geographic North Pole. Sea Ice Index data. About the data
Credit: National Snow and Ice Data Center
High-resolution image
July 2015 average ice extent was 8.77 million square kilometers (3.38 million square miles), the 8th lowest July extent in the satellite record. This is 920,000 square kilometers (355,000 square miles) below the 1981 to 2010 average for the month.
While Arctic sea ice retreated at near average rates during the month of June, the pace of ice loss quickened in July such that the extent at the end of the month was within 550,000 square kilometers (212,000 square miles) of the extent recorded on the same date in 2012, and is now tracking below 2013 and 2014. Ice extent was at below average levels within the Kara, Barents, Chukchi, East Siberian, and Laptev seas, while extent was near average in the Beaufort Sea and the East Greenland Sea. Sea ice extent remained more extensive than average within Baffin Bay and Hudson Bay. While the ice extent remained overall higher than in 2012, this is largely a result of the higher extent within Baffin and Hudson bays. Despite average sea ice extent within the Beaufort Sea, higher resolution passive microwave satellite imagery from AMSR-2 and visible-band imagery from MODIS (Figure 6) reveals that the ice has become rather diffuse (low ice concentrations) with many large broken ice floes surrounded by open water.
Conditions in context
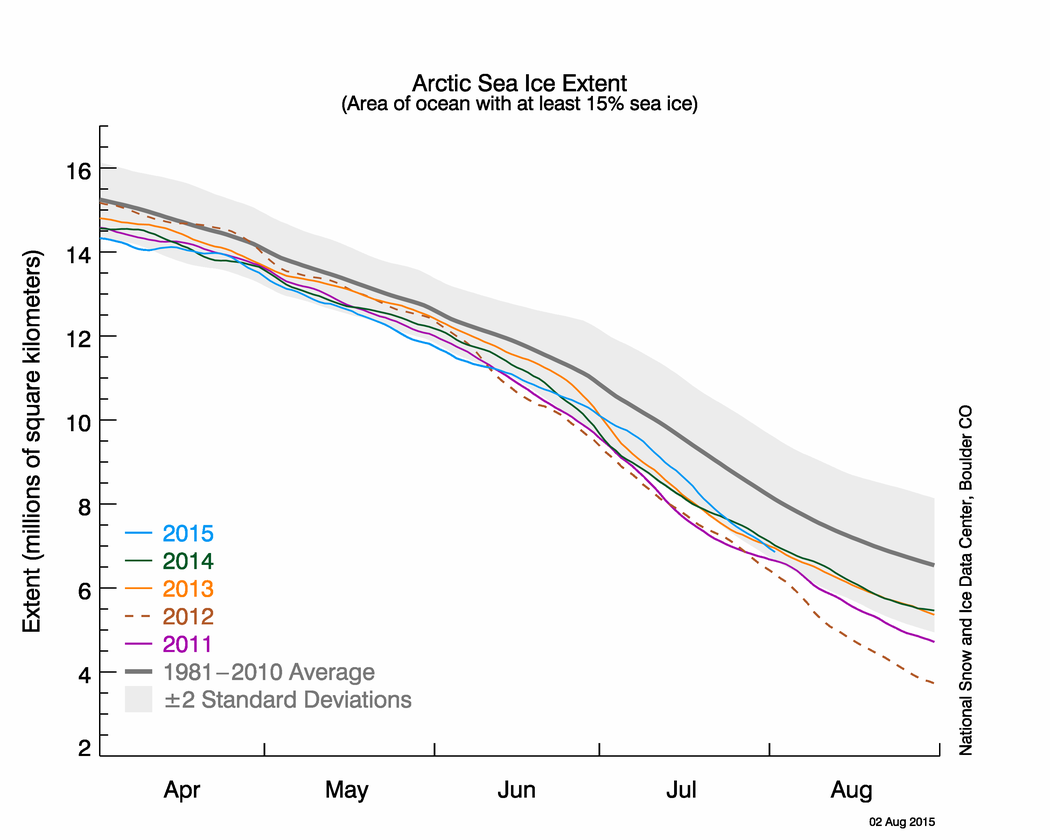
Figure 2. The graph above shows Arctic sea ice extent as of August 2, 2015, along with daily ice extent data for four previous years. 2015 is shown in blue, 2014 in green, 2013 in orange, 2012 in brown, and 2011 in purple. The 1981 to 2010 average is in dark gray. The gray area around the average line shows the two standard deviation range of the data. Sea Ice Index data.
Credit: National Snow and Ice Data Center
High-resolution image
Although the pace of ice loss is almost always faster in July than in June, the July rate of loss for 2015 has been pronounced. The rate of ice loss for July 2015 averaged 101,800 square kilometers (39,300 square miles) per day, compared to 97,400 square kilometers (37,600 square miles) in 2012 and 86,900 square kilometers (33,500 square miles) per day in the long-term 1981 to 2010 average. This rapid loss is in part a result of fairly high air temperatures over most of the Arctic Ocean. Temperatures at the 925 hPa level (3,000 feet above sea level) reached nearly 6 degrees Celsius (11 degrees Fahrenheit) above average directly north of Greenland, and up to 5 degrees Celsius (9 degrees Fahrenheit) above average in the East Siberian Sea. In contrast, temperatures were up to 5 degrees Celsius (9 degrees Fahrenheit) cooler than average in the Barents Sea. Sea level pressure was above average over most of the Arctic Ocean, most pronounced near the pole, and over the Greenland Ice Sheet. This was paired with below average pressures over Siberia. Overall, this pattern is very similar to what has come to be known as the Dipole Anomaly.
July 2015 compared to previous years
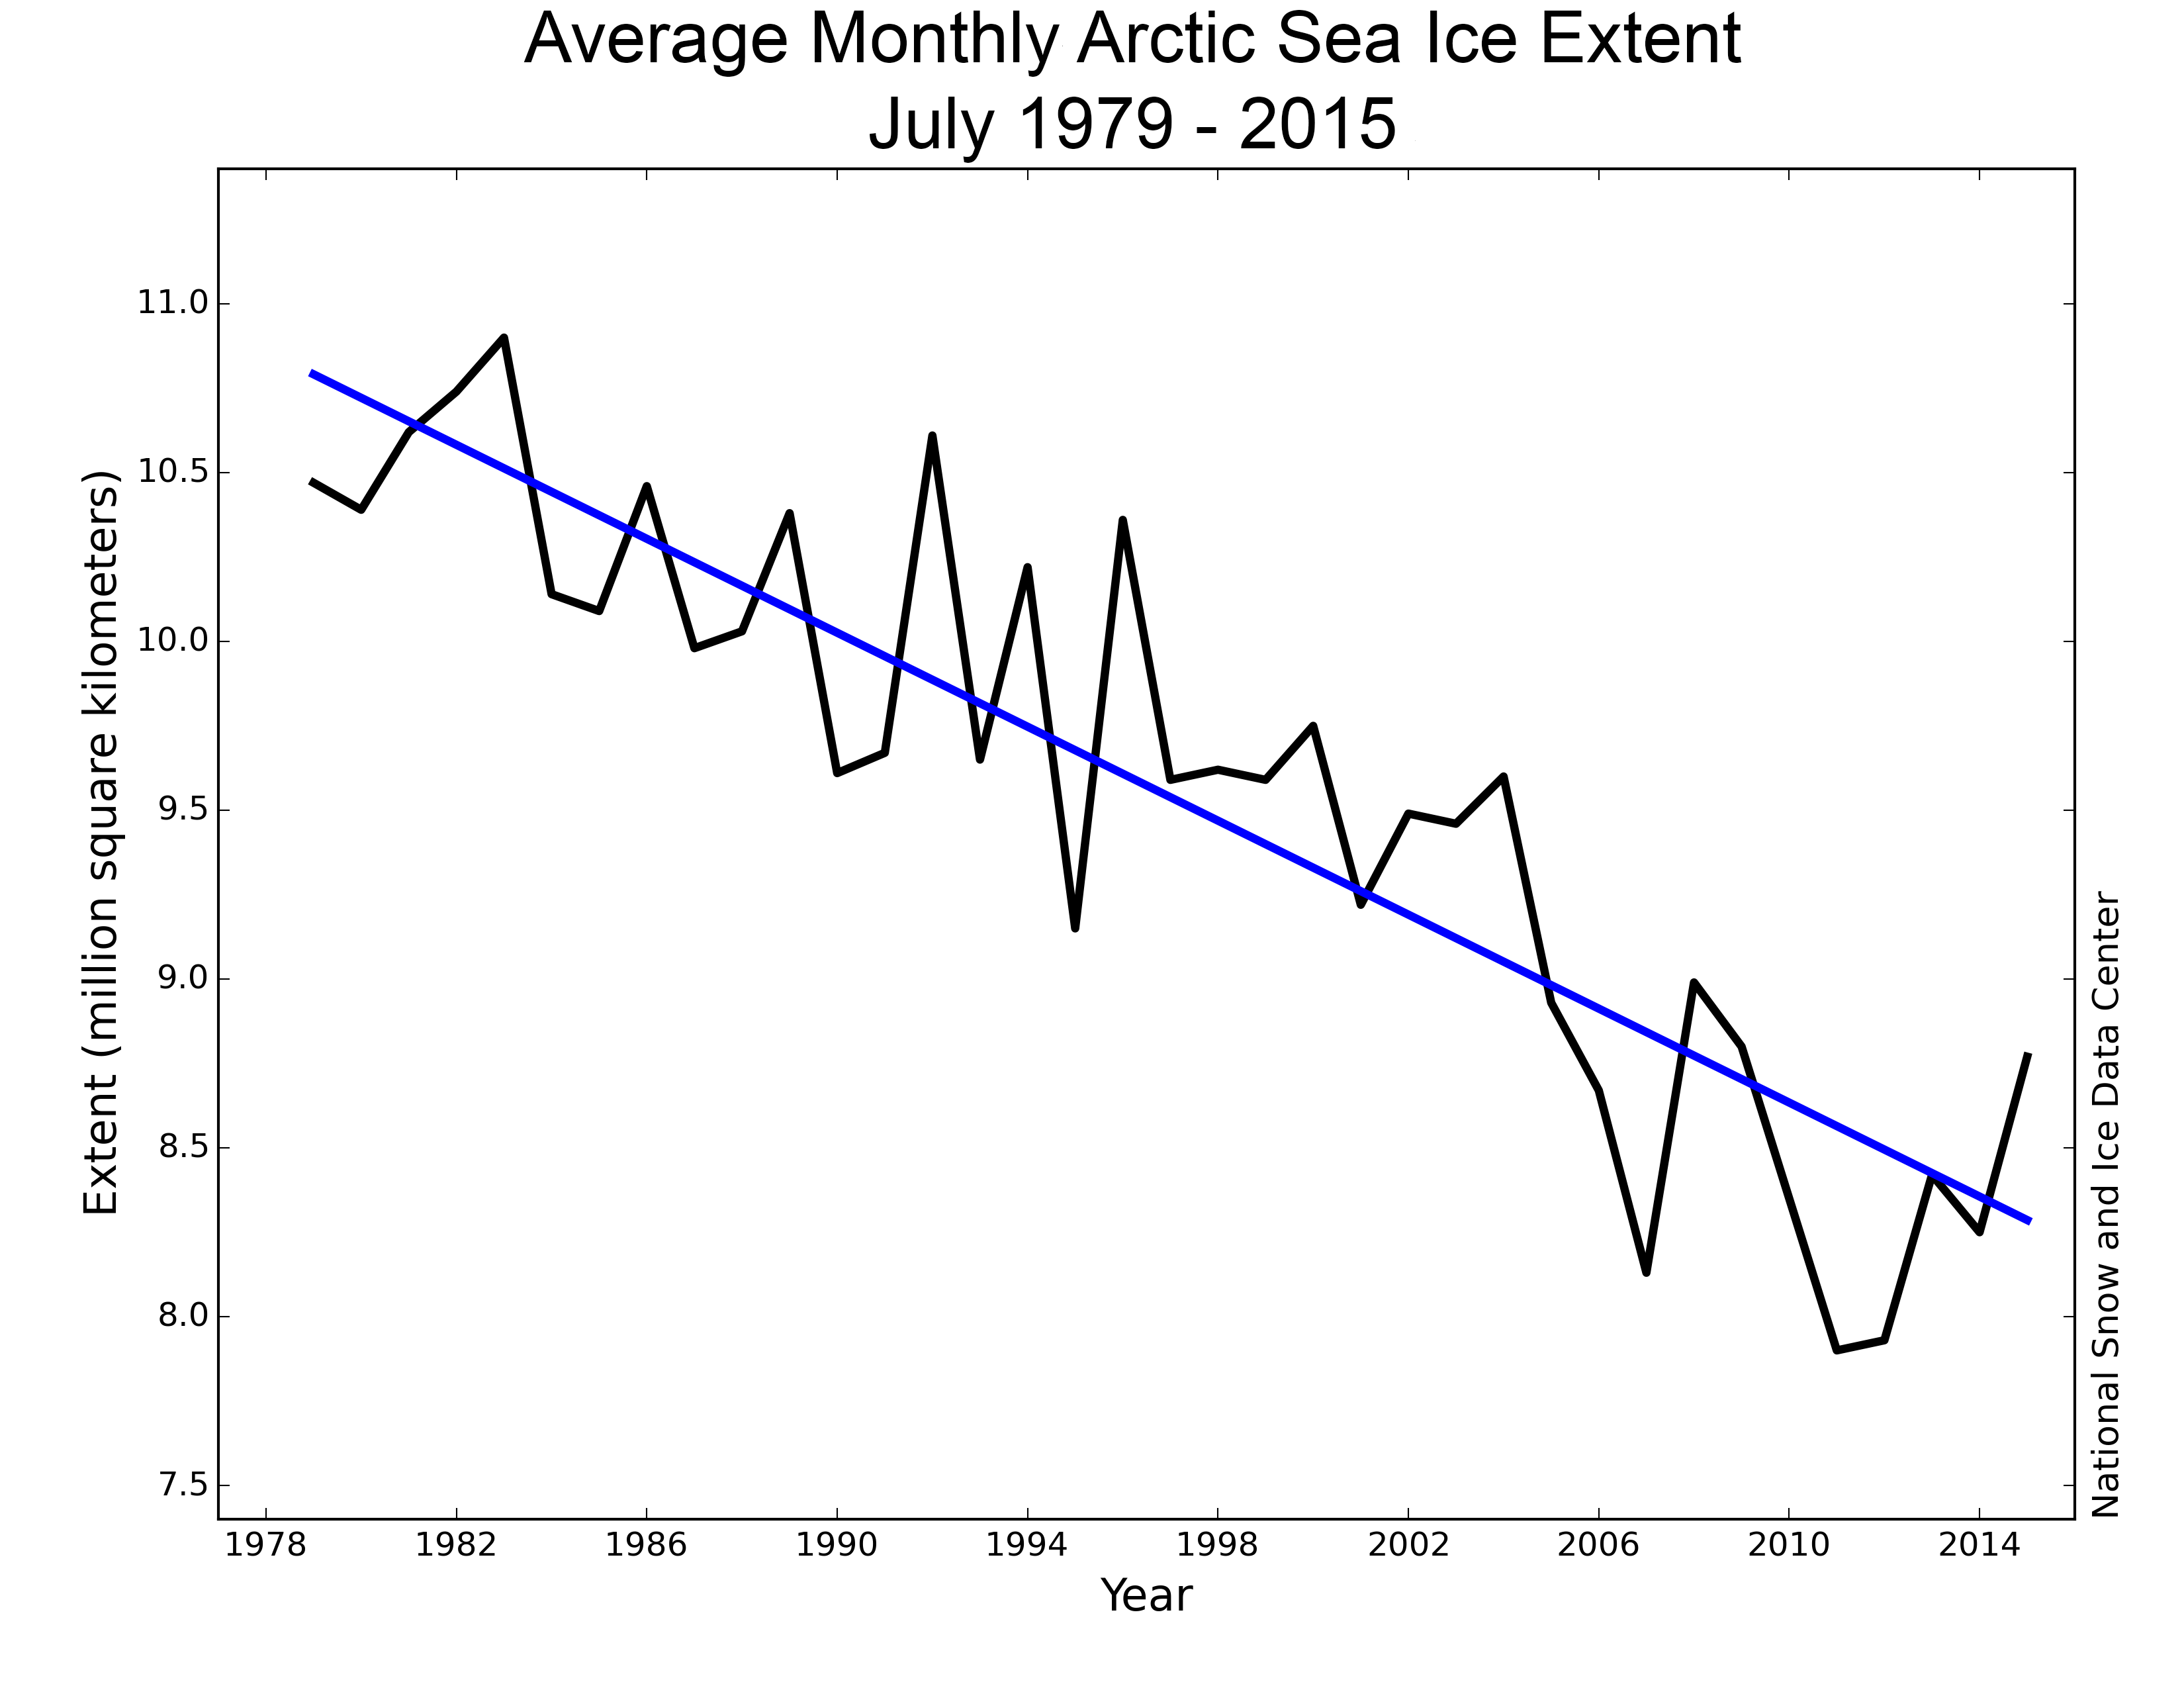
Figure 3. July ice extent for 1979 to 2015 shows a decline of 7.2% per decade relative to the 1981 to 2010 average.
Credit: National Snow and Ice Data Center
High-resolution image
Arctic sea ice extent averaged for July 2015 was the 8th lowest in the satellite data record. Through 2015, the linear rate of decline for July extent is 7.2% per decade.
Seasonal ice hanging on in Baffin and Hudson bays
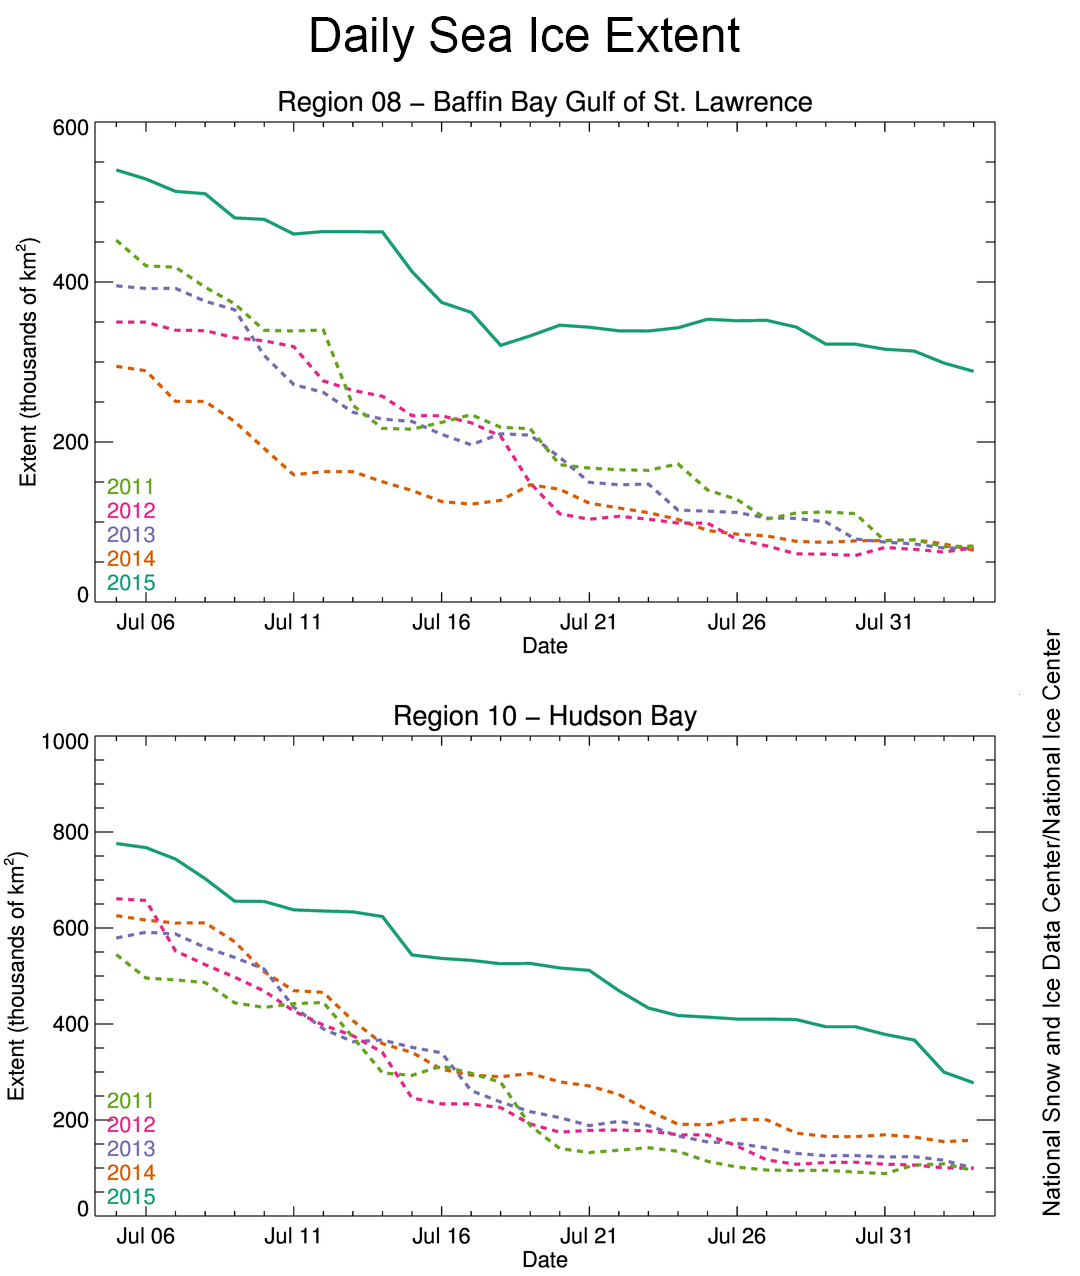
Figure 4. The graphs show daily sea ice extent from July 1, 2015 to August 3, 2015 (solid green line) compared to previous years, for the Baffin and Hudson bays. Data are from the Multisensor Analyzed Sea Ice Extent (MASIE) product.
Credit: National Snow and Ice Data Center/National Ice Center
High-resolution image
This summer, the ice has been slow to retreat in the Baffin and Hudson bays, as highlighted by the Multisensor Analyzed Sea Ice (MASIE) product. Throughout July, ice in the bays remained more extensive than in recent summers, adding an extra 500,000 square kilometers (193,000 square miles) of ice to the Arctic total. These areas, normally navigable at this time of year, are reported to be clogged with ice. The heavy ice conditions made fuel resupply difficult for some coastal communities in Nunavut and Nunavik. A supply ship was delayed three weeks attempting to reach Nunavik, and Arctic research projects have been delayed as well. More extensive ice than usual in the eastern part of Hudson Bay also resulted in delays of resupply for communities in Northern Quebec. Polar bears, which are usually farther out on the ice edge at this time of year, were observed in Iqaluit.
Melt started early in 2015
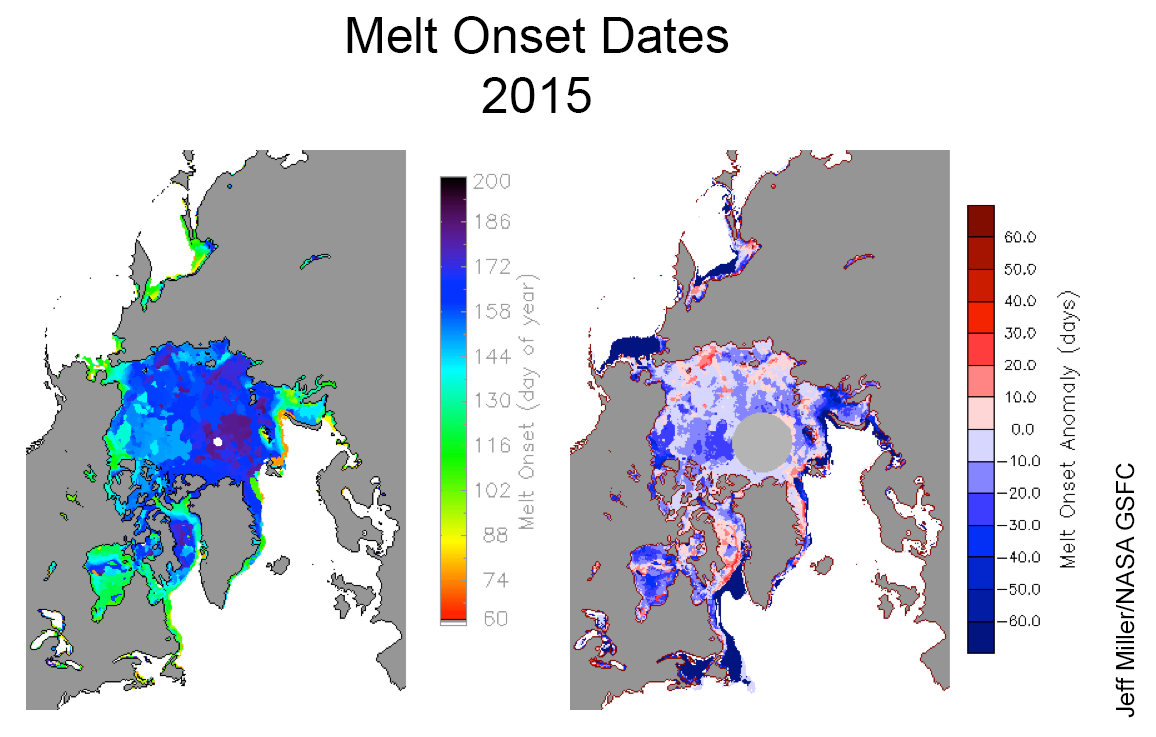
Figure 5. The map at left shows melt onset dates for 2015. The map at right shows anomalies (departure from average) compared to the 1981 to 2010 long-term average. Data are from the Scanning Multichannel Microwave Radiometer (SMMR) and Special Sensor Microwave Imager (SSM/I) passive microwave time series.
Credit: Jeff Miller, NASA Goddard Space Flight Center
High-resolution image
The timing of seasonal melt onset plays an important role in the amount of ice that can be melted each summer. When melt begins, the surface albedo drops, meaning that more of the sun’s energy is absorbed by the surface, favoring further melt and a further decline in albedo. Because microwave emissions are sensitive to liquid water in the snowpack, the timing of melt onset can be detected using the same satellite passive microwave data that is used for determining the sea ice extent, but with a different algorithm. This summer, melt began a month earlier than average in the Kara Sea, where the ice cover retreated early in the summer, and in the southern Beaufort Sea, where the ice cover is now very diffuse. In contrast, melt came later than average in Baffin Bay where the ice has been slow to completely melt out this summer. Melt also came later than average in parts of the East Siberian and Laptev seas.
Breakup of old, thick ice in the Beaufort Sea
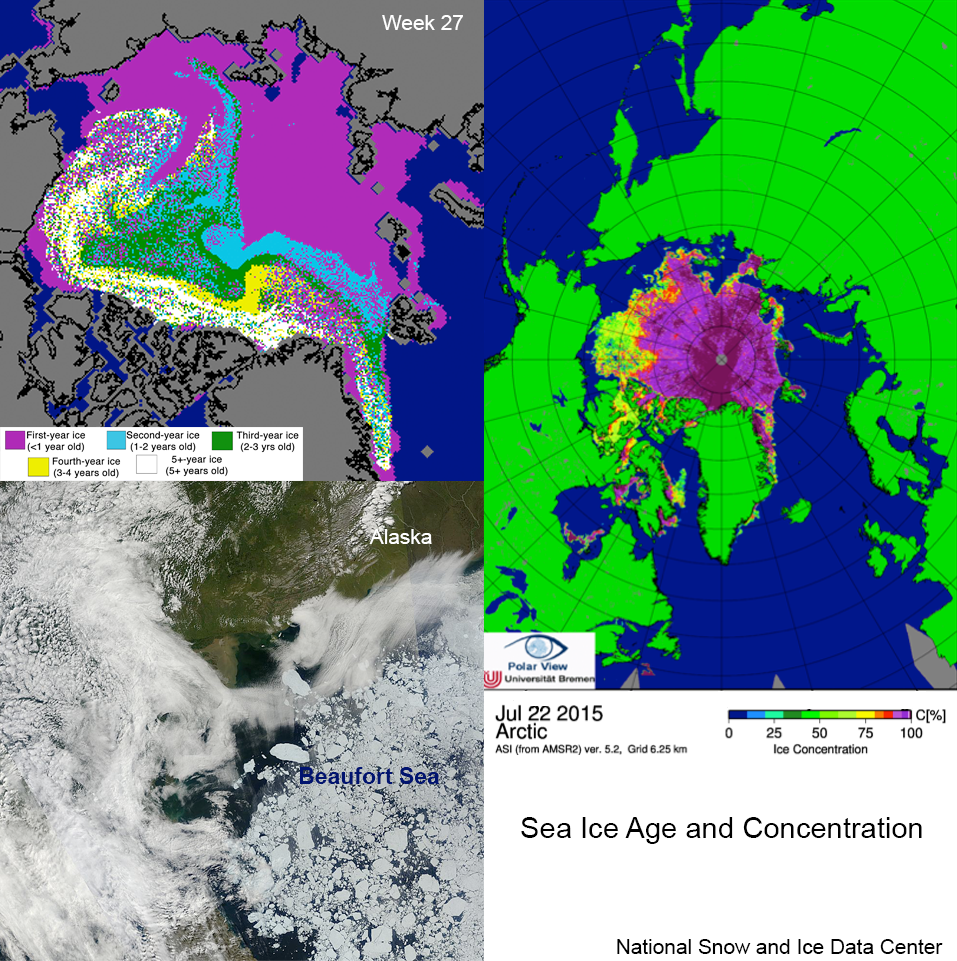
Figure 6. The map at top, left shows ice age, in years, for the beginning of July 2015 (Week 27, June 29 to July 5). The MODIS satellite image (bottom, left) of the Beaufort Sea area, from July 22, 2015, shows a mélange of very large and smaller multiyear ice floes surrounded by open water. The AMSR-2 satellite image from July 22 (top, right) shows ice percent concentration. Ice age data are from C. Fowler and J. Maslanik, University of Colorado Boulder. MODIS data are from the Land Atmosphere Near-Real Time Capability for EOS (LANCE) System, NASA/GSFC. Sea ice concentration image courtesy University of Bremen from the JAXA AMSR-2 sensor.
Credit: National Snow and Ice Data Center
High-resolution image
Multiyear ice, which is ice that has survived at least one melt season, tends to be fairly thick. The location of multiyear ice and its age can be determined through tracking the ice motion from year to year. Ice age data from the beginning of July show a tongue of old multiyear ice extending from the southern Beaufort Sea towards Alaska into the Chukchi Sea. However, passive microwave imagery from AMSR-2 reveals that the ice pack has become very diffuse within the Beaufort Sea, with ice concentrations dropping below 50%. Corresponding visible-band imagery from MODIS shows a mélange of very large and smaller multiyear ice floes surrounded by open water. The presence of open water surrounding the floes allows for enhanced lateral and basal ice melt, raising the possibility that much of the multiyear ice in this region will melt out during the remainder of the summer.
Antarctic sea ice extent pauses, still high

Figure 6. The graph above shows Antarctic sea ice extent as of August 3, 2015, along with daily ice extent data for 2010, 2013, and 2015. 2015 is shown in solid blue, 2014 in green, 2013 in dashed blue, and 2010 in pink. The 1981 to 2010 average is in dark gray. The gray area around the average line shows the two standard deviation range of the data. Sea Ice Index data.
Credit: National Snow and Ice Data Center
High-resolution image
July average extent for Antarctica was 17.06 million square kilometers (6.59 million square miles). Sea ice extent grew at approximately 150,000 square kilometers per day (58,000 square miles per day) for the first half of July, but then growth slowed to just 10,000 square kilometers (3,900 square miles) per day for much of the rest of the month. The change was due to regional ice retreats in the northern Weddell Sea and northwestern Ross Sea, almost balanced by continued growth in the northern Bellingshausen Sea west of the Antarctic Peninsula. The slower growth in sea ice extent places 2015 now at around 4th highest in terms of daily extent, below 2014, 2013, and 2010.
Relatively warm conditions prevailed for much of the month in the two regions of ice edge retreat, the northern Weddell Sea and northwestern Ross Sea, with average air temperatures at the 925 hPa level (3,000 feet above sea level) at approximately 4 degrees Celsius (7 degrees Fahrenheit) above average. However, sea surface temperatures just north of the ice edge were 0.5 to 1 degree Celsius (1 to 2 degrees Fahrenheit) cooler than average, raising the potential for rapid ice growth through the remainder of the winter season.

