Arctic sea ice extent was the third lowest for the month of January. Ice extent remained lower than average in the Bering Sea and Sea of Okhotsk, while ice in the Barents Sea was near average. Antarctic sea ice extent declined rapidly in late January, but remains high.
Overview of conditions
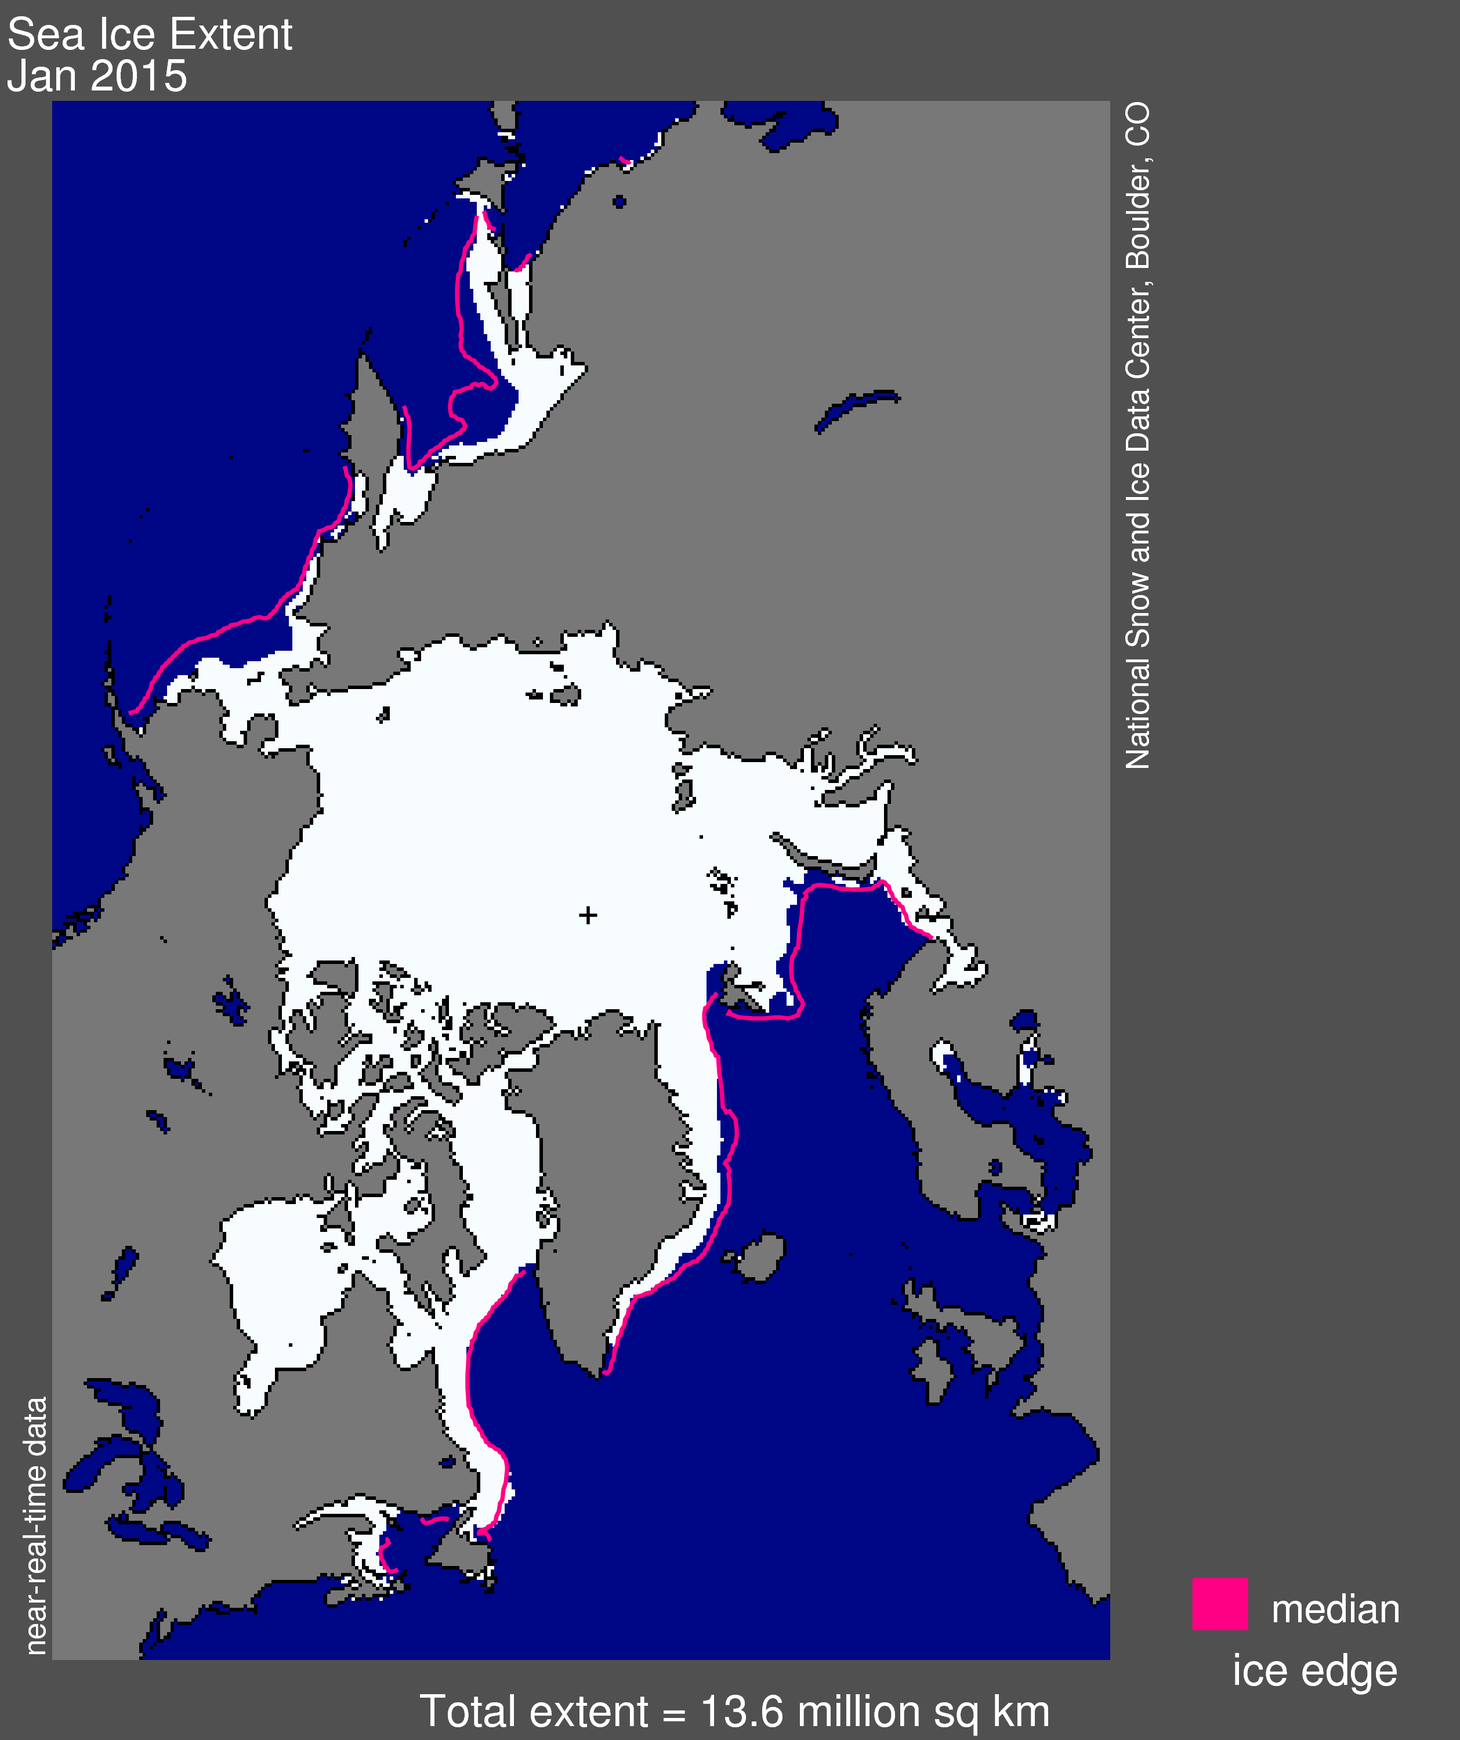
Figure 1. Arctic sea ice extent for January 2015 was 13.62 million square kilometers (5.26 million square miles). The magenta line shows the 1981 to 2010 median extent for that month. The black cross indicates the geographic North Pole. Sea Ice Index data. About the data
Credit: National Snow and Ice Data Center
High-resolution image
Sea ice extent in January averaged 13.62 million square kilometers (5.26 million square miles). This is 910,000 square kilometers (351,000 square miles) below the 1981 to 2010 long-term average of 14.53 million square kilometers (5.61 million square miles), and 50,000 square kilometers (19,000 square miles) above the record low for the month observed in 2011.
This below-average Arctic extent is mainly a result of lower-than-average extent in the Bering Sea and the Sea of Okhotsk. On the Atlantic side, Barents Sea ice extent is near average. This is in sharp contrast to the general pattern seen since 2004 of below average extent in this region, but above average extent in the Bering Sea. Ice extent is also near average in the East Greenland Sea, Baffin Bay and the Labrador Sea.
Conditions in context
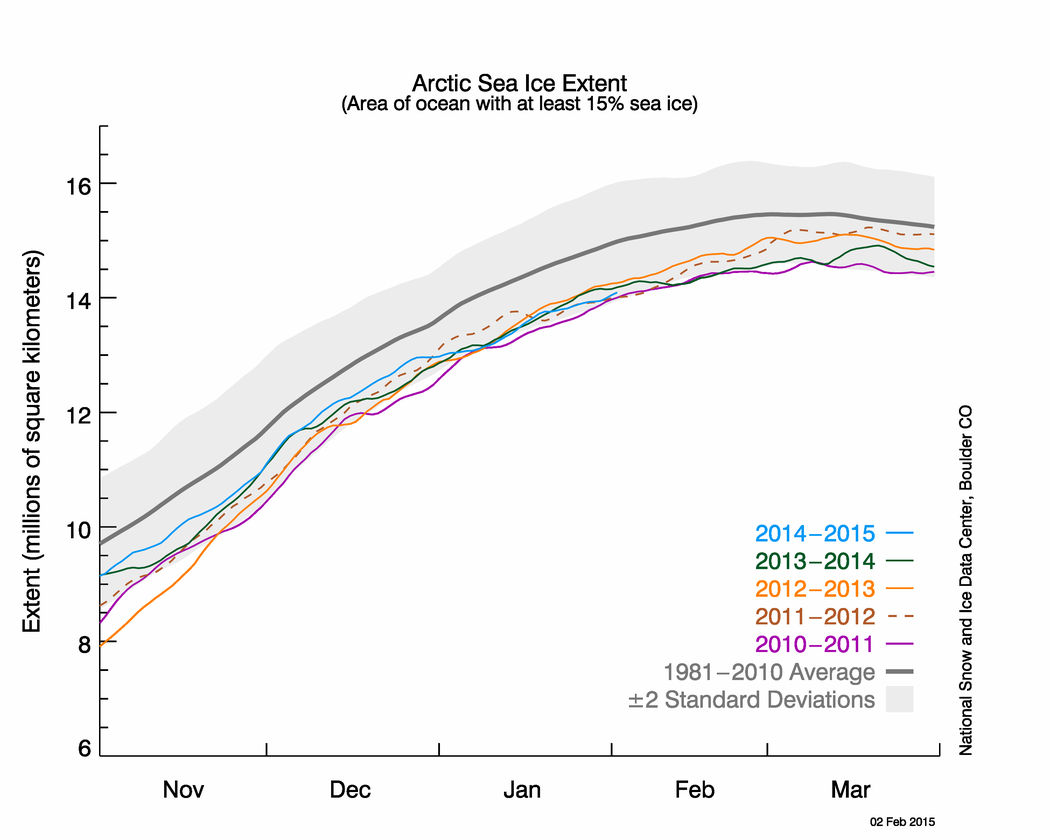
Figure 2. The graph above shows Arctic sea ice extent as of February 2, 2015, along with daily ice extent data for four previous years. 2014 to 2015 is shown in blue, 2013 to 2014 in green, 2012 to 2013 in orange, 2011 to 2012 in brown, and 2010 to 2011 in purple. The 1981 to 2010 average is in dark gray. The gray area around the average line shows the two standard deviation range of the data. Sea Ice Index data.
Credit: National Snow and Ice Data Center
High-resolution image
During most of January, the Arctic Oscillation (AO) was in a strongly positive phase. When the AO is in a positive phase, sea level pressure in the Arctic is particularly low, and sea level pressure is relatively high in the middle latitudes of the Northern Hemisphere. Variability in Arctic sea ice conditions is strongly influenced by the phase of the AO. Typically, during the positive phase of the AO, surface winds push ice away from the shores of Siberia, leading to the formation of more young, thin ice that is prone to melting out in summer. The positive phase also tends to increase the transport of thick, multiyear ice out of the Arctic through Fram Strait.
Air temperatures (at the 925 millibar level, about 3,000 feet above the surface) were mostly above average over most of the Arctic Ocean, with positive anomalies of 4 to 6 degrees Celsius (7 to 11 degrees Fahrenheit) over the Chukchi and Bering seas on the Pacific side of the Arctic, and also over the East Greenland Sea on the Atlantic side.
January 2015 compared to previous years
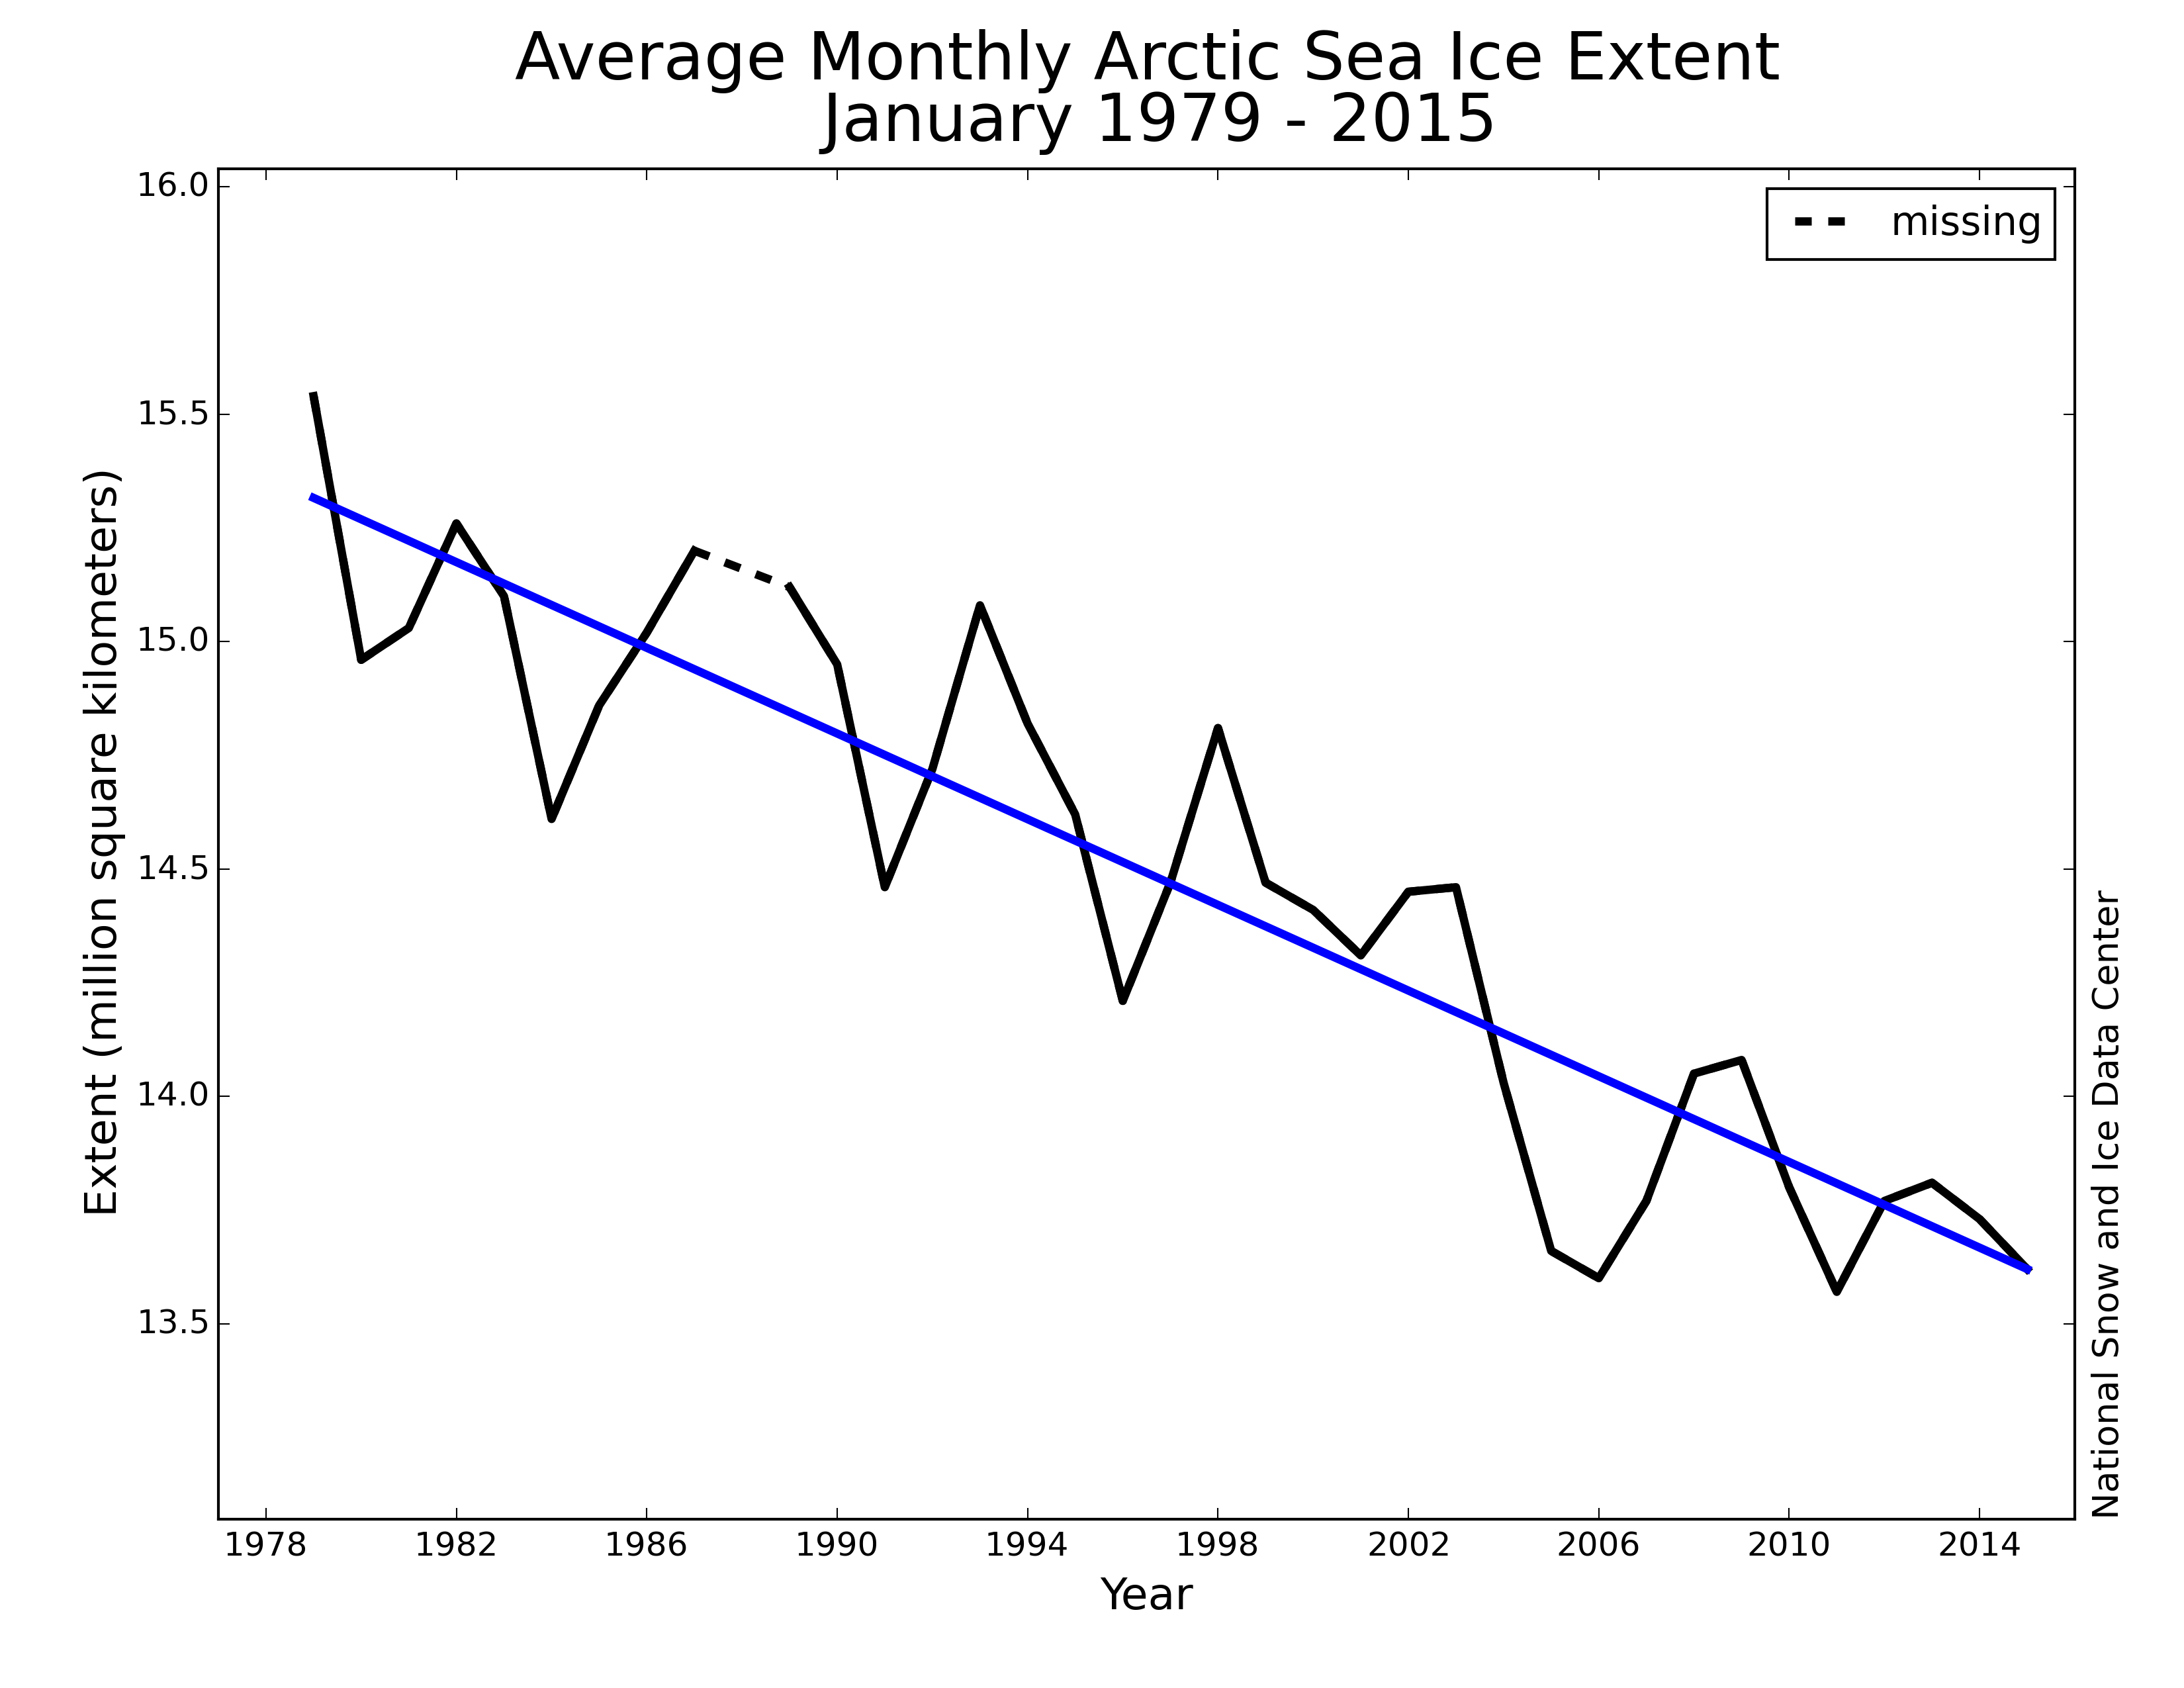
Figure 3. Monthly January ice extent for 1979 to 2015 shows a decline of 3.2% per decade relative to the 1981 to 2010 average.
Credit: National Snow and Ice Data Center
High-resolution image
Arctic sea ice extent for January was the third lowest in the satellite record. Through 2015, the linear rate of decline for January extent over the satellite record is 3.2% per decade.
Barents Sea ice variability
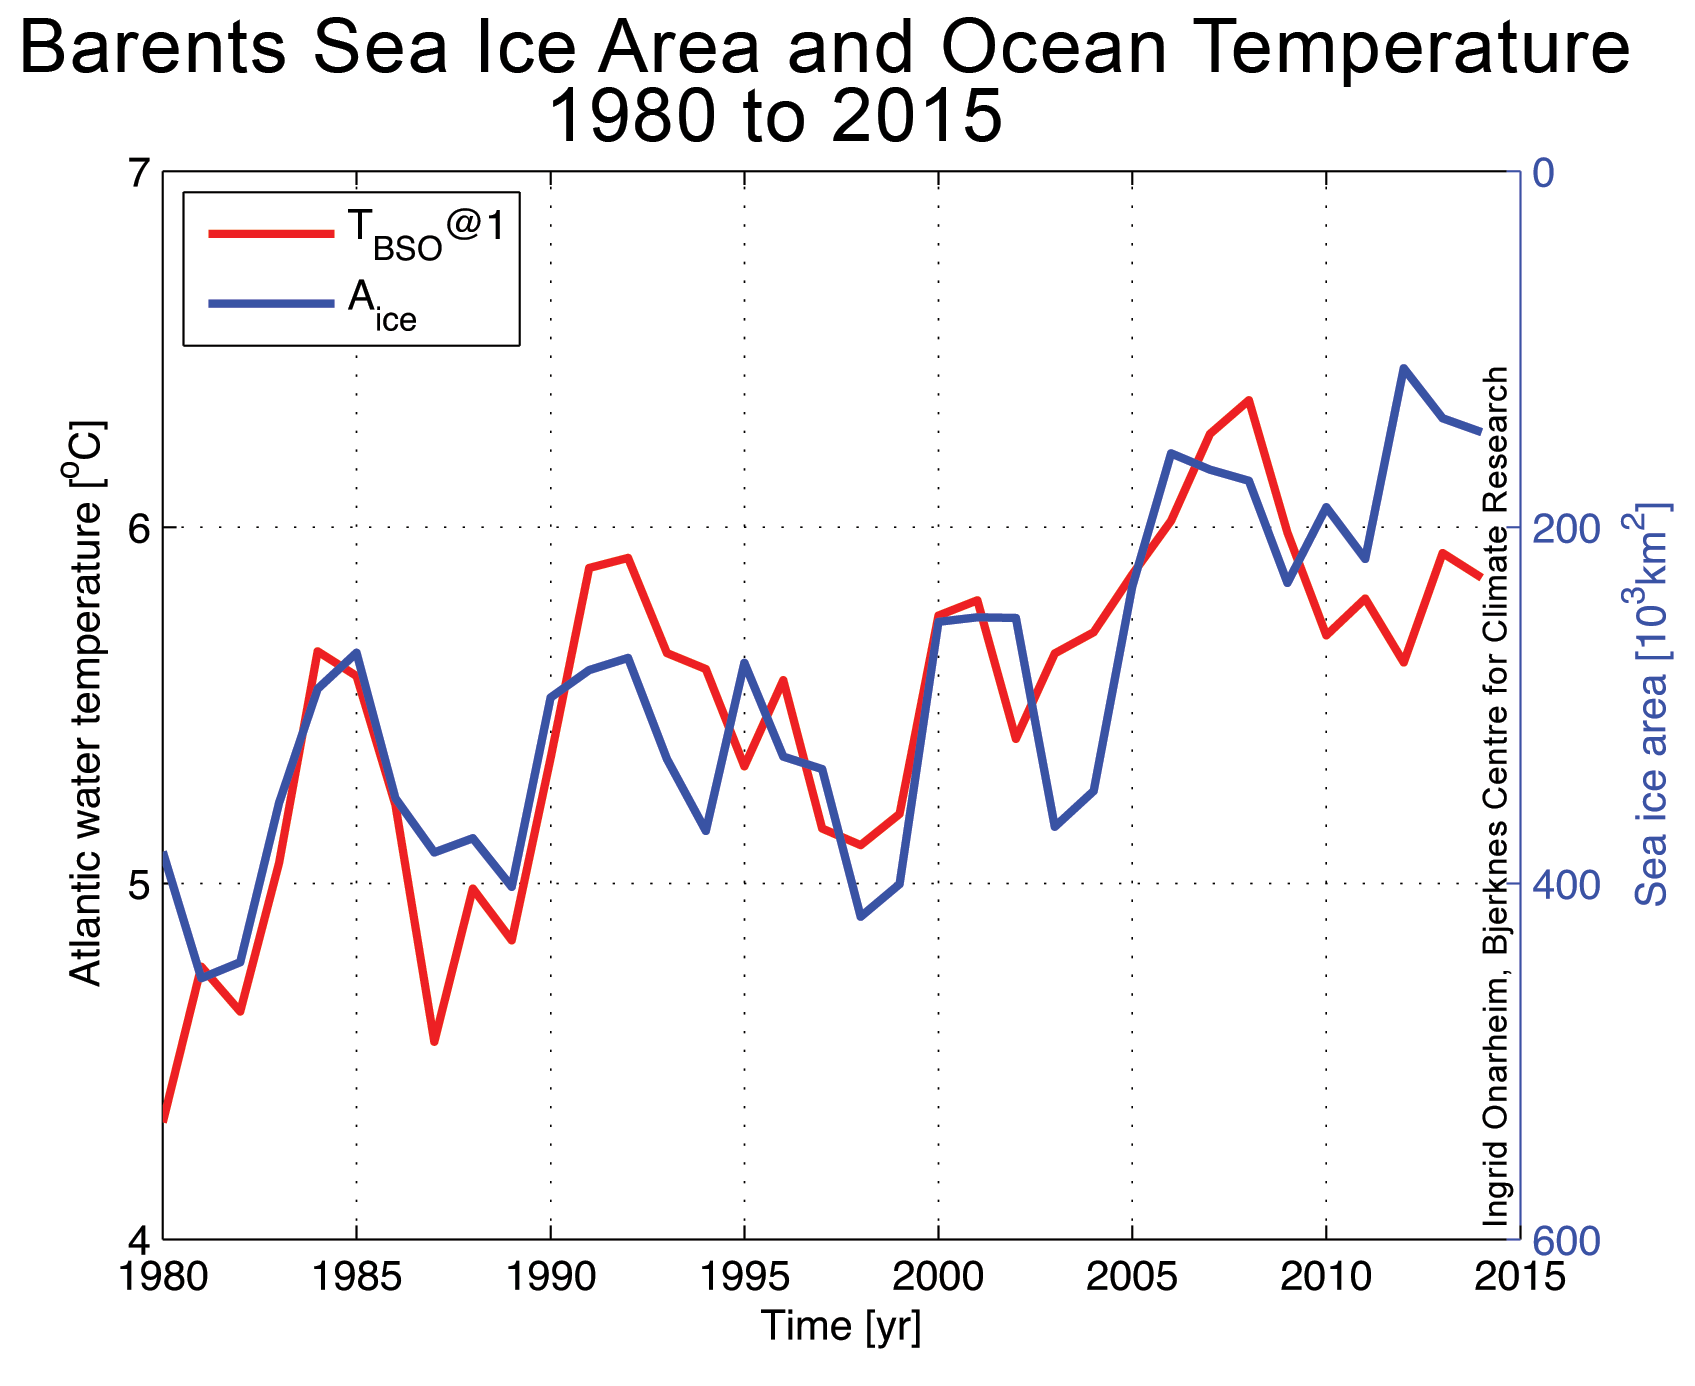
Figure 4. The graph shows Barents Sea ice area (blue line) and ocean temperatures in the Barents Sea Opening (red line) from 1980 to 2015. The sea ice area tends to be smaller for higher Atlantic water temperatures, with a lag of 1 to 2 years (note the reversed scale for Atlantic water temperatures). The data are based on Årthun et al. (2012), who find that the ocean temperature largely reflects changes in volume of Atlantic water inflow. Sea ice area anomalies are from the NASA Team algorithm (Cavalieri et al., 1996), provided by the National Snow and Ice Data Center. Ocean temperature has been sampled by the Institute of Marine Research (IMR), Norway, and is a section between Norway and Bear Island (BSO; 71.5-73.5N, 20E).
Credit: Ingrid Onarheim, Bjerknes Centre for Climate Research
High-resolution image
Variability in winter sea ice in the Barents Sea largely reflects ocean heat transport. The inflow of Atlantic water between Norway and Bear Island (the Barents Sea Opening or BSO) is the Barents Sea’s main oceanic heat source. Because there are no significant freshwater sources reaching the central Barents Sea, this warm Atlantic water extends to the surface and readily impacts the sea ice. This contrasts with the rest of the Arctic Ocean, where the Atlantic water lies well beneath the slightly fresher polar surface layer. The import of sea ice in the northern straits is also small, around 20% of the sea ice area exported southwards in the Fram Strait, meaning that the Barents Sea primarily consists of thin, first-year ice. Thus, periods with large volumes of warm Atlantic water entering into the Barents Sea are correlated with less sea ice formation and overall less sea ice extent.
Variations in winter ice extent in the Barents Sea are well correlated with variations in overall Arctic sea ice extent, as assessed over the satellite record. This winter is an exception. Sea ice extent in the Barents Sea is fairly high compared to recent years, while it is low for the Arctic as a whole. According to colleagues at the University of Bergen, this is due to a reduced overall inflow of Atlantic waters. A maximum in the ocean heat transport occurred in the mid 2000s, yet since then, the inflow has in general lessened, both along the Norwegian coast, through the Fram Strait, and through the Barents Sea Opening between Norway and Bear Island. Variations in Atlantic inflow is a focus of ongoing research at the Bjerknes Centre in Bergen, as well as in other research centers in Europe.
Antarctic sea ice declines rapidly, still high
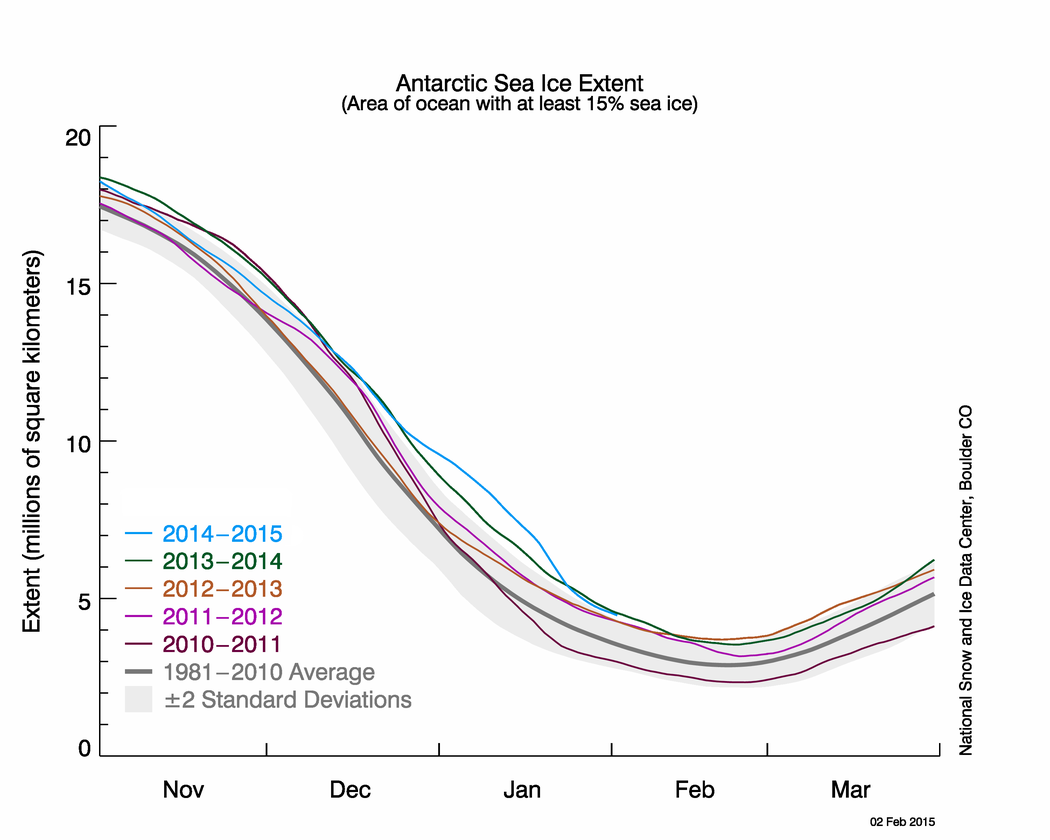
Figure 5a. The graph above shows Antarctic sea ice extent as of February 2, 2015, along with daily ice extent data for four previous years. 2014 to 2015 is shown in blue, 2013 to 2014 in green, 2012 to 2013 in orange, 2011 to 2012 in brown, and 2010 to 2011 in purple. The 1981 to 2010 average is in dark gray. The gray area around the average line shows the two standard deviation range of the data. Sea Ice Index data.
Credit: National Snow and Ice Data Center
High-resolution image
Antarctic sea ice extent reached record high levels for late December 2014 and early January 2015, peaking around January 10 at more than 2.5 million square kilometers (965,000 square miles) above the 1981 to 2010 average, and 1.05 million square kilometers (580,000 square miles) above the previous record (2014) for that date. As noted last month, the largest excursions are occurring in the northern Weddell Sea and the northern Ross Sea. After January 10, and particularly after January 19, sea ice extent dropped rapidly (~250,000 square kilometers, or 96,500 square miles, per day), and large areas of the northern Ross Sea became ice free. The northern Weddell region still has a very large ice extent relative to average conditions.
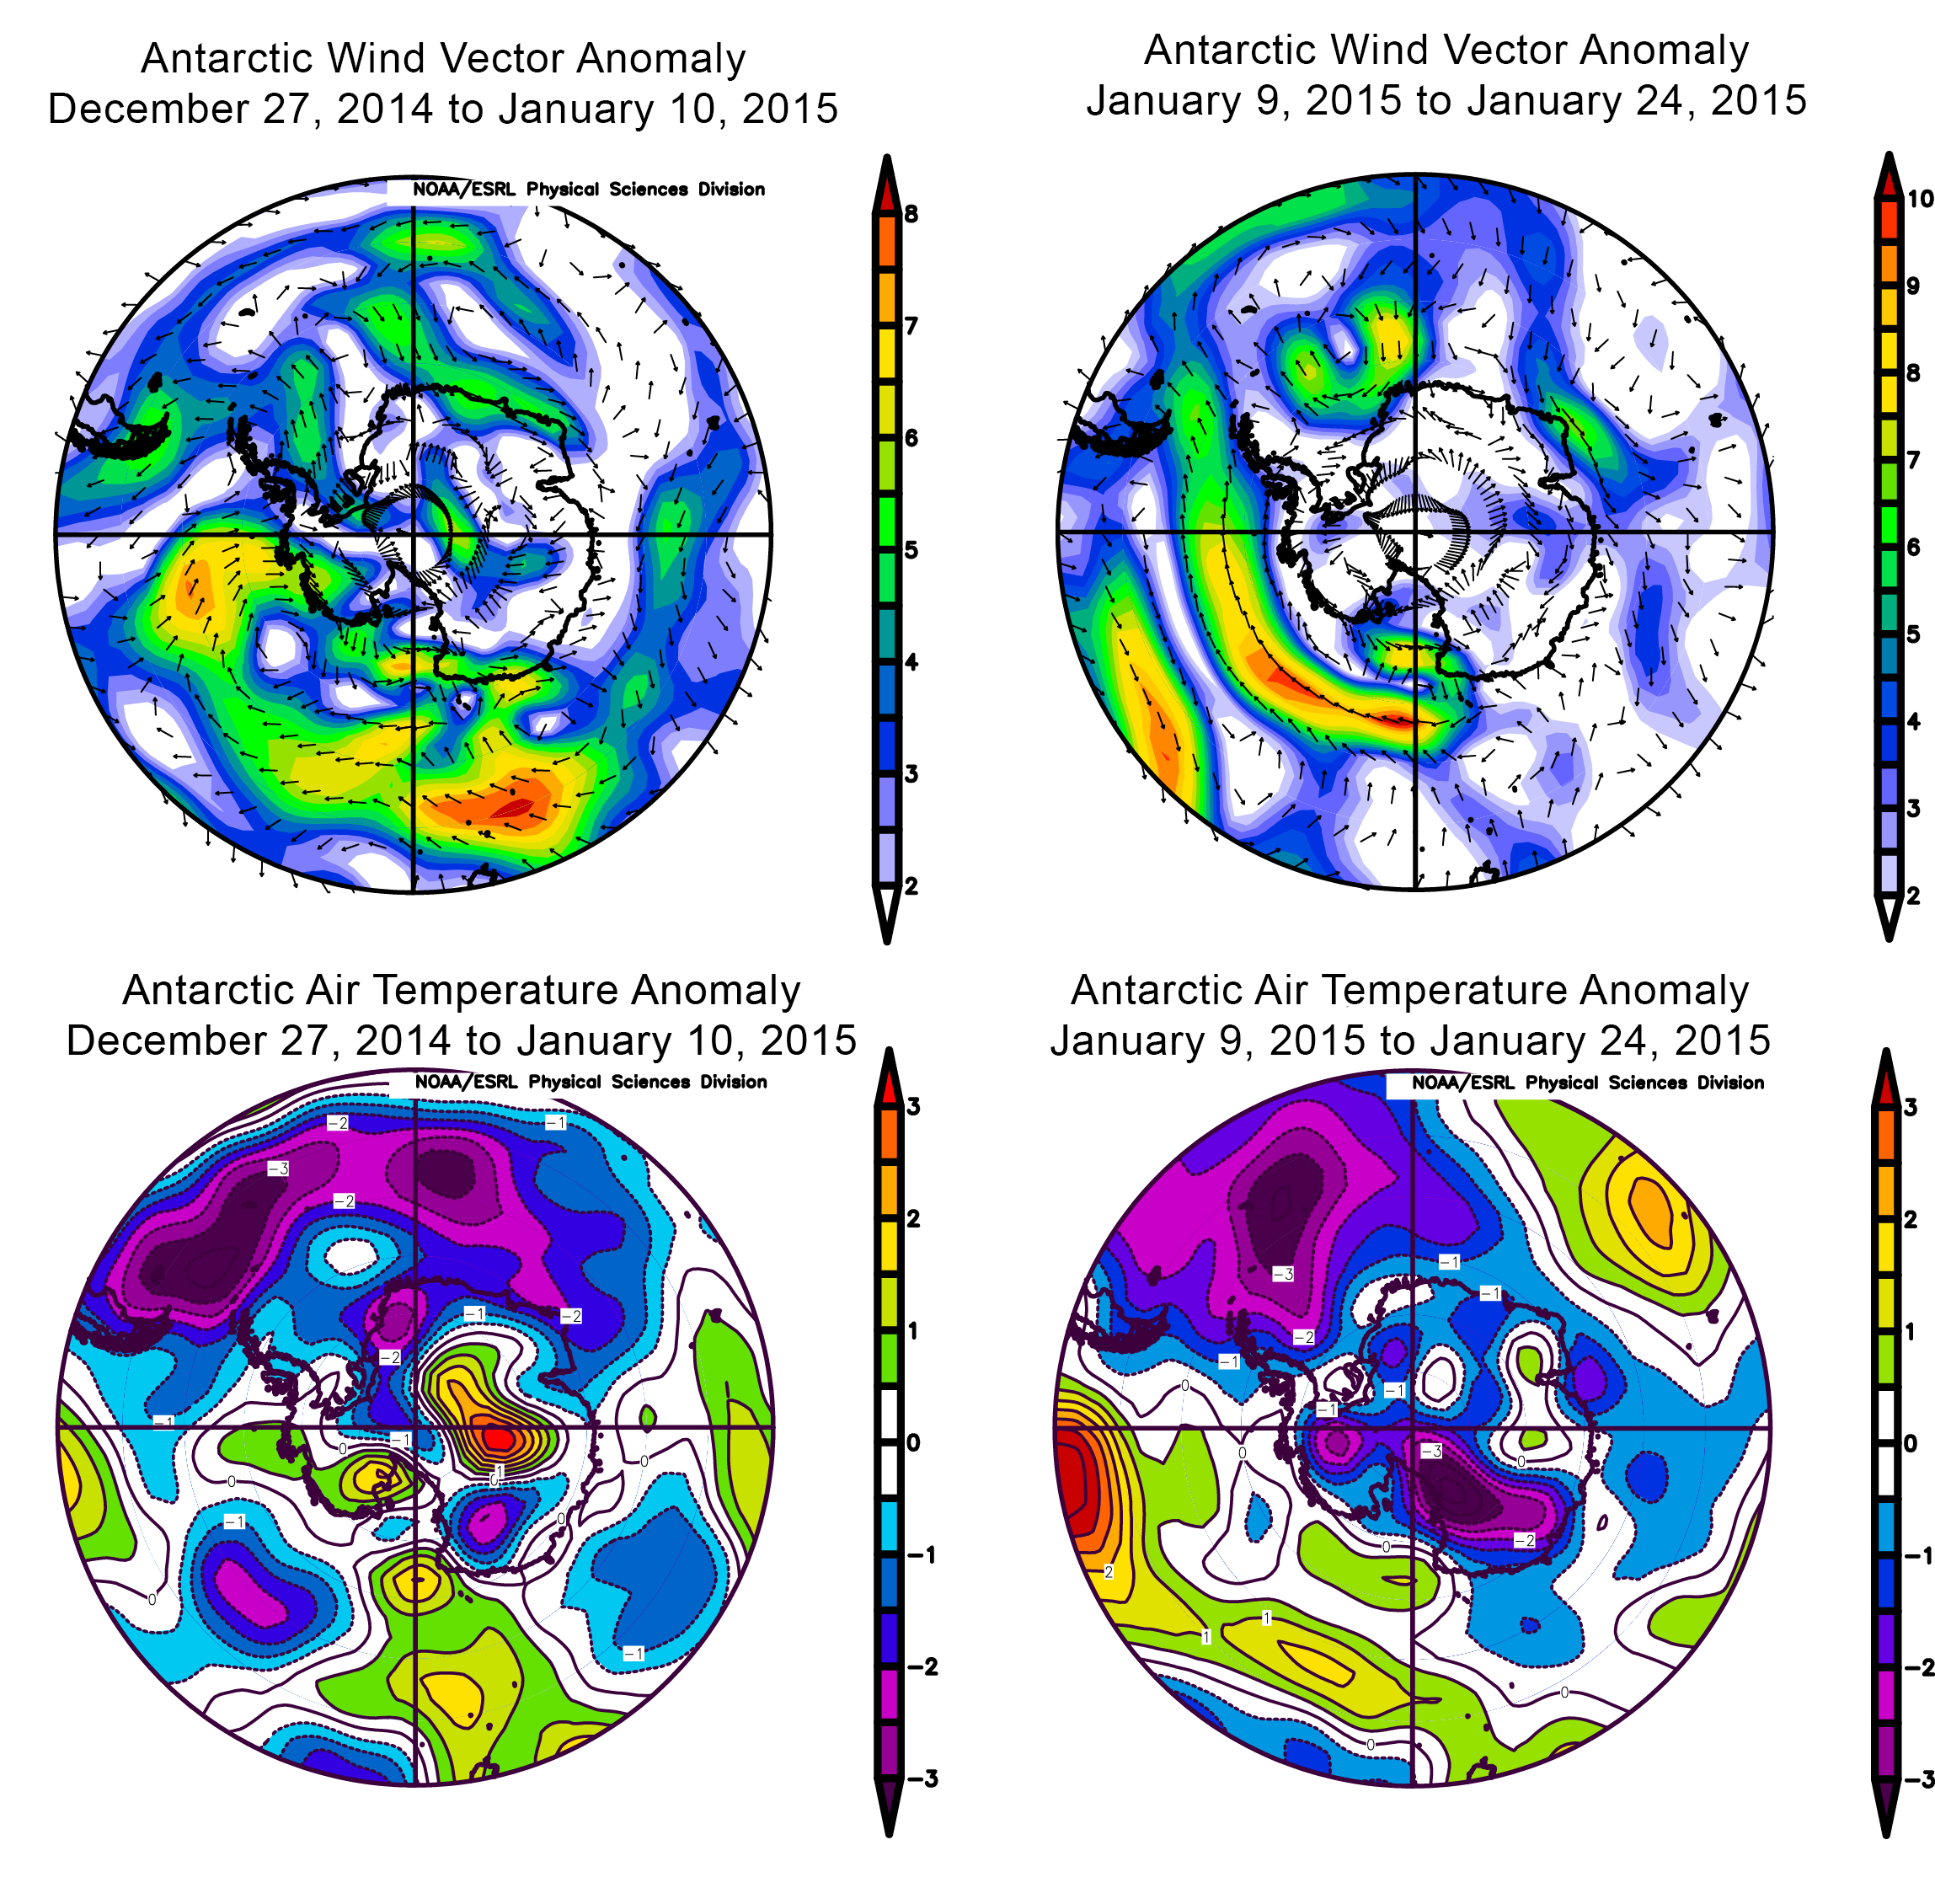
Figure 5b. These images show Antarctic wind vector (top) and air temperature (bottom) anomalies for late December 2014 to early January 2015, compared to 1981 to 2010 averages.
Credit: NOAA ESRL Physical Sciences Division
High-resolution image
Weather conditions during late December and January help to explain these changes. In the northern Weddell Sea, southerly winds (more so than average) and cool conditions relative to the 1981 to 2010 average prevailed for late December and all of January, and sea ice there remained high relative to long-term averages for the month. For the northern Ross Sea, air temperatures at the 925 hPa level have been slightly above average for the entire period, but winds in this area shifted during January, from southerly (pushing ice outward) to northwesterly. The combination of northerly winds and slightly warm conditions seems to have reduced the ice extent anomaly significantly in this sector.
Further reading
Smedsrud, L.H., I. Esau, R. B. Ingvaldsen, T. Eldevik, P. M. Haugan, C. Li, V. S. Lien, A. Olsen, A. M. Omar, O. H. Otterå, B. Risebrobakken, A. B. Sandø, V. A. Semenov, and S. A. Sorokina. 2013. The role of the Barents Sea in the Arctic climate system.
Reviews of Geophysics, 51, doi:10.1002/rog.20017.
Årthun, M., T. Eldevik, L. H. Smedsrud, Ø. Skagseth, and R. B. Ingvaldsen. 2012.
Quantifying the Influence of Atlantic Heat on Barents Sea Ice Variability and Retreat. Journal of Climate, Volume 25, pp. 4736-4743, doi:10.1175/JCLI-D-11-00466.1.
Schauer, U. and A. Beszczynska-Möller. 2009. Problems with estimation and interpretation of oceanic heat transport – conceptual remarks for the case of Fram Strait in the Arctic Ocean, Ocean Sci., 5, 487–494.

