While the eastern half of the United States has dealt with a cold and snowy winter, temperatures in the Arctic have been distinctly higher than average. The warm conditions have led to a slower than average expansion of the winter ice cover. Less ice also contributes to higher air temperatures by allowing transfer of heat from the relatively warmer ocean. The annual maximum in sea ice extent is expected to occur sometime this month.
Overview of conditions

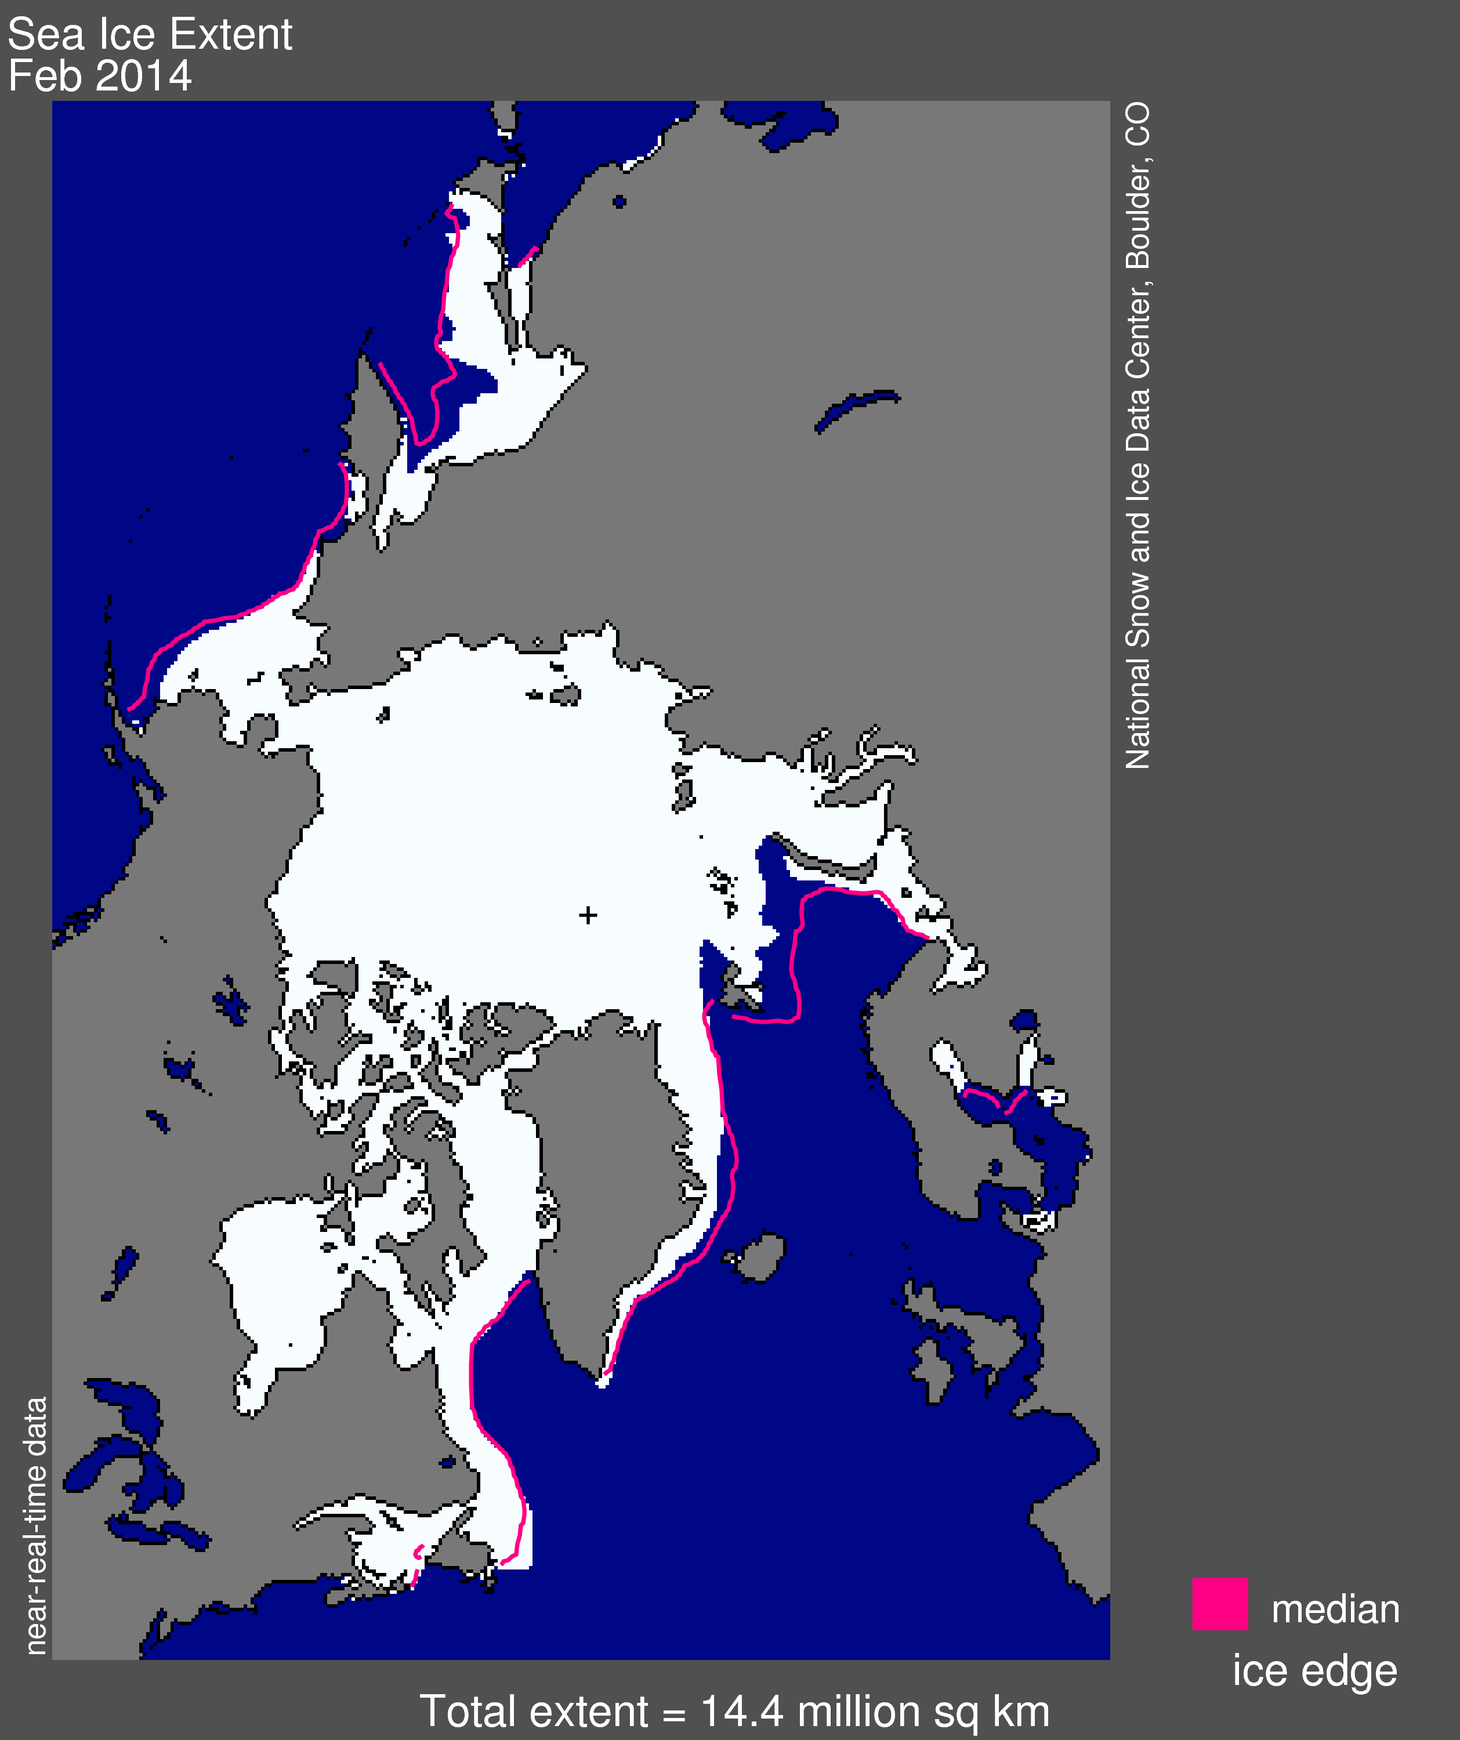
Figure 1. Arctic sea ice extent for February 2014 was 14.44 million square kilometers (5.58 million square miles). The orange line shows the 1981 to 2010 median extent for that month. The black cross indicates the geographic North Pole. Sea Ice Index data. About the data
Credit: National Snow and Ice Data Center
High-resolution image
Arctic sea ice extent in February 2014 averaged 14.44 million square kilometers (5.58 million square miles). This is the fourth lowest February ice extent in the satellite data record, and is 910,000 square kilometers (350,000 square miles) below the 1981 to 2010 average. The lowest February in the satellite record occurred in 2005.
Overall, sea ice grew slowly through the month of February. There were periods of declining ice, likely related to changes in ice motion. Bering Sea ice cover has been below average throughout winter, in contrast to the last several winters. Ice extent also remains below average in the Barents Sea and the Sea of Okhotsk, helping to keep the Arctic ice extent two standard deviations below the 1981 to 2010 average.
Conditions in context

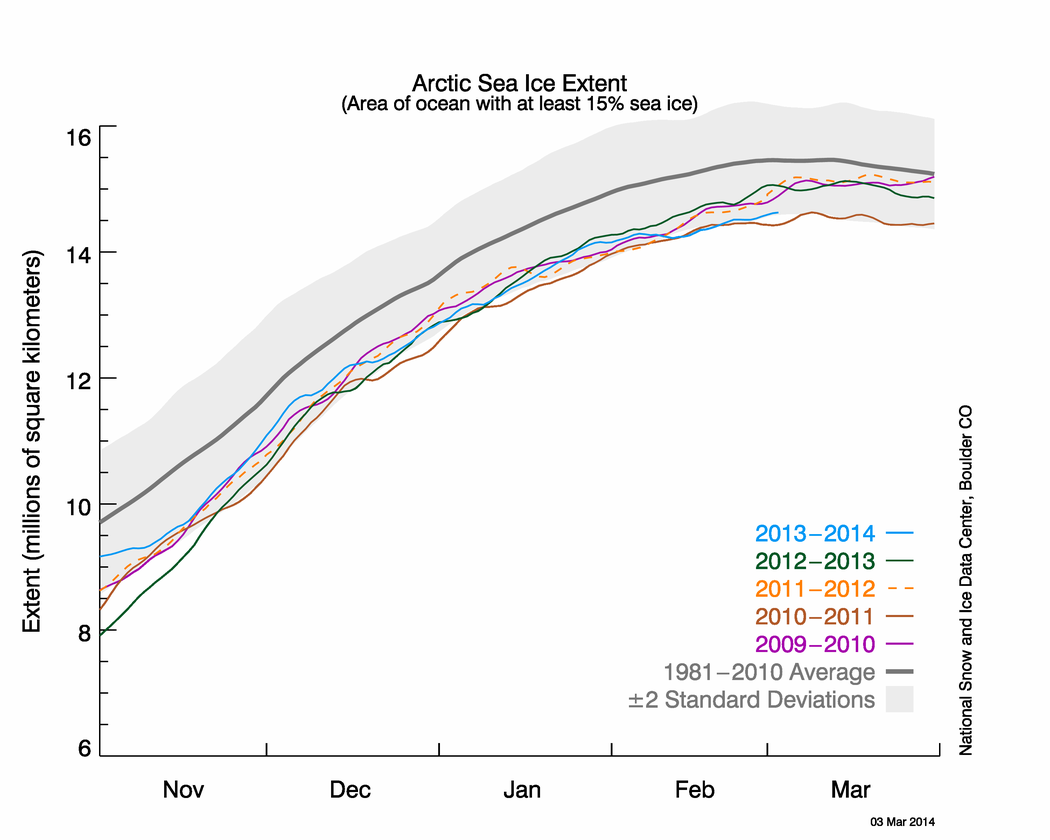
Figure 2. The graph above shows Arctic sea ice extent as of March 3, 2014, along with daily ice extent data for five previous years. 2013-2014 is shown in blue, 2012-2013 in green, 2011-2012 in orange, 2010-2011 in brown, and 2009-2010 in purple. The 1981 to 2010 average is in dark gray. Sea Ice Index data.
Credit: National Snow and Ice Data Center
High-resolution image
Ice extent increased at an average daily rate of 14,900 square kilometers (5,750 square miles) per day through the month of February. This is about 25% slower than the 1981 to 2010 February average rate of 20,300 square kilometers (7,840 square miles) per day. As the maximum extent approaches, the daily rate of ice extent growth is expected to slow.
While the eastern half of the U.S. has suffered through a cold and sometimes snowy winter, conditions in the Arctic have been warmer than average. The Arctic in winter is still a very cold place and temperatures at the 925 mb level in the central Arctic averaged -25 to -15 degrees Celsius (-13 to 5 degrees Fahrenheit); however, this was 4 to 8 degrees Celsius (7 to 14 degrees Fahrenheit) above average for the month. The Arctic Oscillation settled into a near-neutral mode for February after swinging from a strong positive mode in December to a negative mode in January.
February 2014 compared to previous years
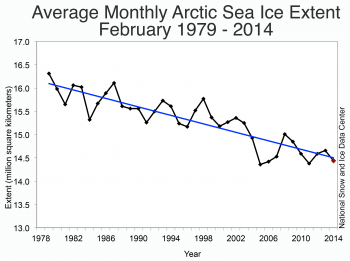
Figure 3. Monthly February ice extent for 1979 to 2014 shows a decline of -3.0% per decade per decade relative to the 1981 to 2010 average.
Credit: National Snow and Ice Data Center
High-resolution image
The sea ice extent trend through February 2014 is -3.0% per decade relative to the 1981 to 2010 average, a rate of -46,100 square kilometers (-17,800 square miles) per year. Unlike the summer, where ice loss has accelerated over the past decade, winter month trends have been fairly consistent.
The two Bs of the Arctic: Barents and Bering
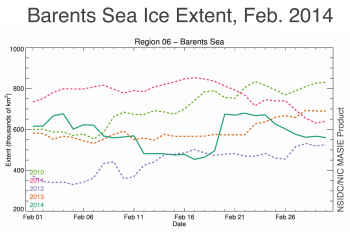
Figure 4a. Barents Sea ice extent during February from the NSIDC Multisensor Analyzed Sea Ice Extent (MASIE) for the years 2010 through 2014. MASIE is produced daily by the U.S. National Ice Center based on human analysis of a variety of available satellite imagery.
Credit: National Snow and Ice Data Center and the National Ice Center
High-resolution image

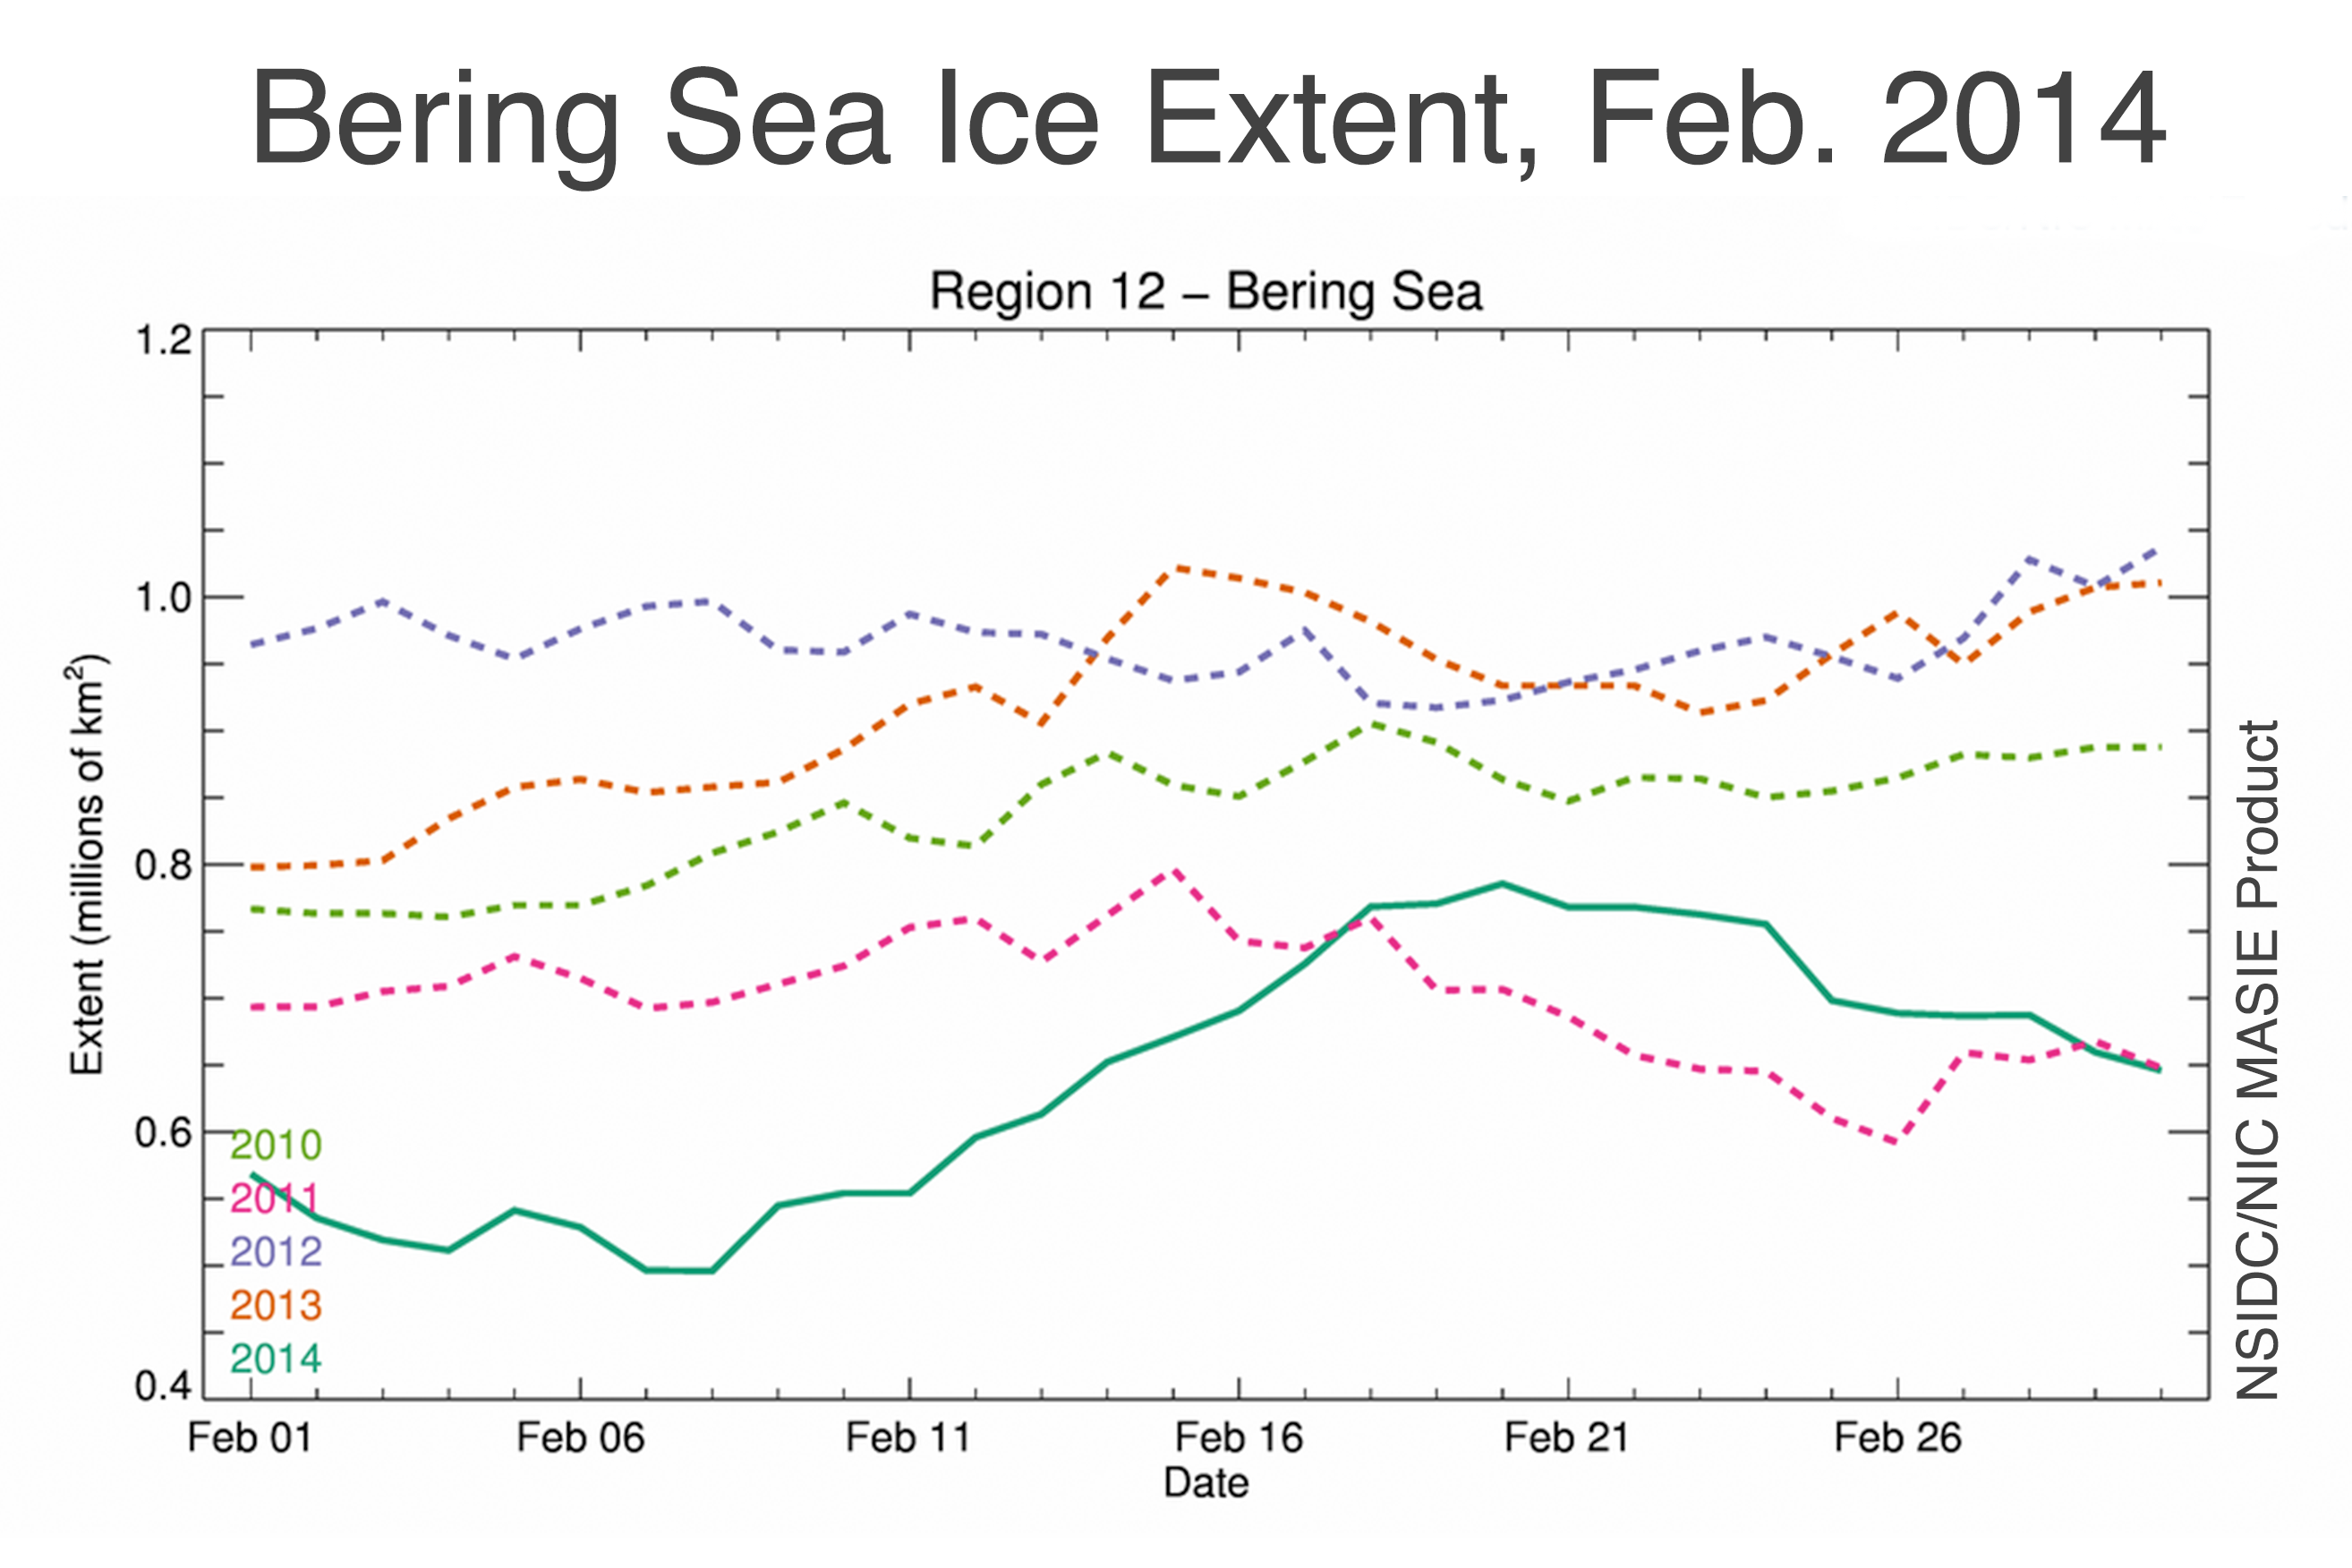
Figure 4b. Bering Sea ice extent during February from the NSIDC Multisensor Analyzed Sea Ice Extent (MASIE) for the years 2010 through 2014. MASIE is produced daily by the U.S. National Ice Center based on human analysis of a variety of available satellite imagery.
Credit: National Snow and Ice Data Center and the National Ice Center
High-resolution image
The Barents Sea has experienced consistently low extents, particularly in winter, and this year has been no different. While the Barents and Kara seas normally have close to 2 million square kilometers (772,000 square miles) of ice in February, recent years have seen 500,000 square kilometers (193,000 square miles) of ice extent or lower. This year, the Kara Sea is near average, but the Barents Sea remains low (Figure 4a). Unlike other regions in the Arctic, longer records of Barents Sea ice extent exist from records of fishing, whaling, and other activities. A recent paper (Miles et al., 2013) examined these records, along with paleoproxy data, to examine extent over the past four hundred years. They found a 60- to 90-year cycle in Barents and Greenland seas ice extent related to the Atlantic Multidecadal Oscillation (AMO); the AMO is a basin-wide cycle of sea surface temperature variability similar to the El Niño and La Niña cycles in the Pacific, but varying over much longer periods. This research shows that in addition to the warming trend in the Arctic, some sea ice regions are likely also responding to natural climate variability.
In contrast to the Barents, the Bering Sea ice has had higher than average extent in recent years. However this year is different; Bering Sea ice extent has been below average through much of the winter. During mid-February, extent increased to a higher level, as seen in Multisensor Analyzed Sea Ice Extent (MASIE) data (Figure 4b), before a slight decline at the end of the month. This is in contrast with recent years in the Bering that have seen very high extents, even record levels .
The Bering Sea consists exclusively of seasonal ice with a large marginal ice zone where new, thin ice dominates. Sea ice in this region is quite sensitive to changes in temperatures and, particularly, winds. Cold winds from the north advect ice southward and aid new ice growth. Warm winds from the south impede ice growth and push the ice northward, reducing extent in the region. Recent winters have been characterized by predominantly north winds. This year represents a change with more zonal, east to west, winds in January and February. As with the Barents Sea, the Bering may be responding to climate variability, including the Pacific Decadal Oscillation, though the links are complex (Bond et al., 2003).
Winter and spring ice in the Bering Sea is of high importance to people living in the region, such as walrus hunters who go out on the ice or in boats during spring and early summer. Because ice conditions are so important, analyses and forecasts, such as those provided by the SEARCH Sea Ice for Walrus Outlook (SIWO), are particularly valuable. The SIWO program begins reporting on sea ice in late March or early April and continues through late June. The site provides sea ice imagery and analysis, reports from hunters in the field, and forecasts of future conditions. These reports are important for hunters to plan hunts and safely traverse the ice-infested waters.
References
Bond, N. A., J. E. Overland, M. Spillane, and P. Stabeno. 2003. Recent shifts in the state of the North Pacific, Geophys. Res. Lett., 30, 2183, doi:10.1029/2003GL018597, 23.
Miles, M. W., D. V. Divine, T. Furevik, E. Jansen, M. Moros, and A. E. J. Ogilvie. 2014. A signal of persistent Atlantic multidecadal variability in Arctic sea ice, Geophys. Res. Lett., 41, doi:10.1002/2013GL058084.

