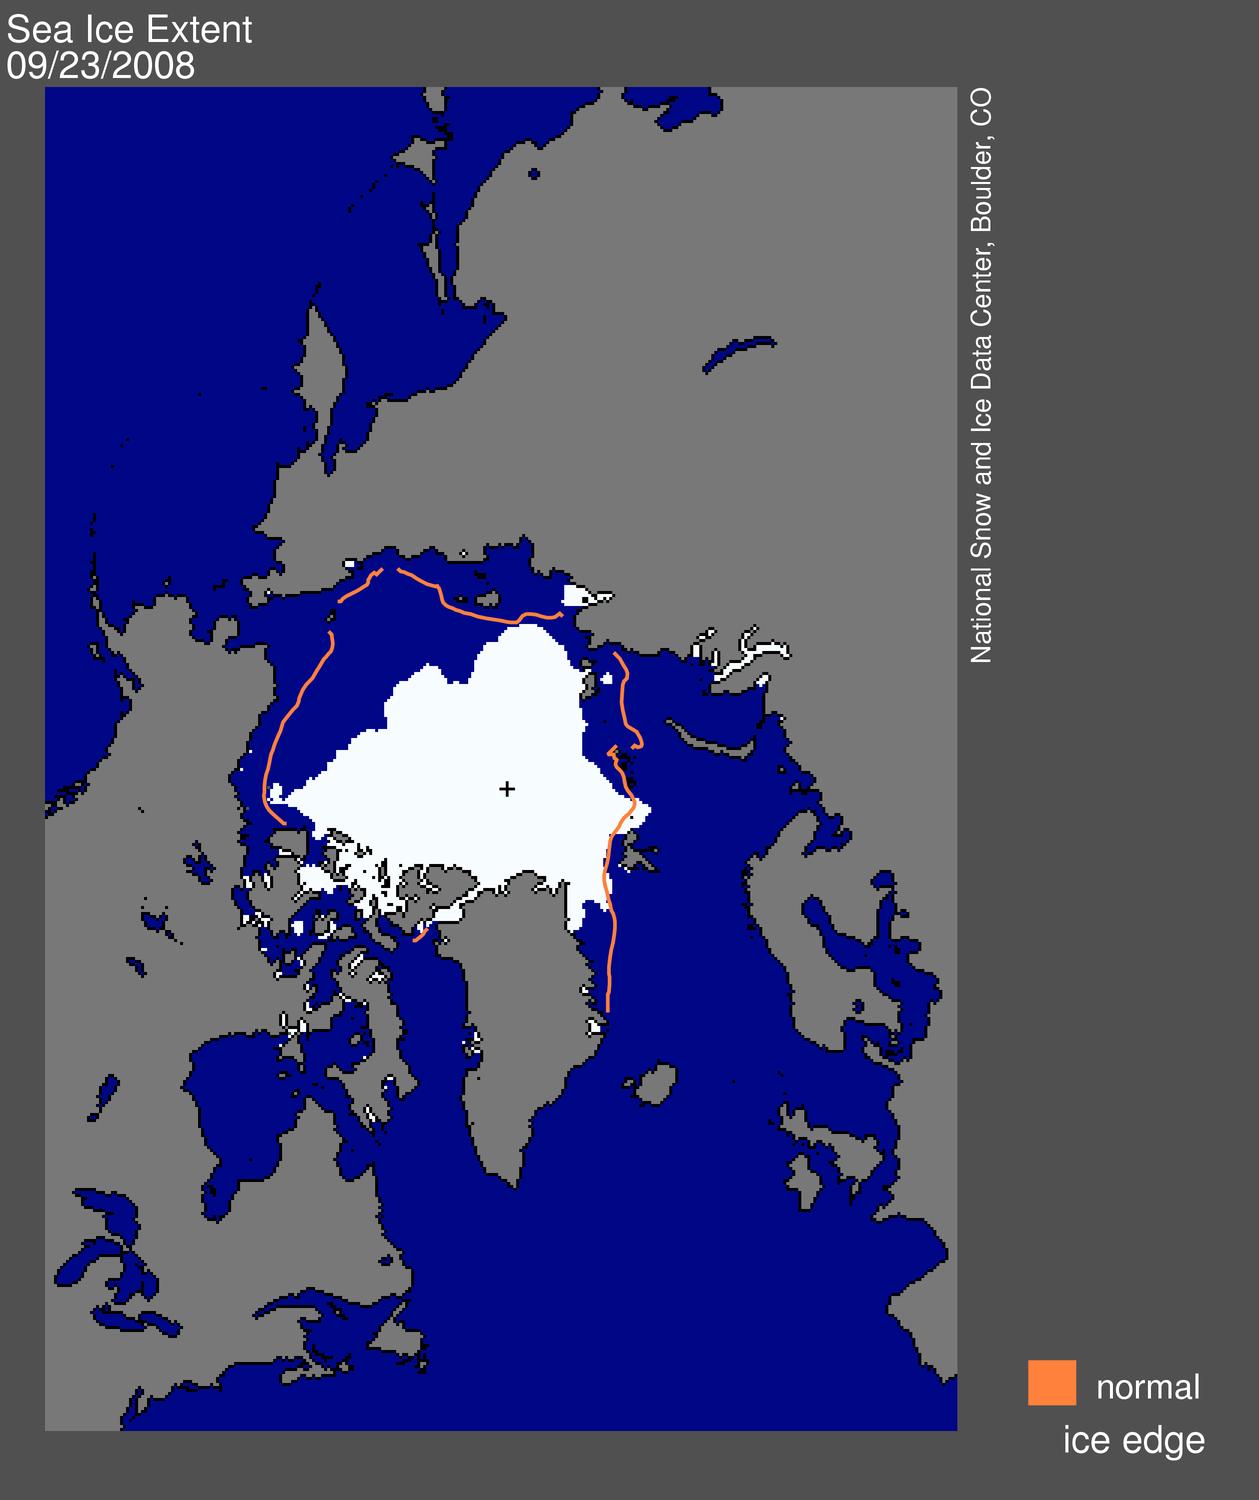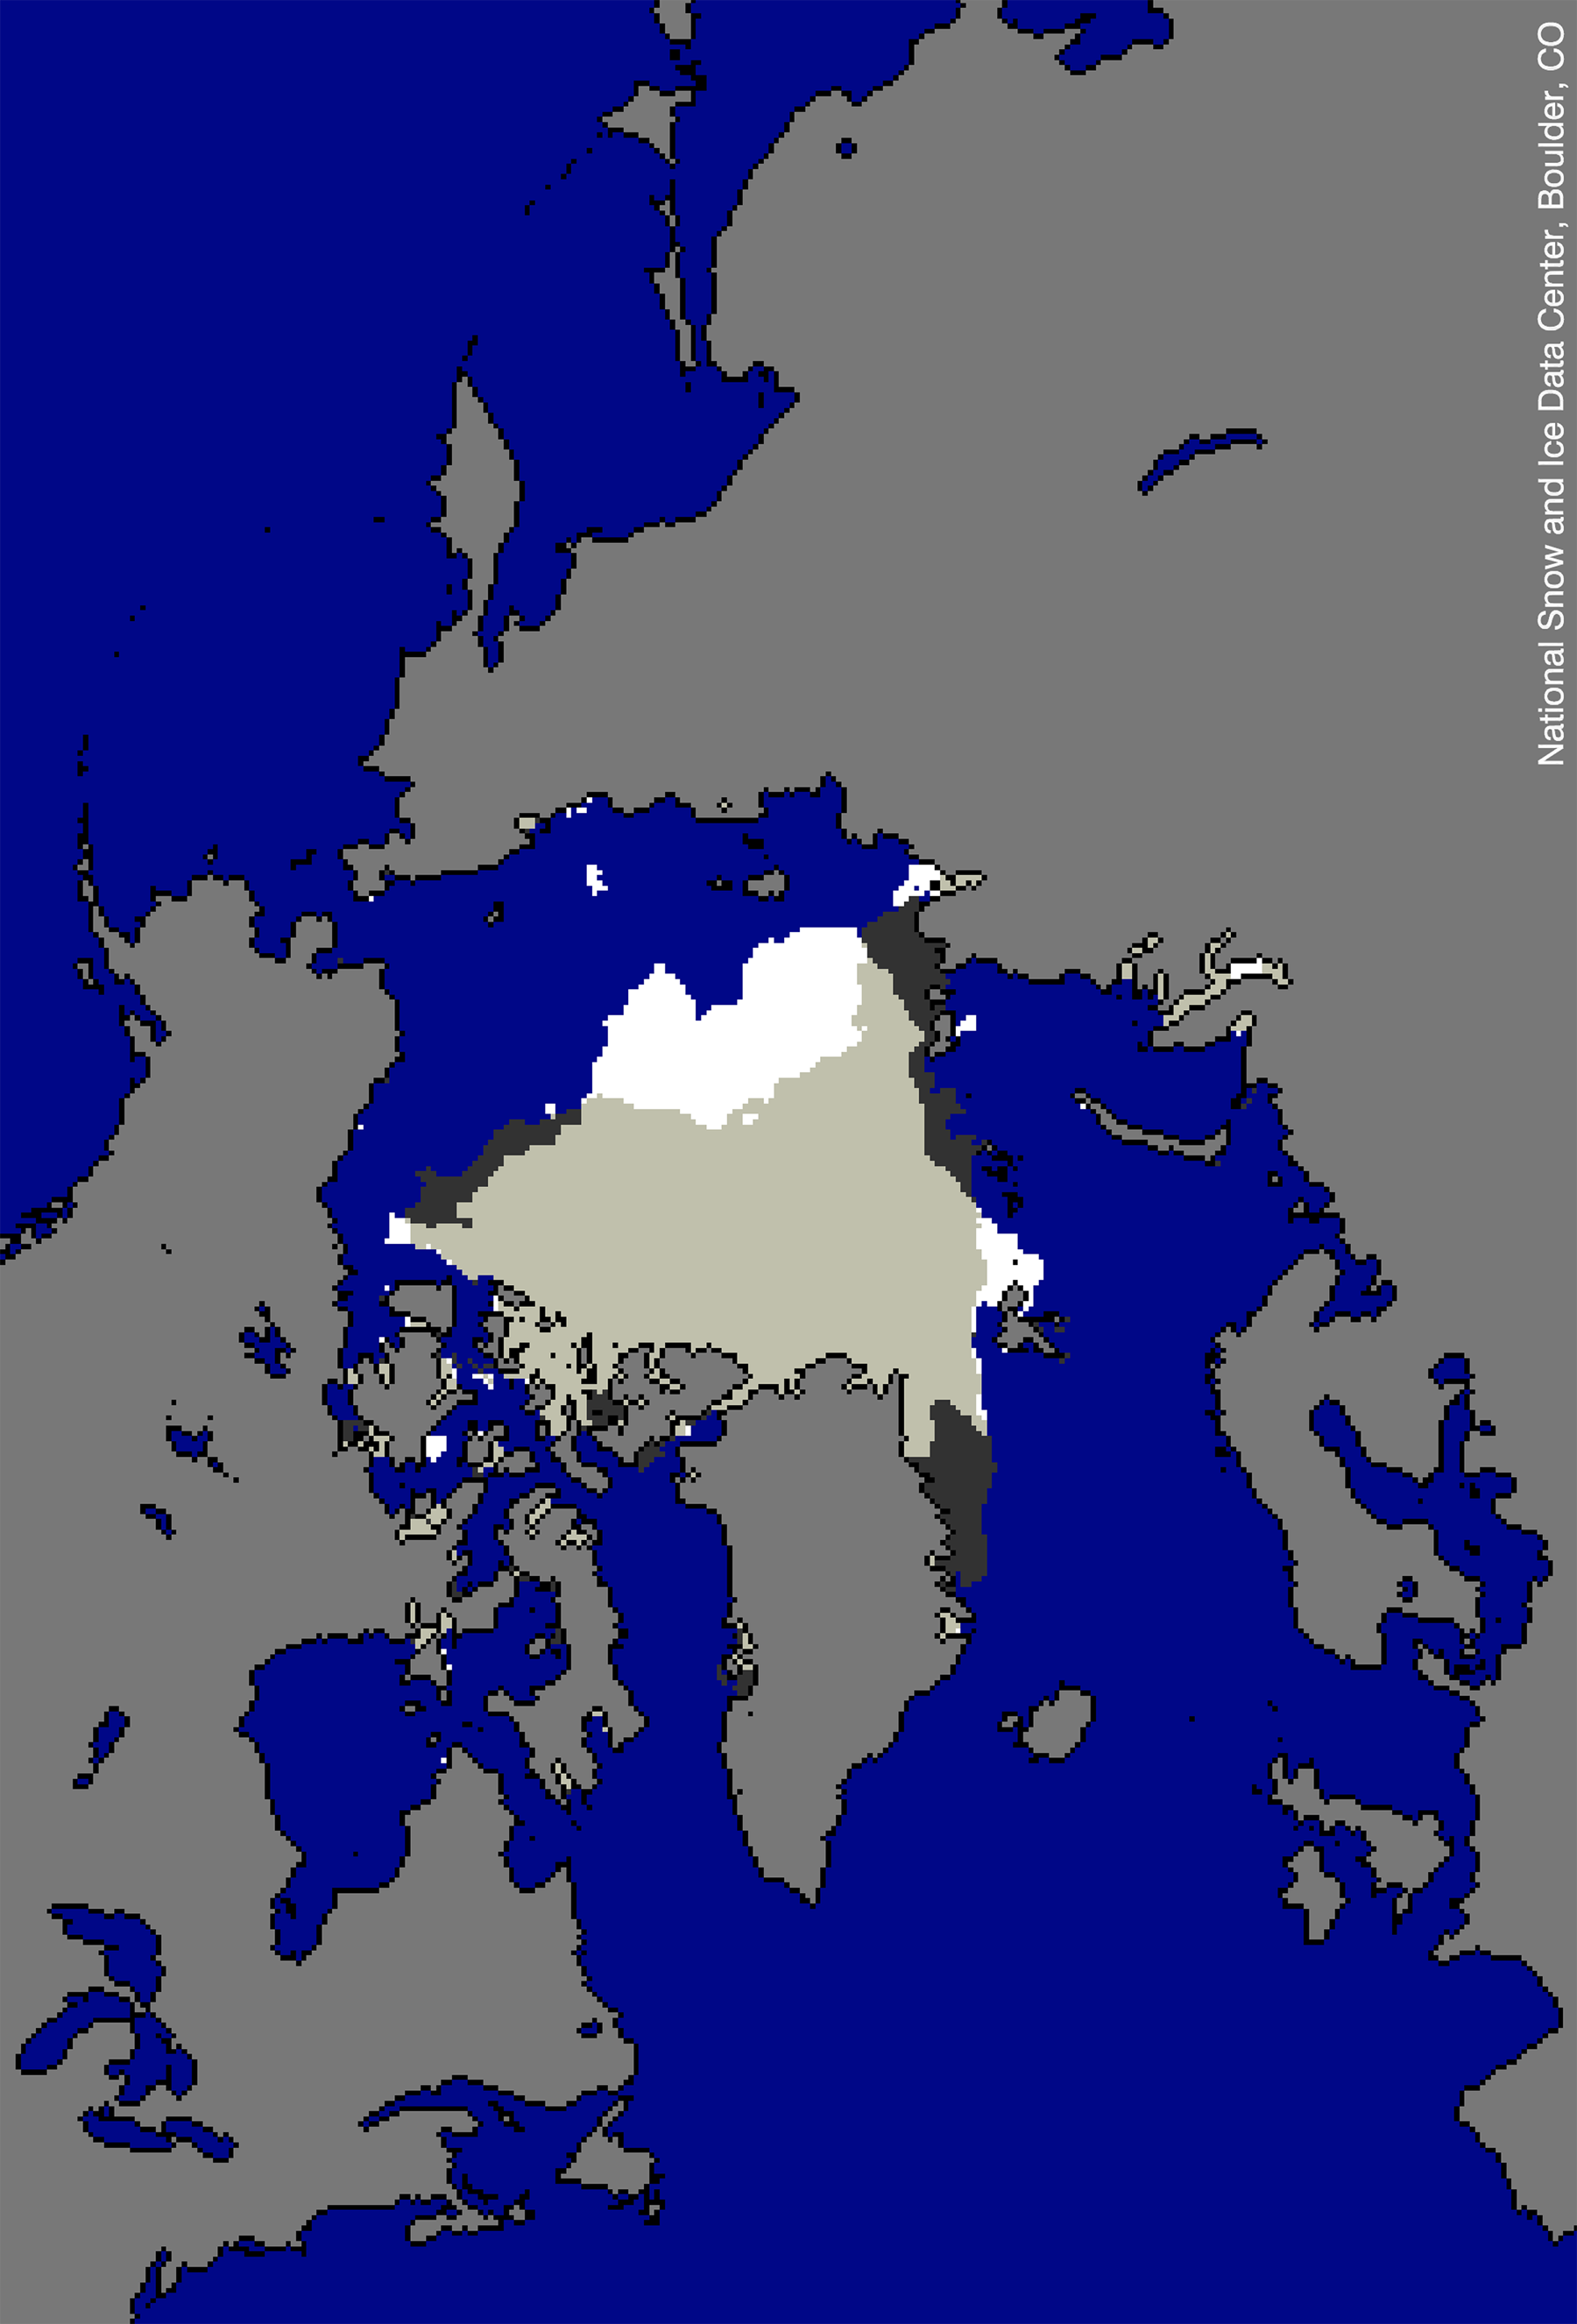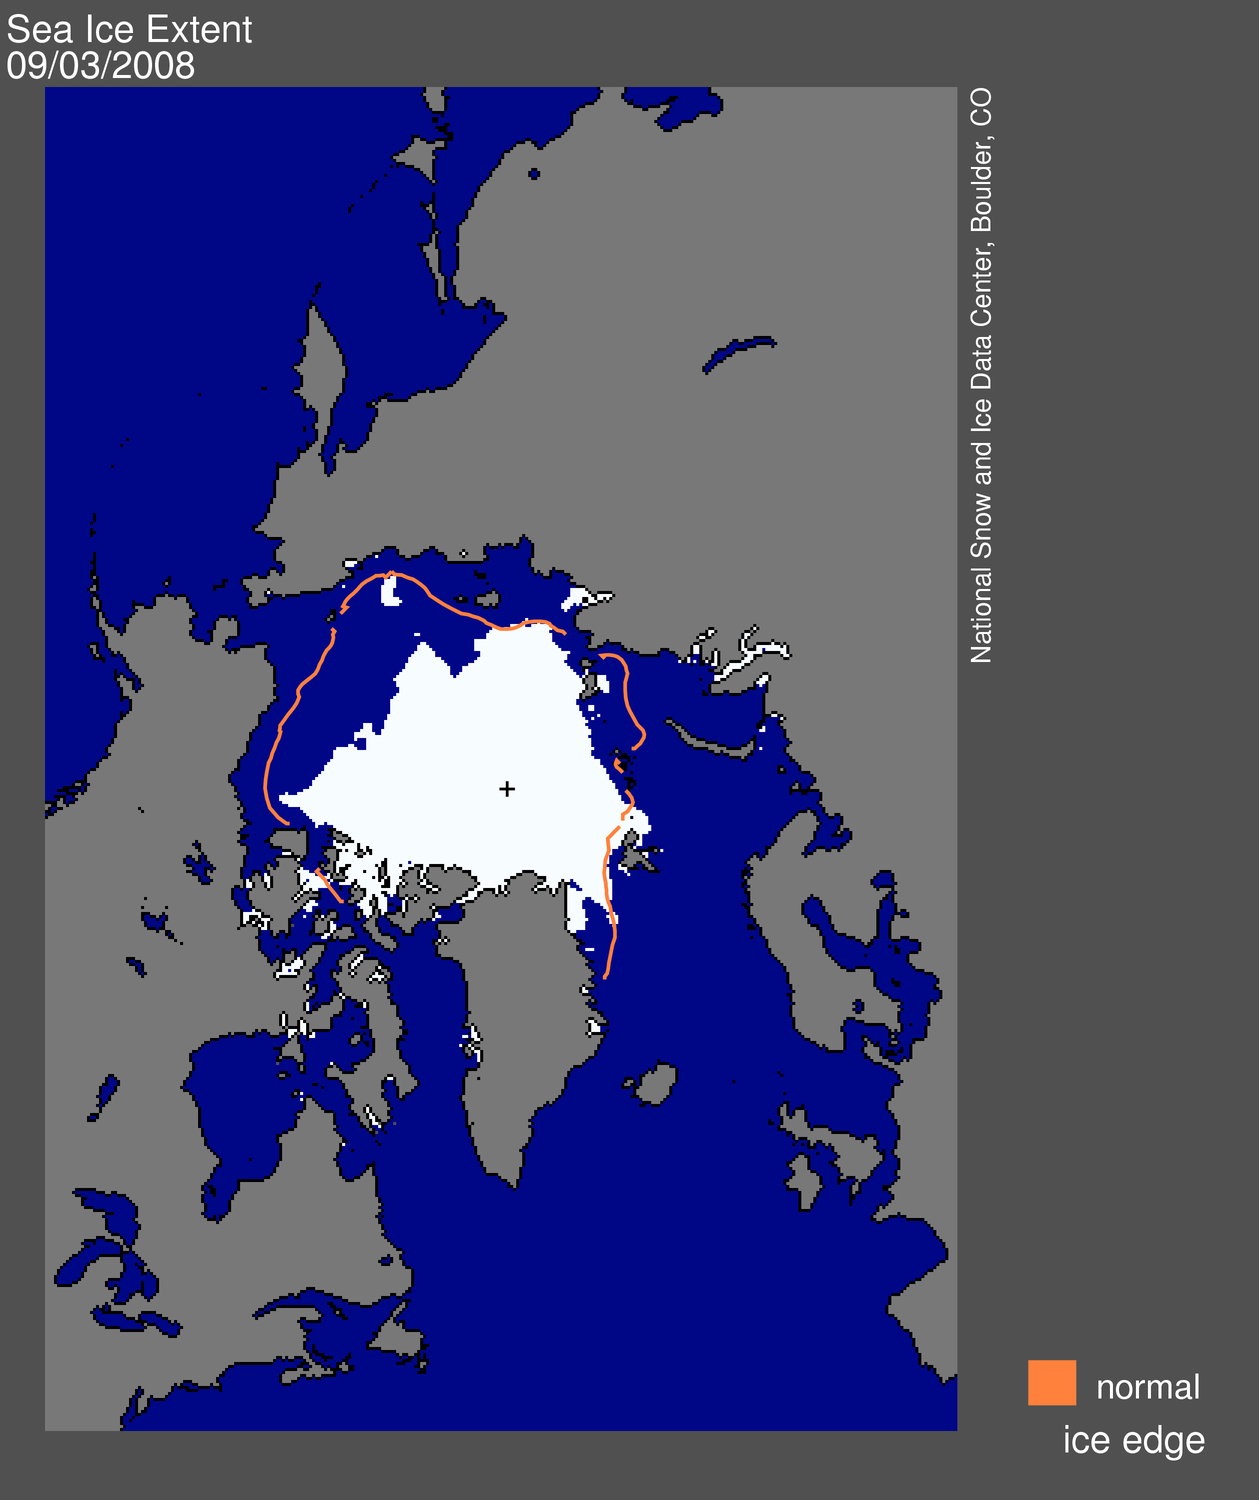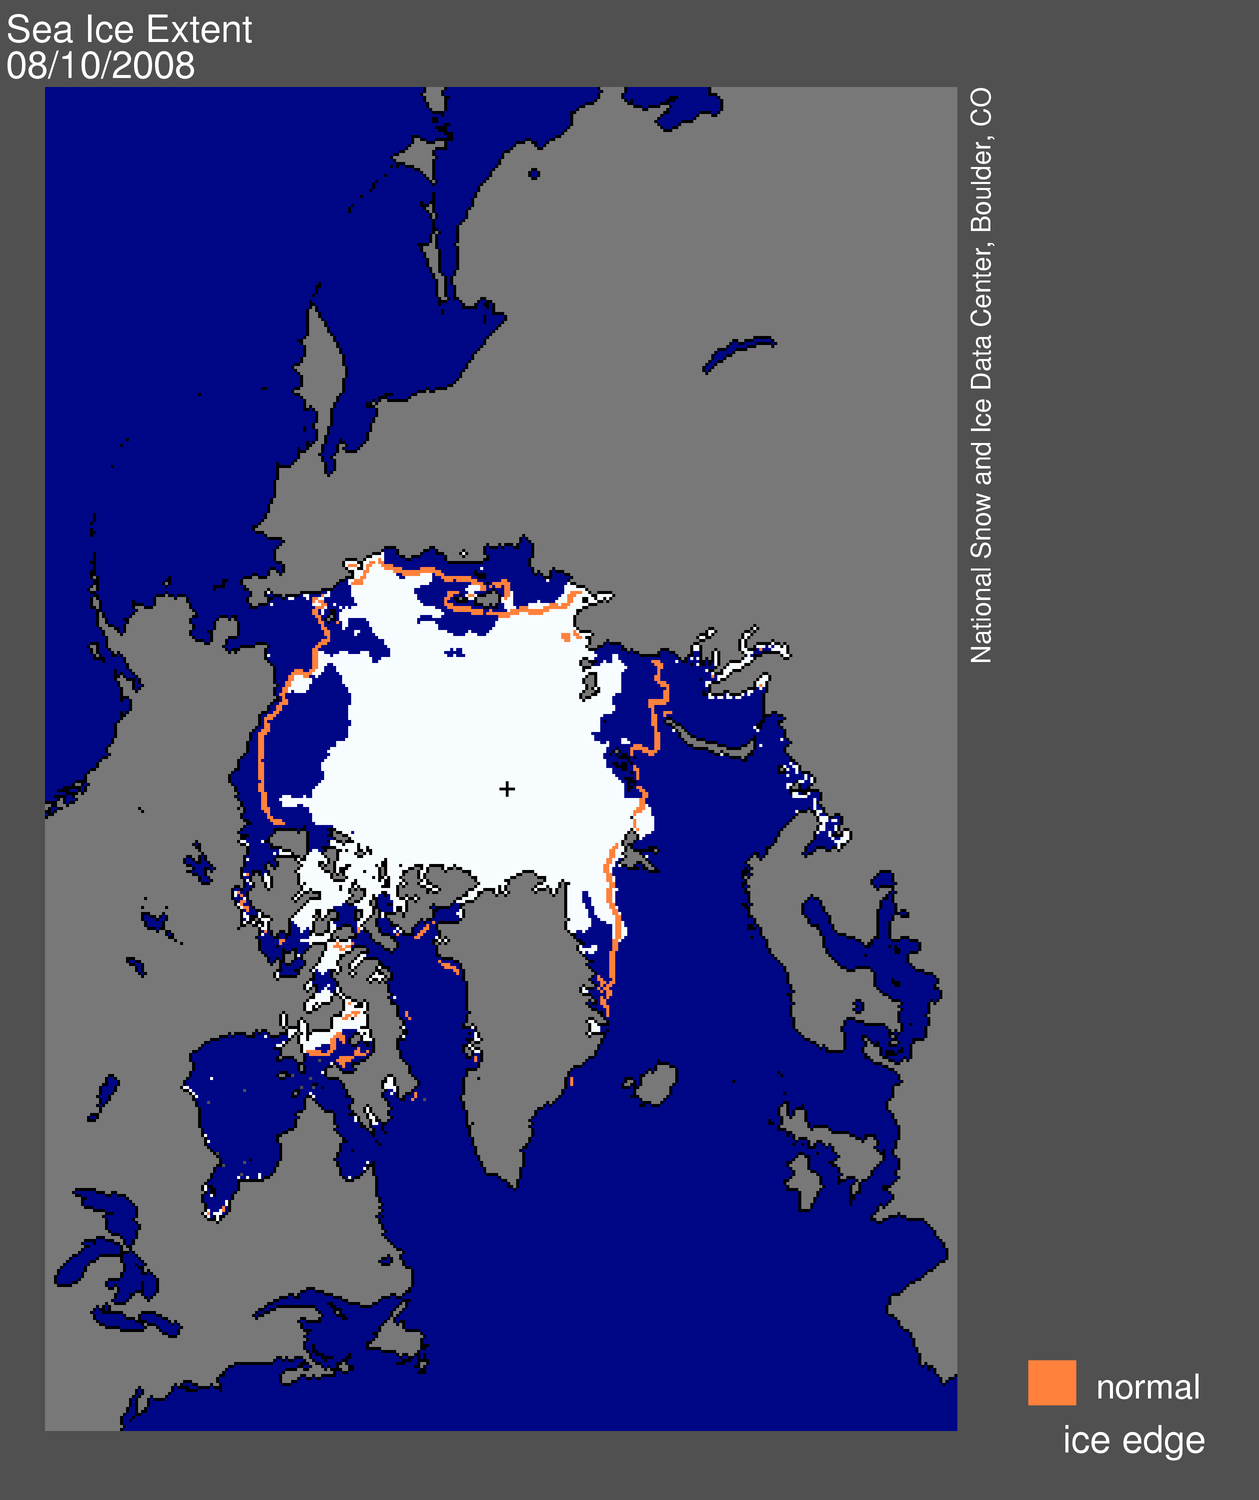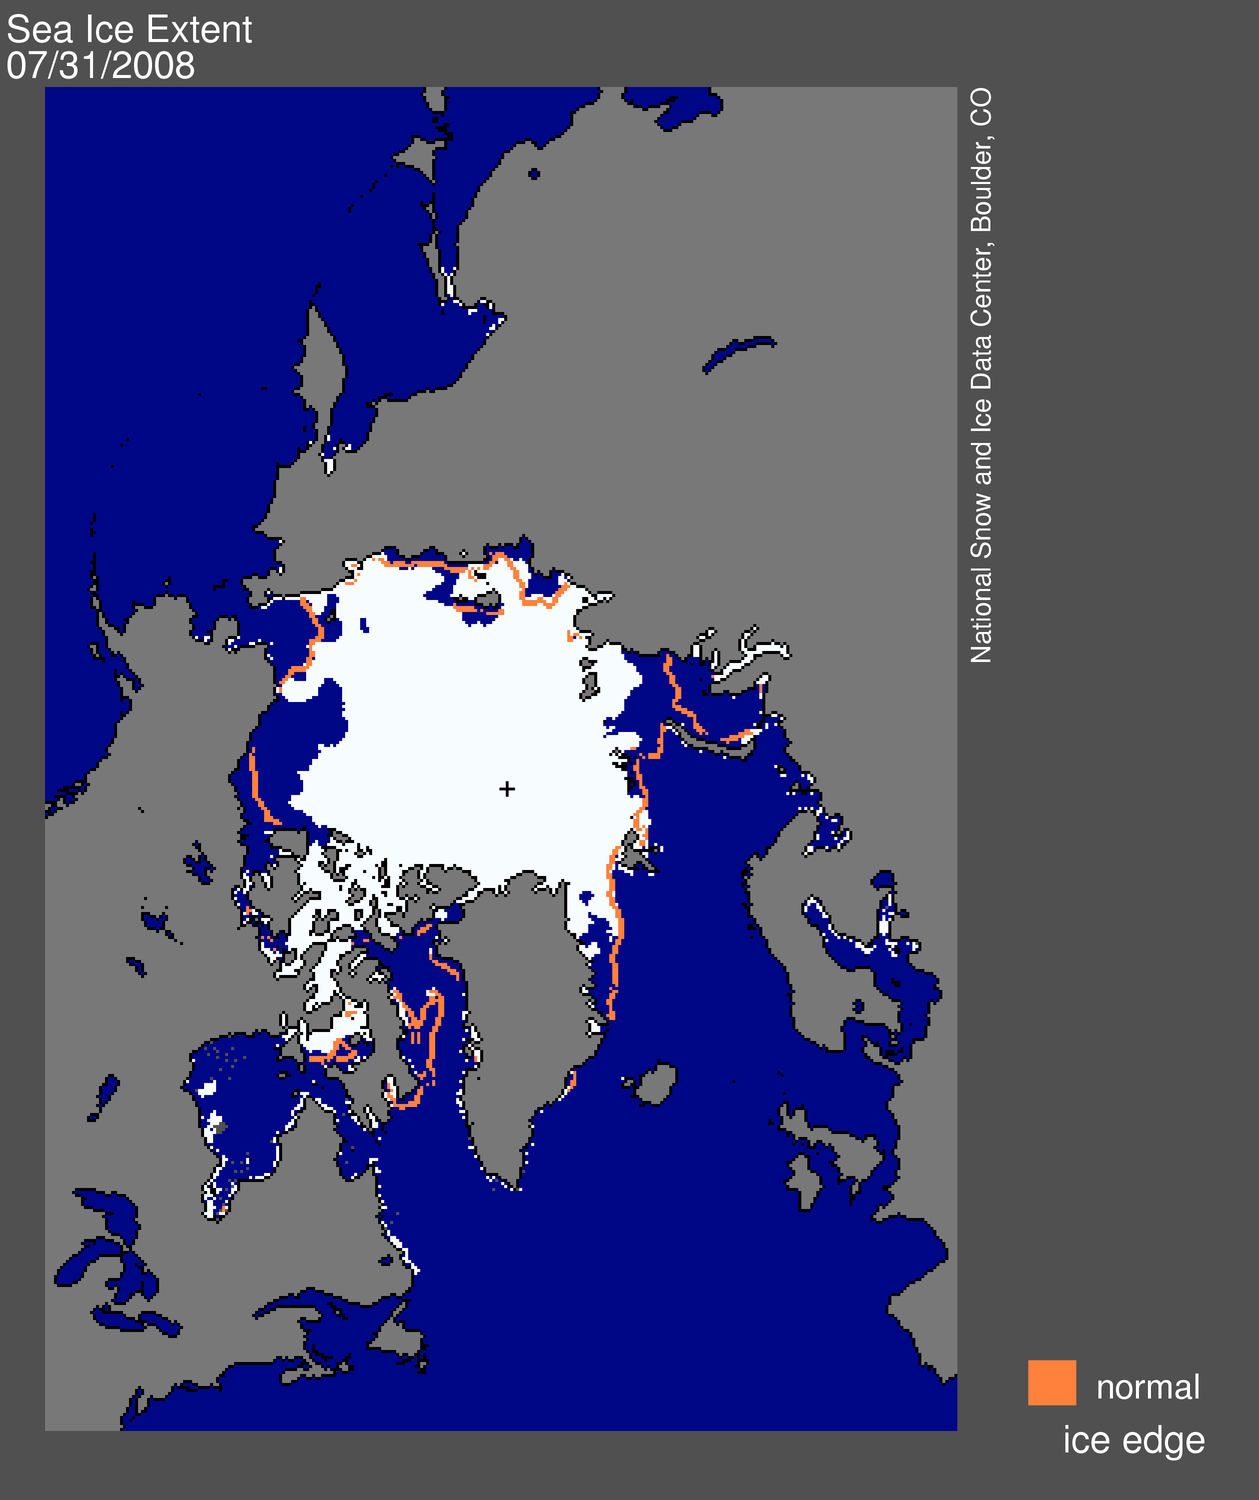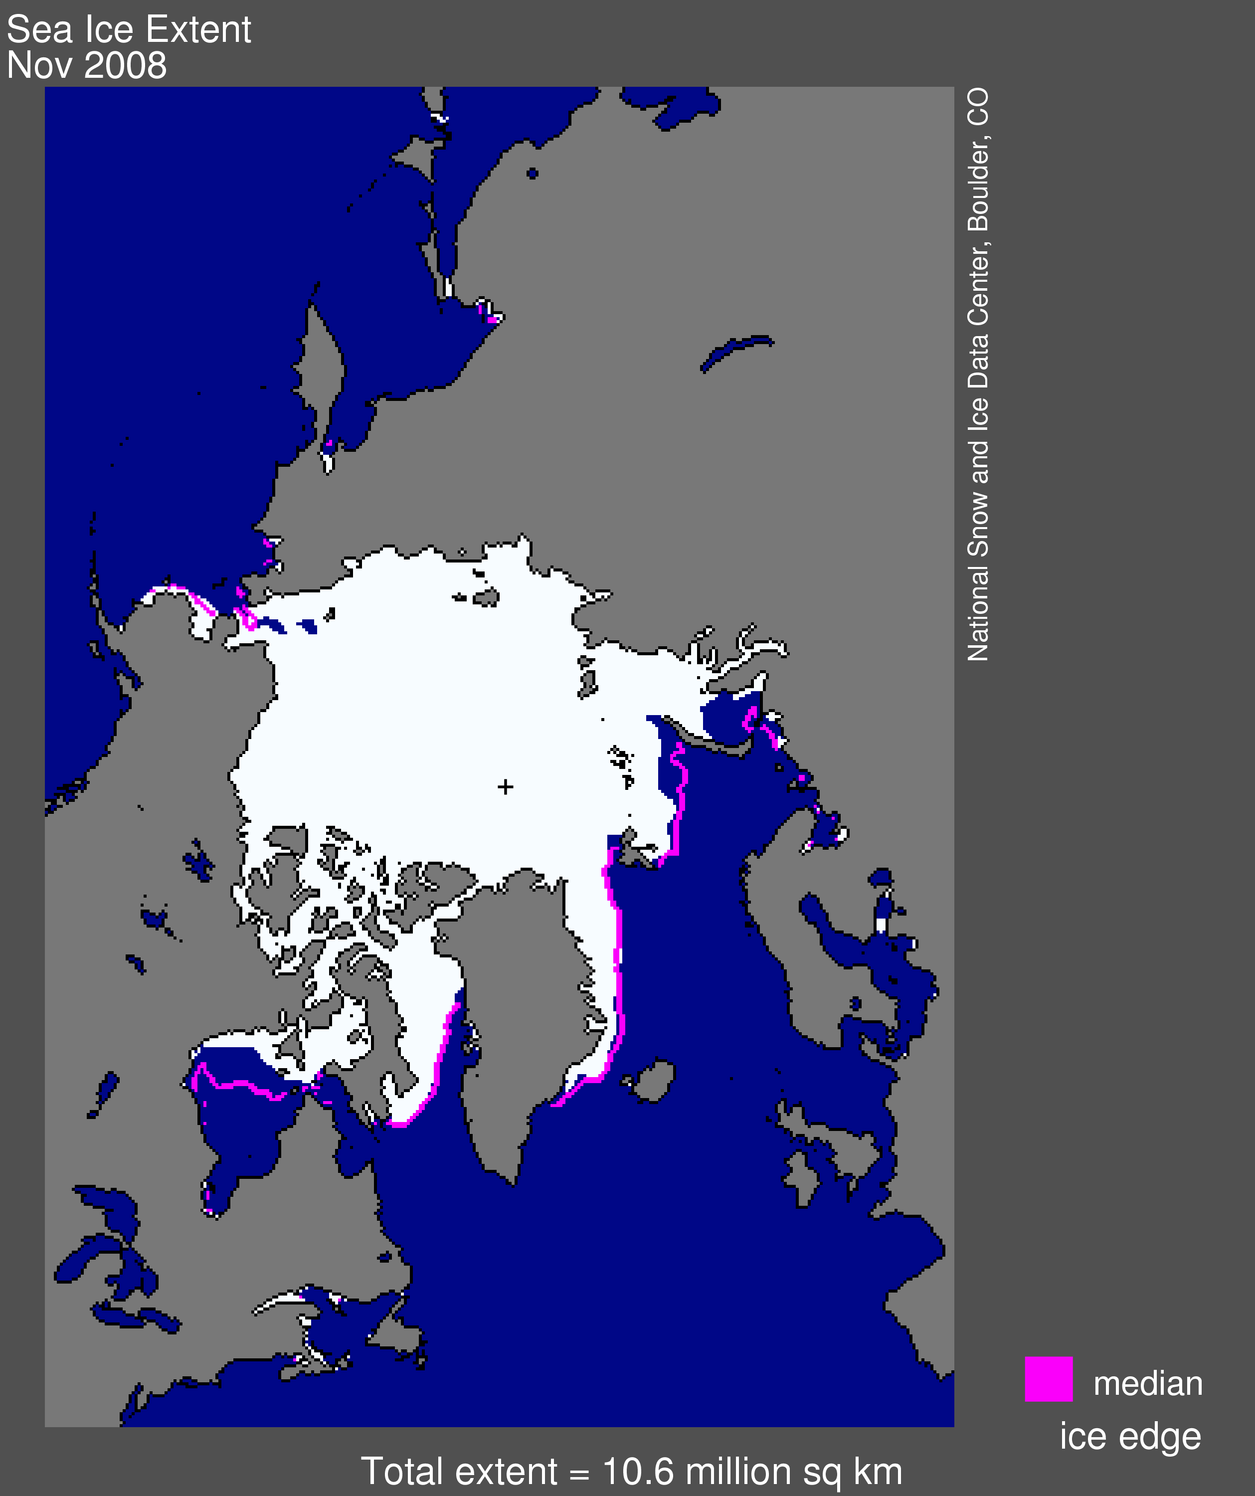
Figure 1. Arctic sea ice extent for November 2008 was 10.63 million square kilometers (4.10 million square miles). The magenta line shows the 1979 to 2000 average extent for November. The black cross indicates the geographic North Pole. Sea Ice Index data. About the data.
—Credit: National Snow and Ice Data Center
High-resolution image
Overview of conditions
Average Arctic sea ice extent for the month of November was 10.63 million square kilometers (4.10 million square miles).
Ice extent for the month of November was 580,000 square kilometers (220,000 square miles) greater than November 2007 but 680,000 square kilometers (260,000 square miles) less than the 1979 to 2000 November average.
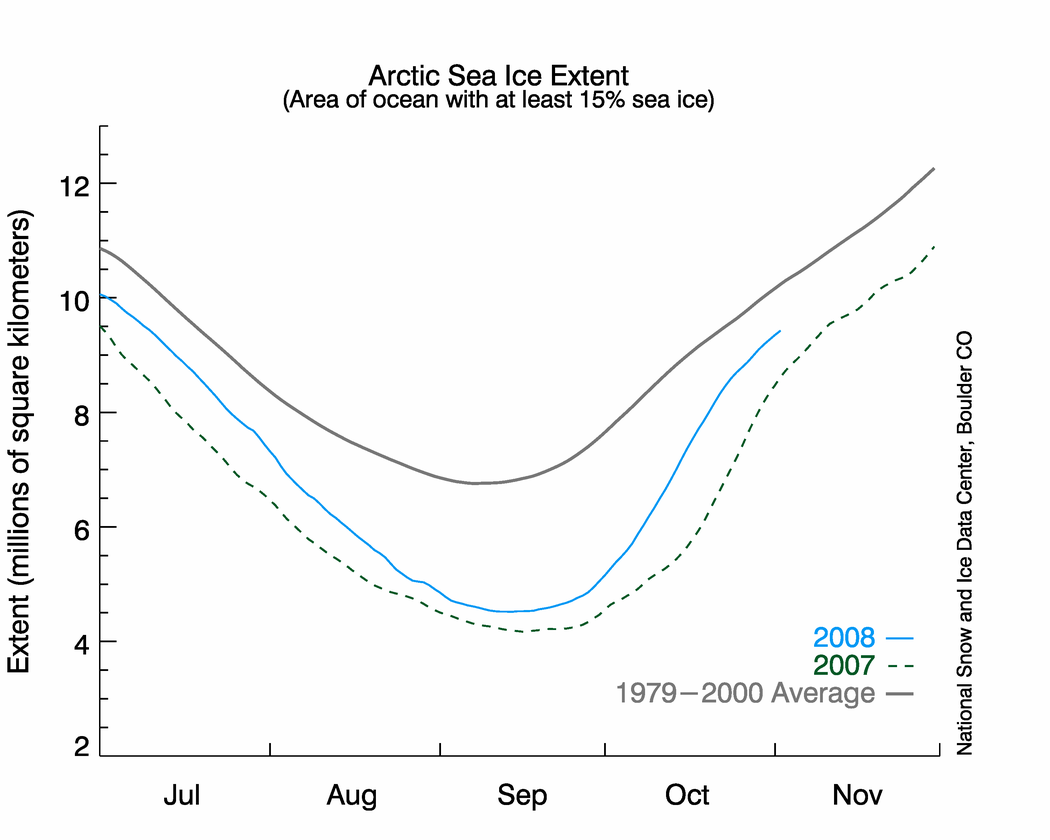
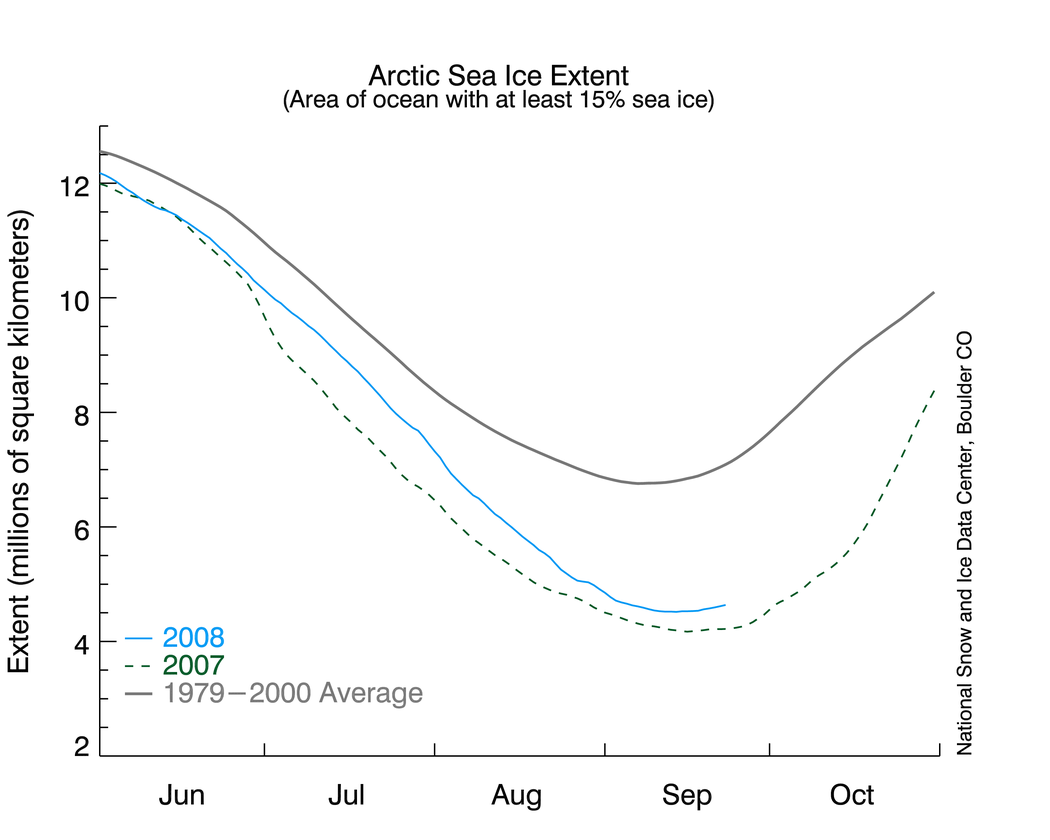
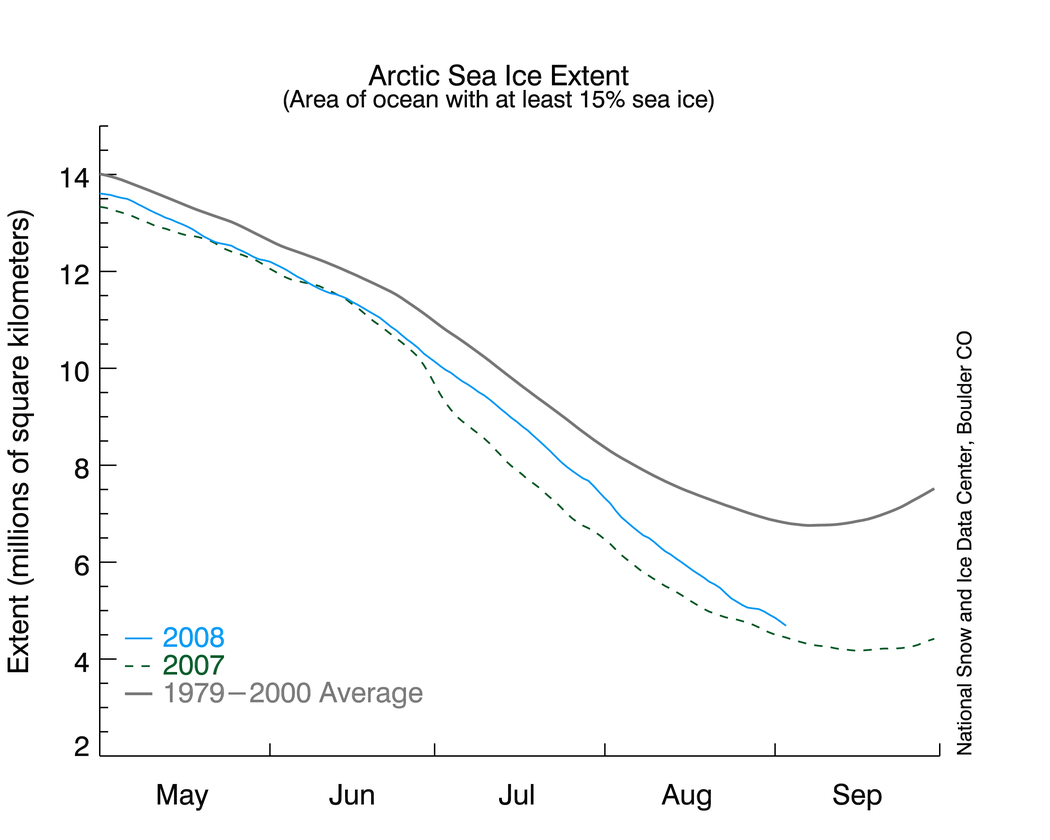
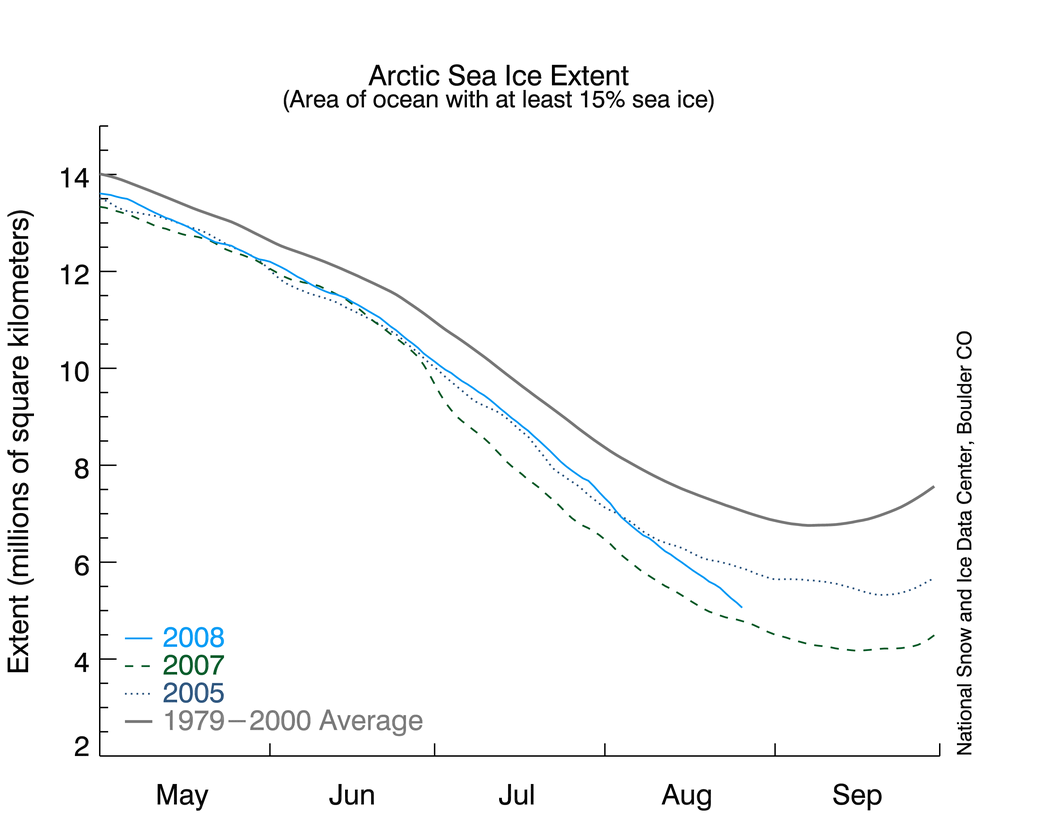
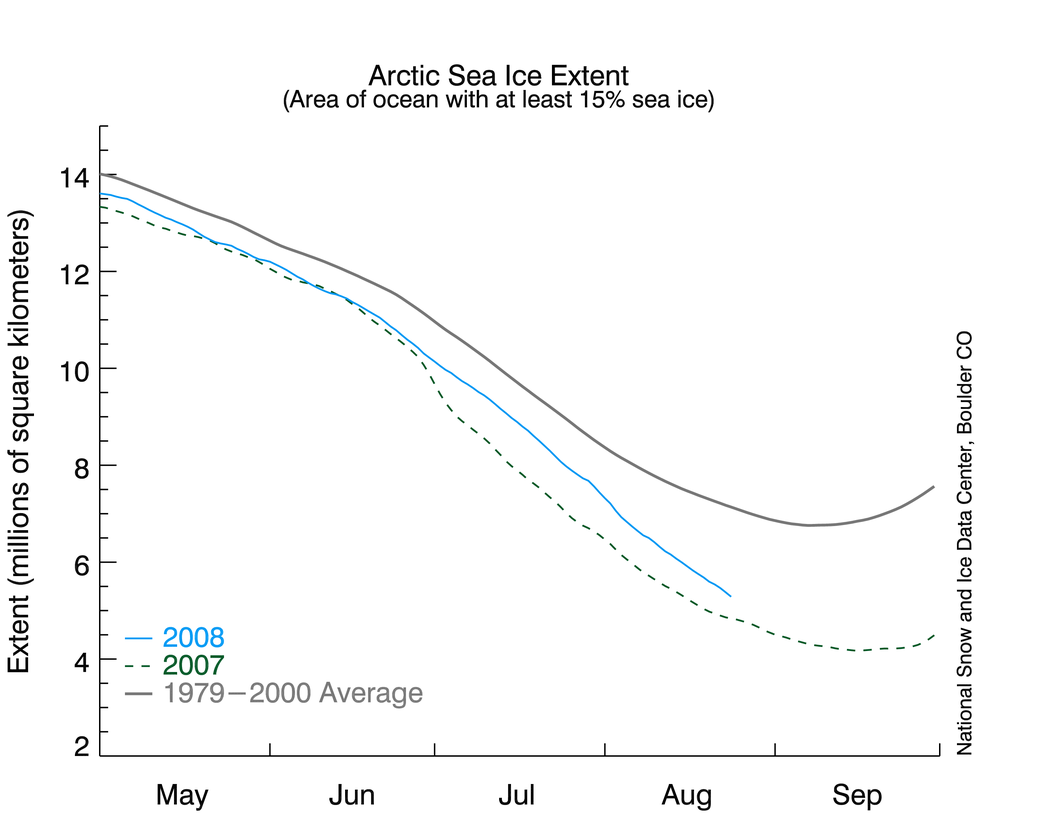
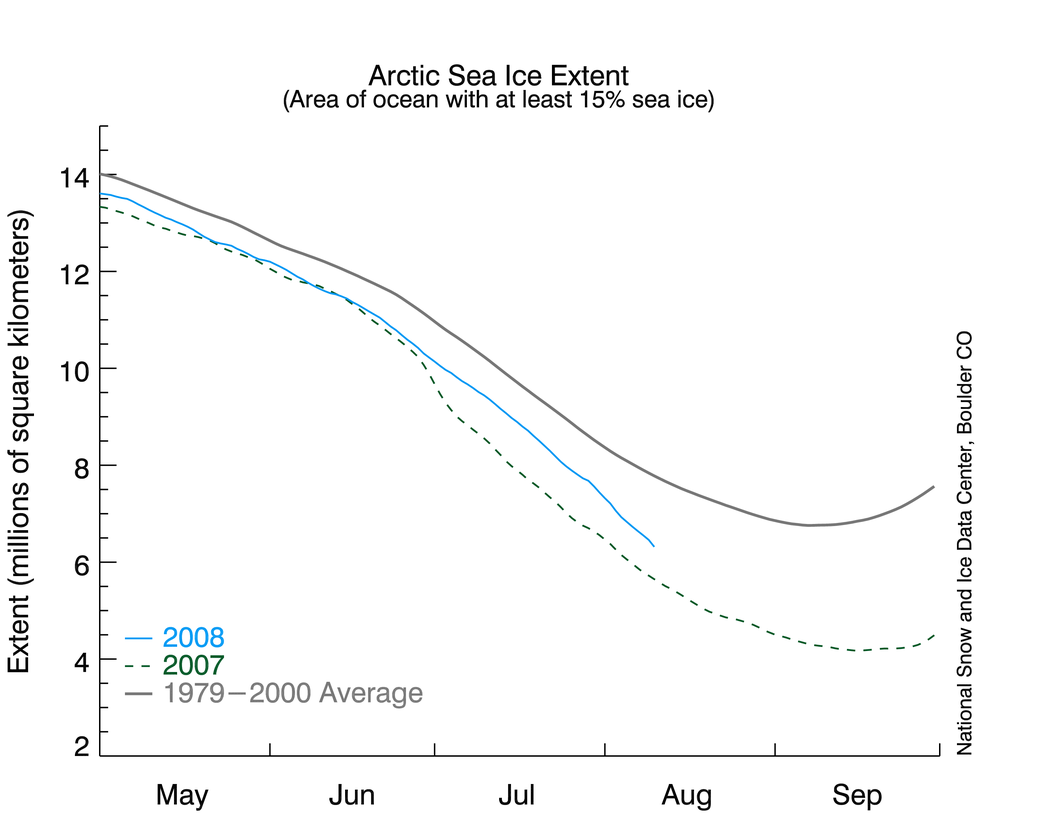
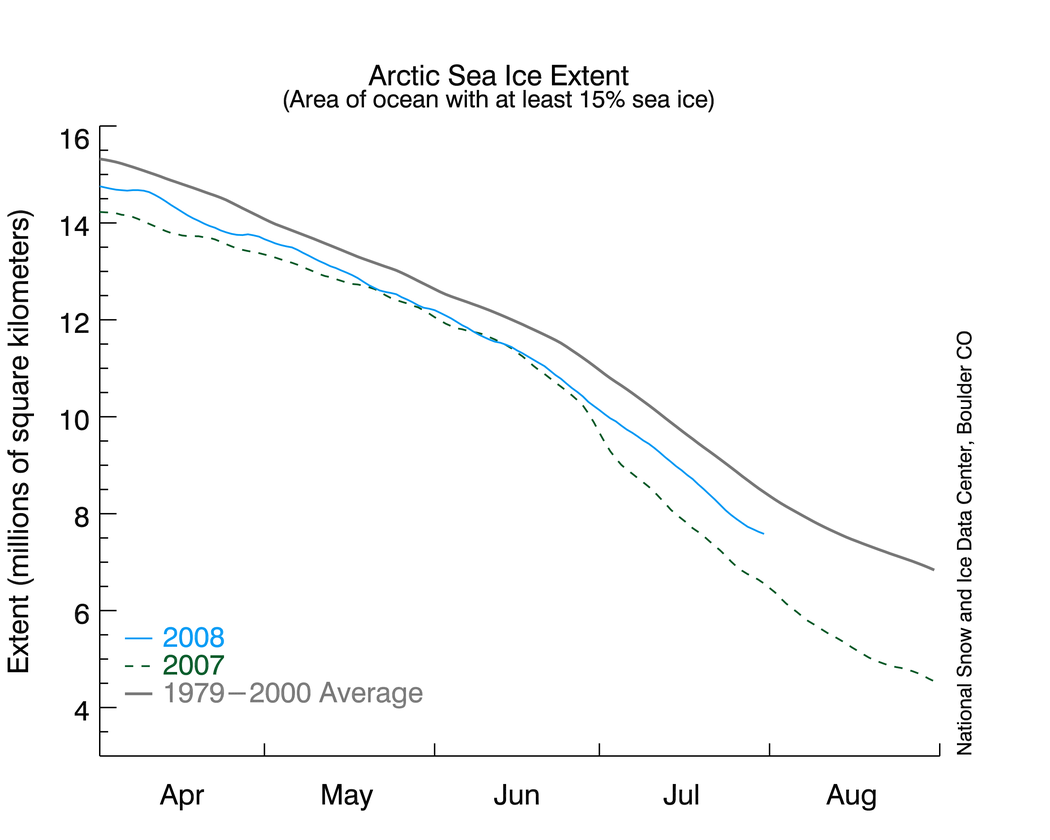
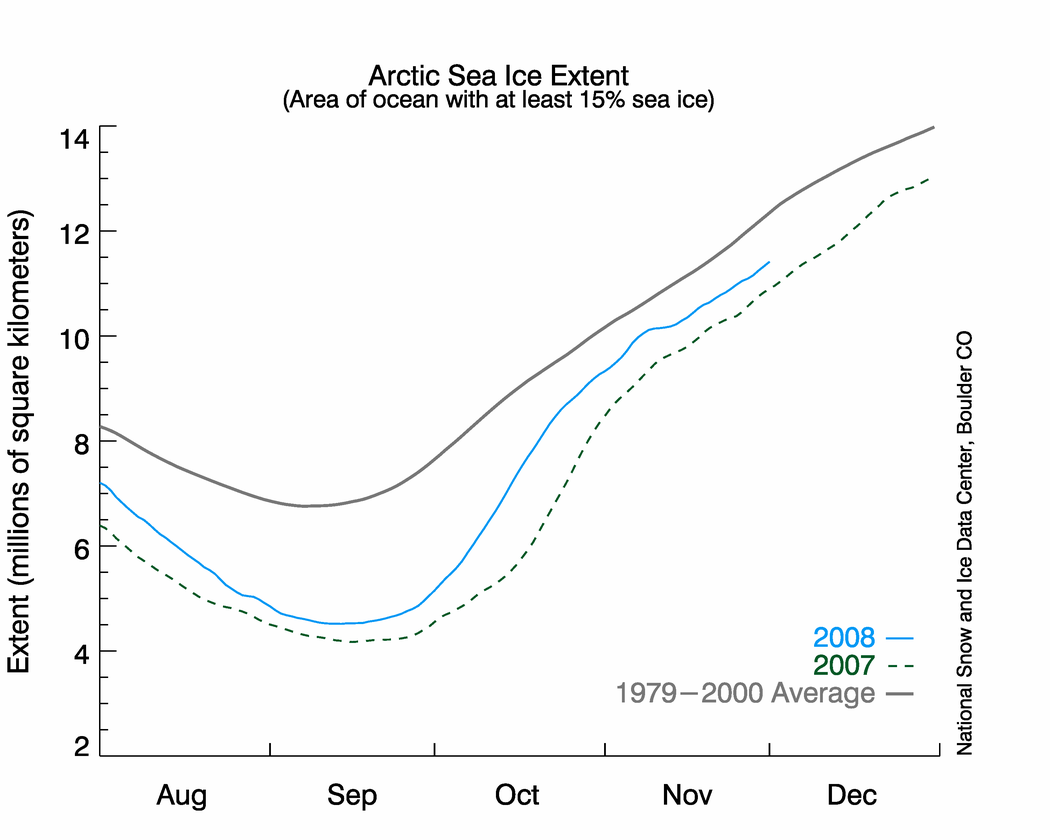 Figure 2. The graph above shows daily sea ice extent.The solid light blue line indicates 2008; the dashed green line shows 2007; and the solid gray line indicates average extent from 1979 to 2000. Sea Ice Index data.
—Credit: National Snow and Ice Data Center
High-resolution image
Conditions in context
The period of very rapid increase in ice extent that characterized October and early November has ended. The rise in ice extent through the remainder of November and early December has been much slower. The daily rate of ice growth has slowed simply because there is less physical room for ice to grow: the area of open water shrinks as ice fills it.
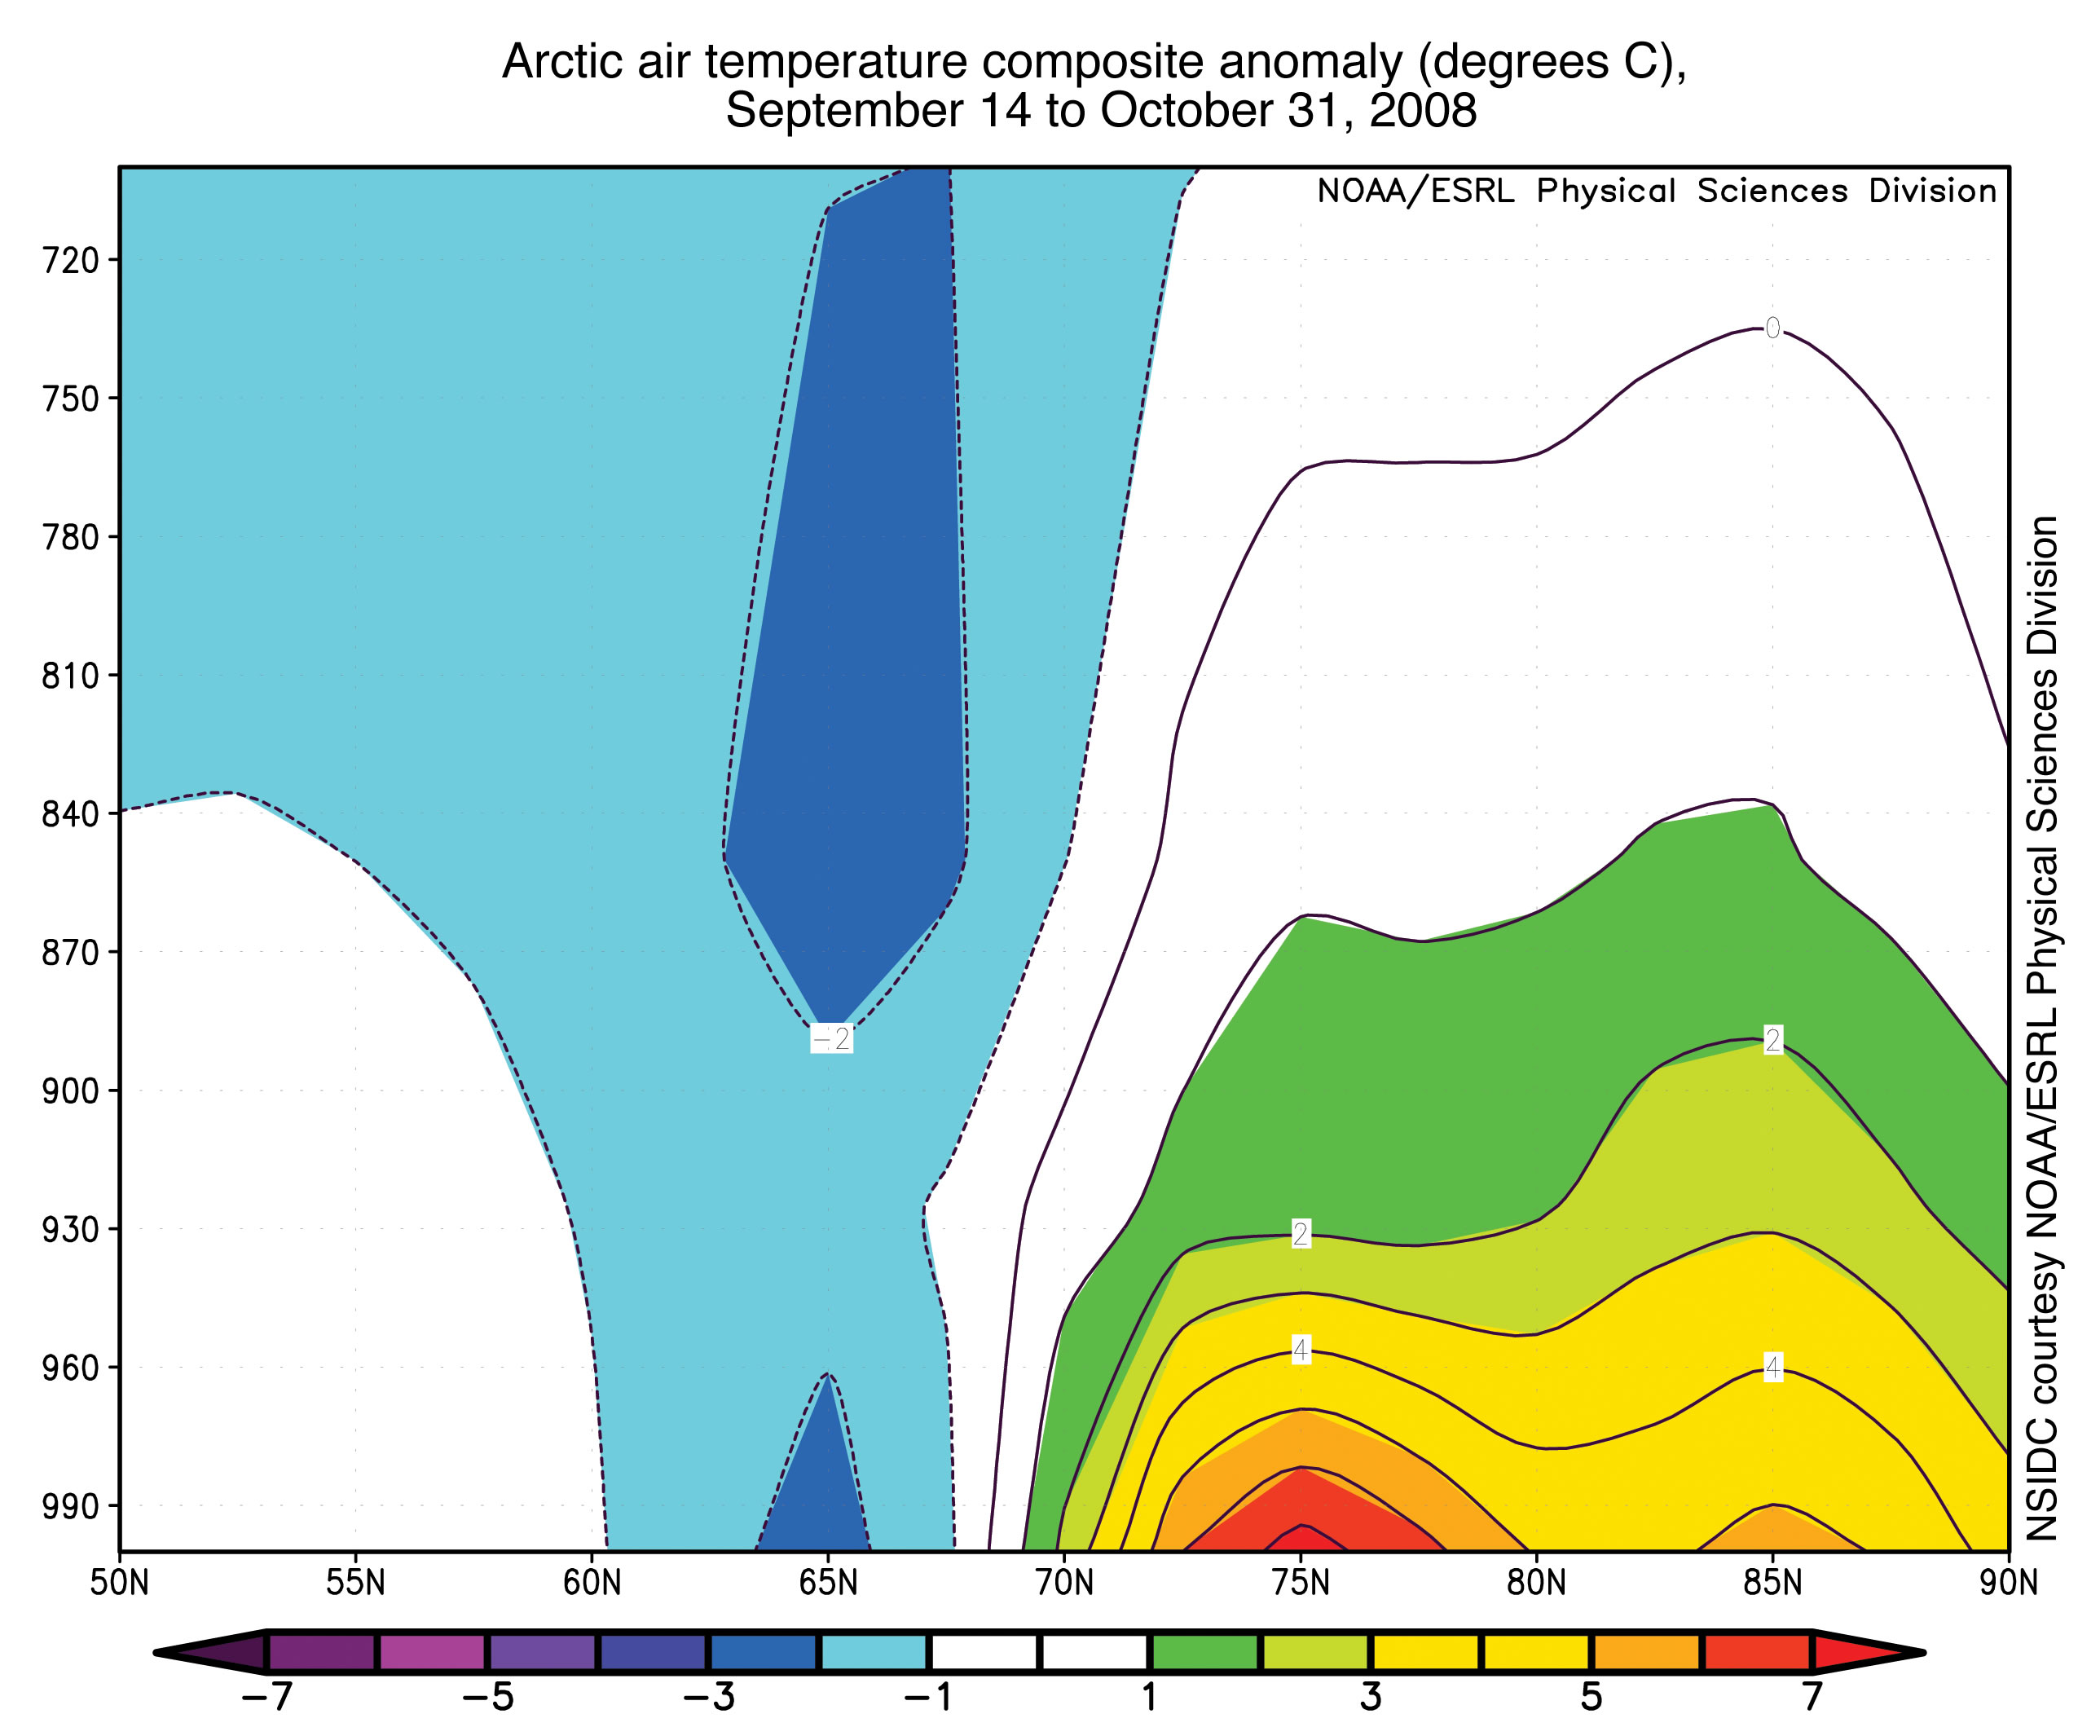
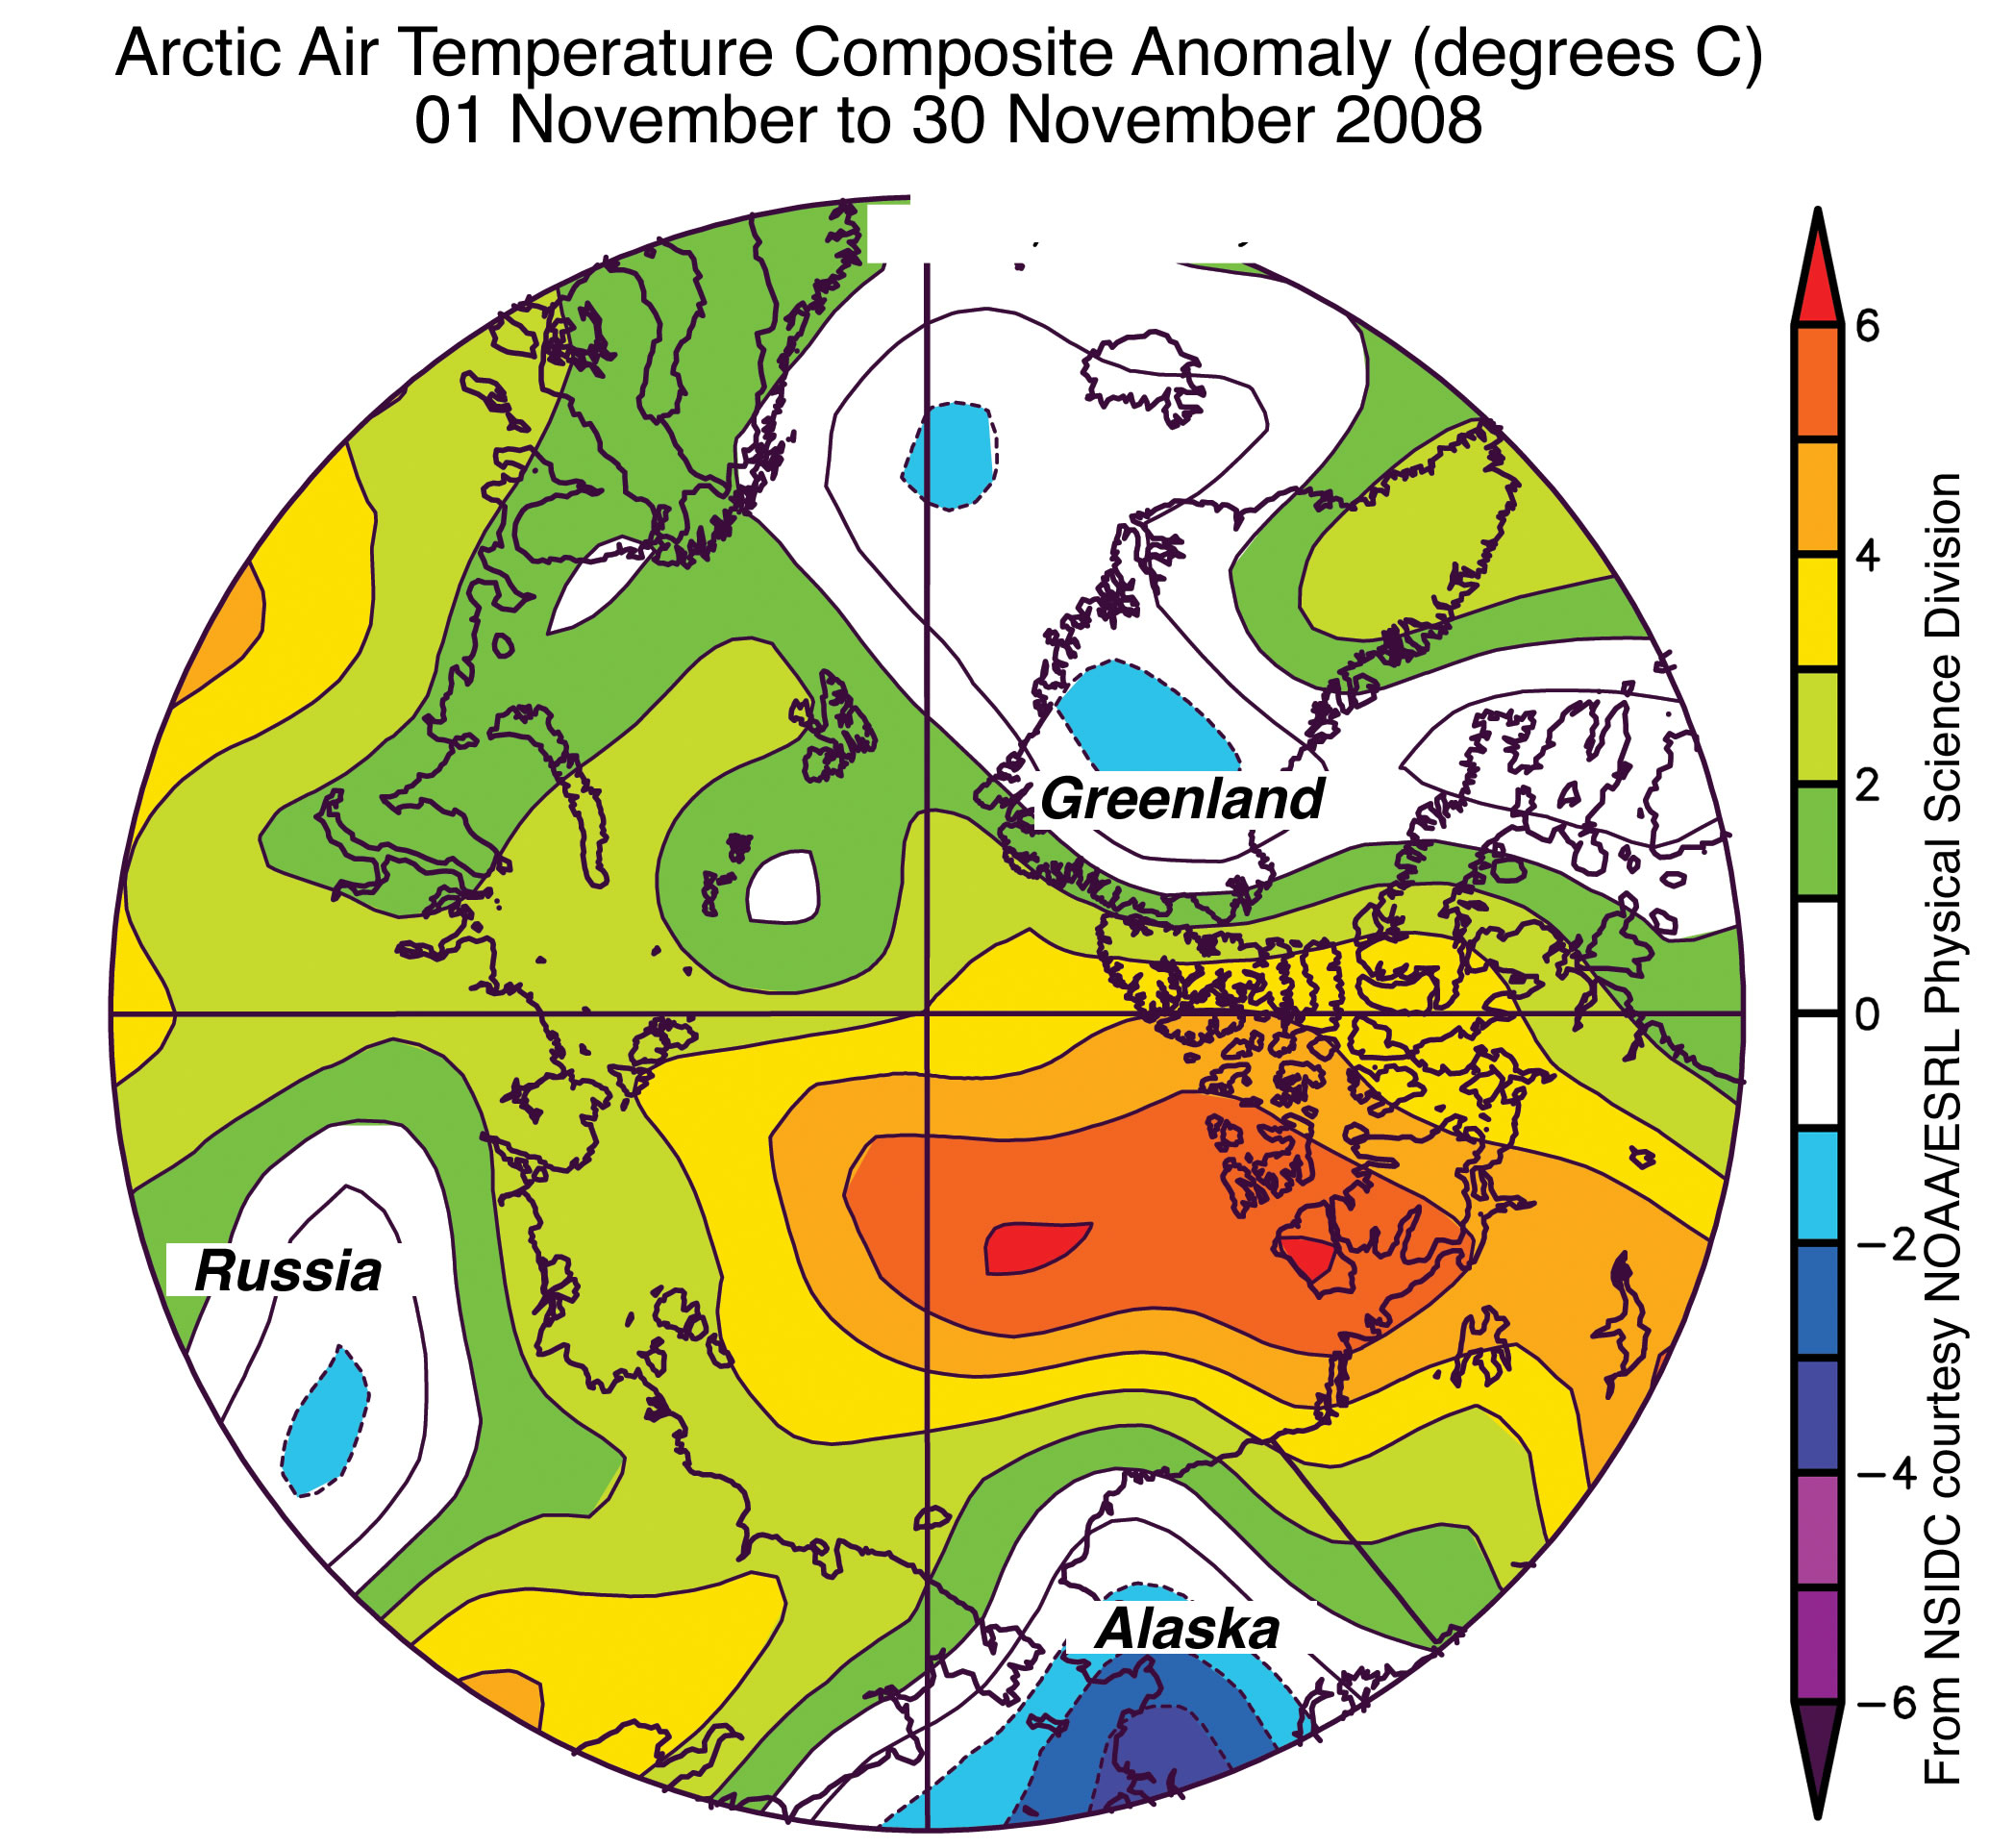 Figure 3. Air temperature anomalies for November 2008 at the 925 millibar level (roughly 1,000 meters [3,000 feet] above the surface) show unusually high temperatures over the Arctic Ocean. Areas in orange and red correspond to strong positive (warm) anomalies.
—Credit: From National Snow and Ice Data Center courtesy NOAA/ESRL Physical Sciences Laboratory
High-resolution image
Unusually high air temperatures continue
Our November 10 post noted unusually high air temperatures over the Arctic Ocean, especially in the Beaufort Sea, from the minimum on September 14 through October 31. This high air temperature was because of heat transfer from the ocean to the atmosphere coming both from open water areas and from the release of latent heat associated with ice growth.
Air temperatures over the Arctic Ocean stayed warm through November, partly because of continued ocean-to-atmosphere heat transfer. However, some of the warmest anomalies were located well north of the open water areas seen in September. This regional pattern of warming points to the strong role of atmospheric circulation, pumping warm air into the region from the south.
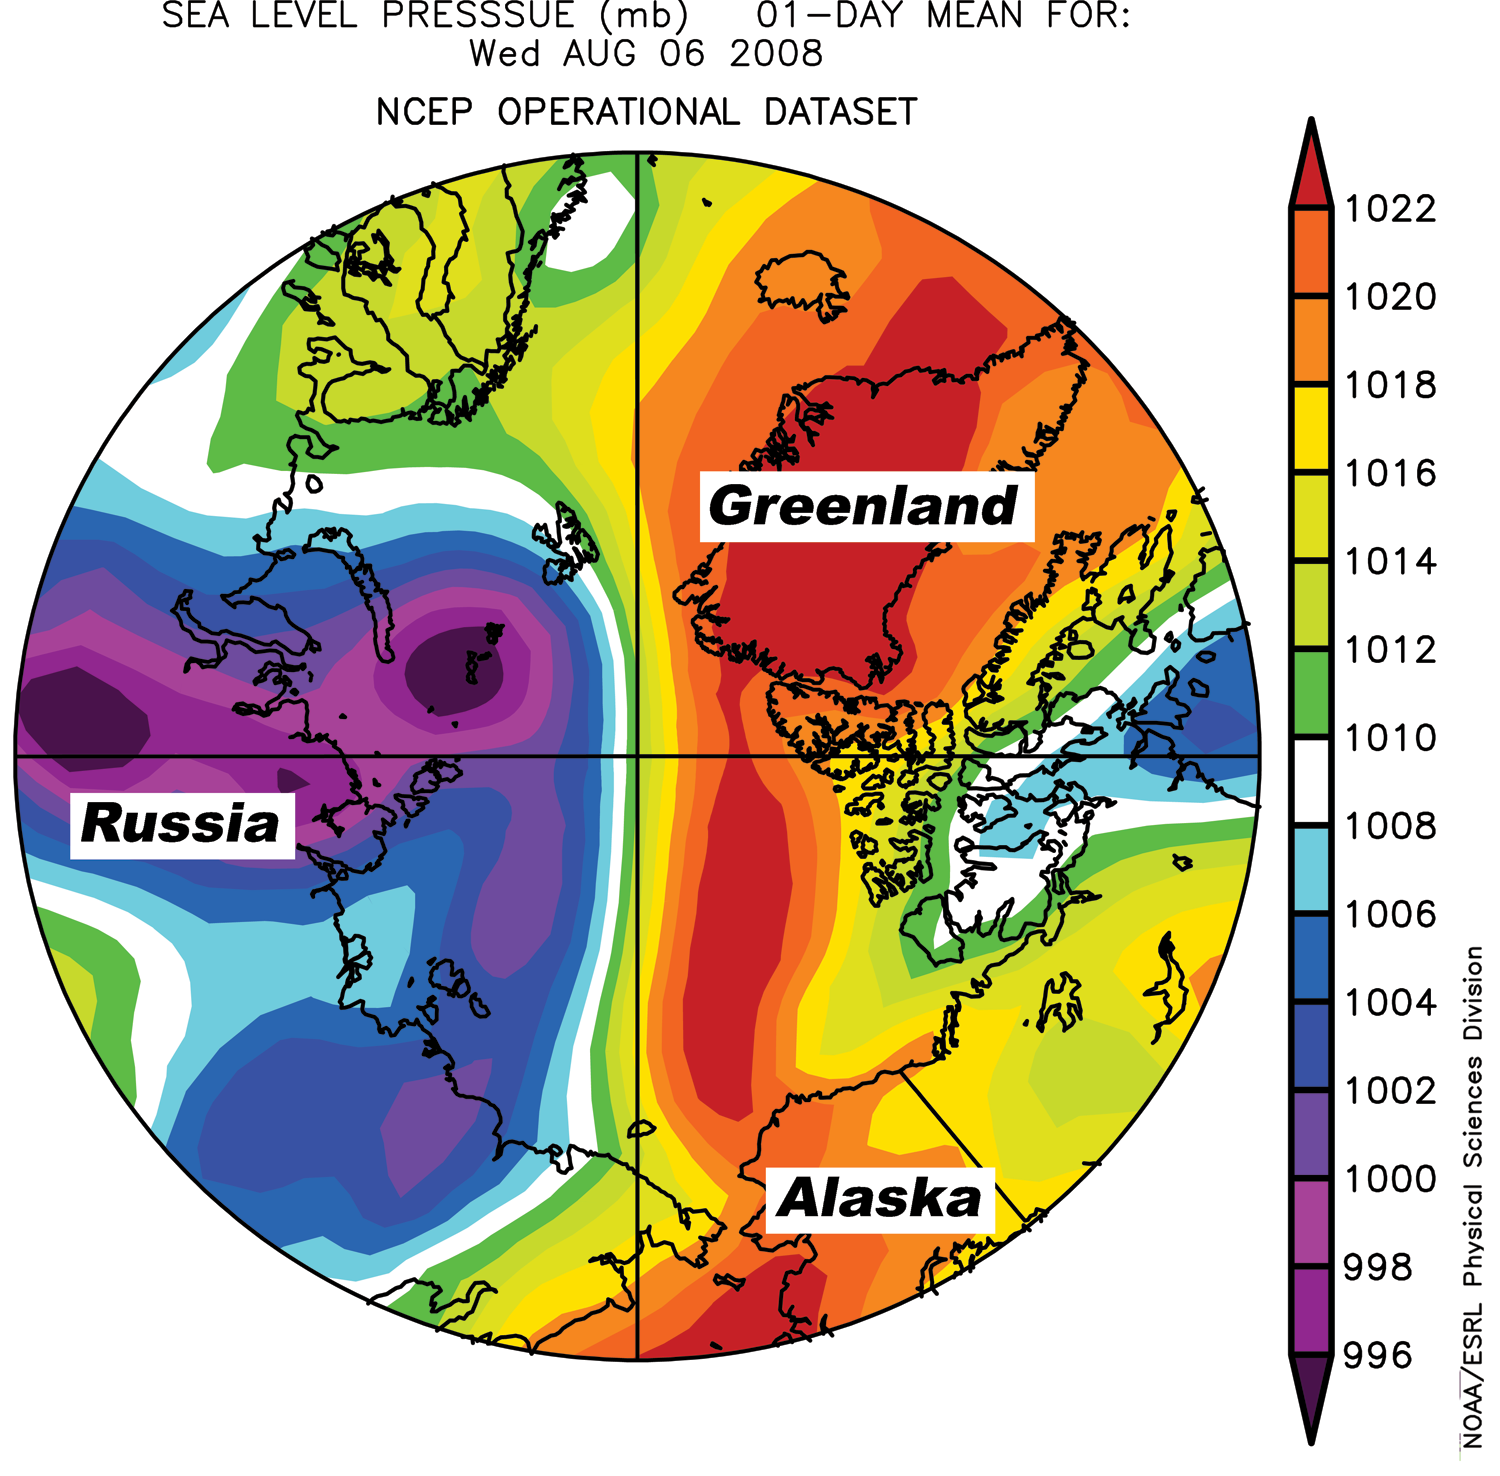
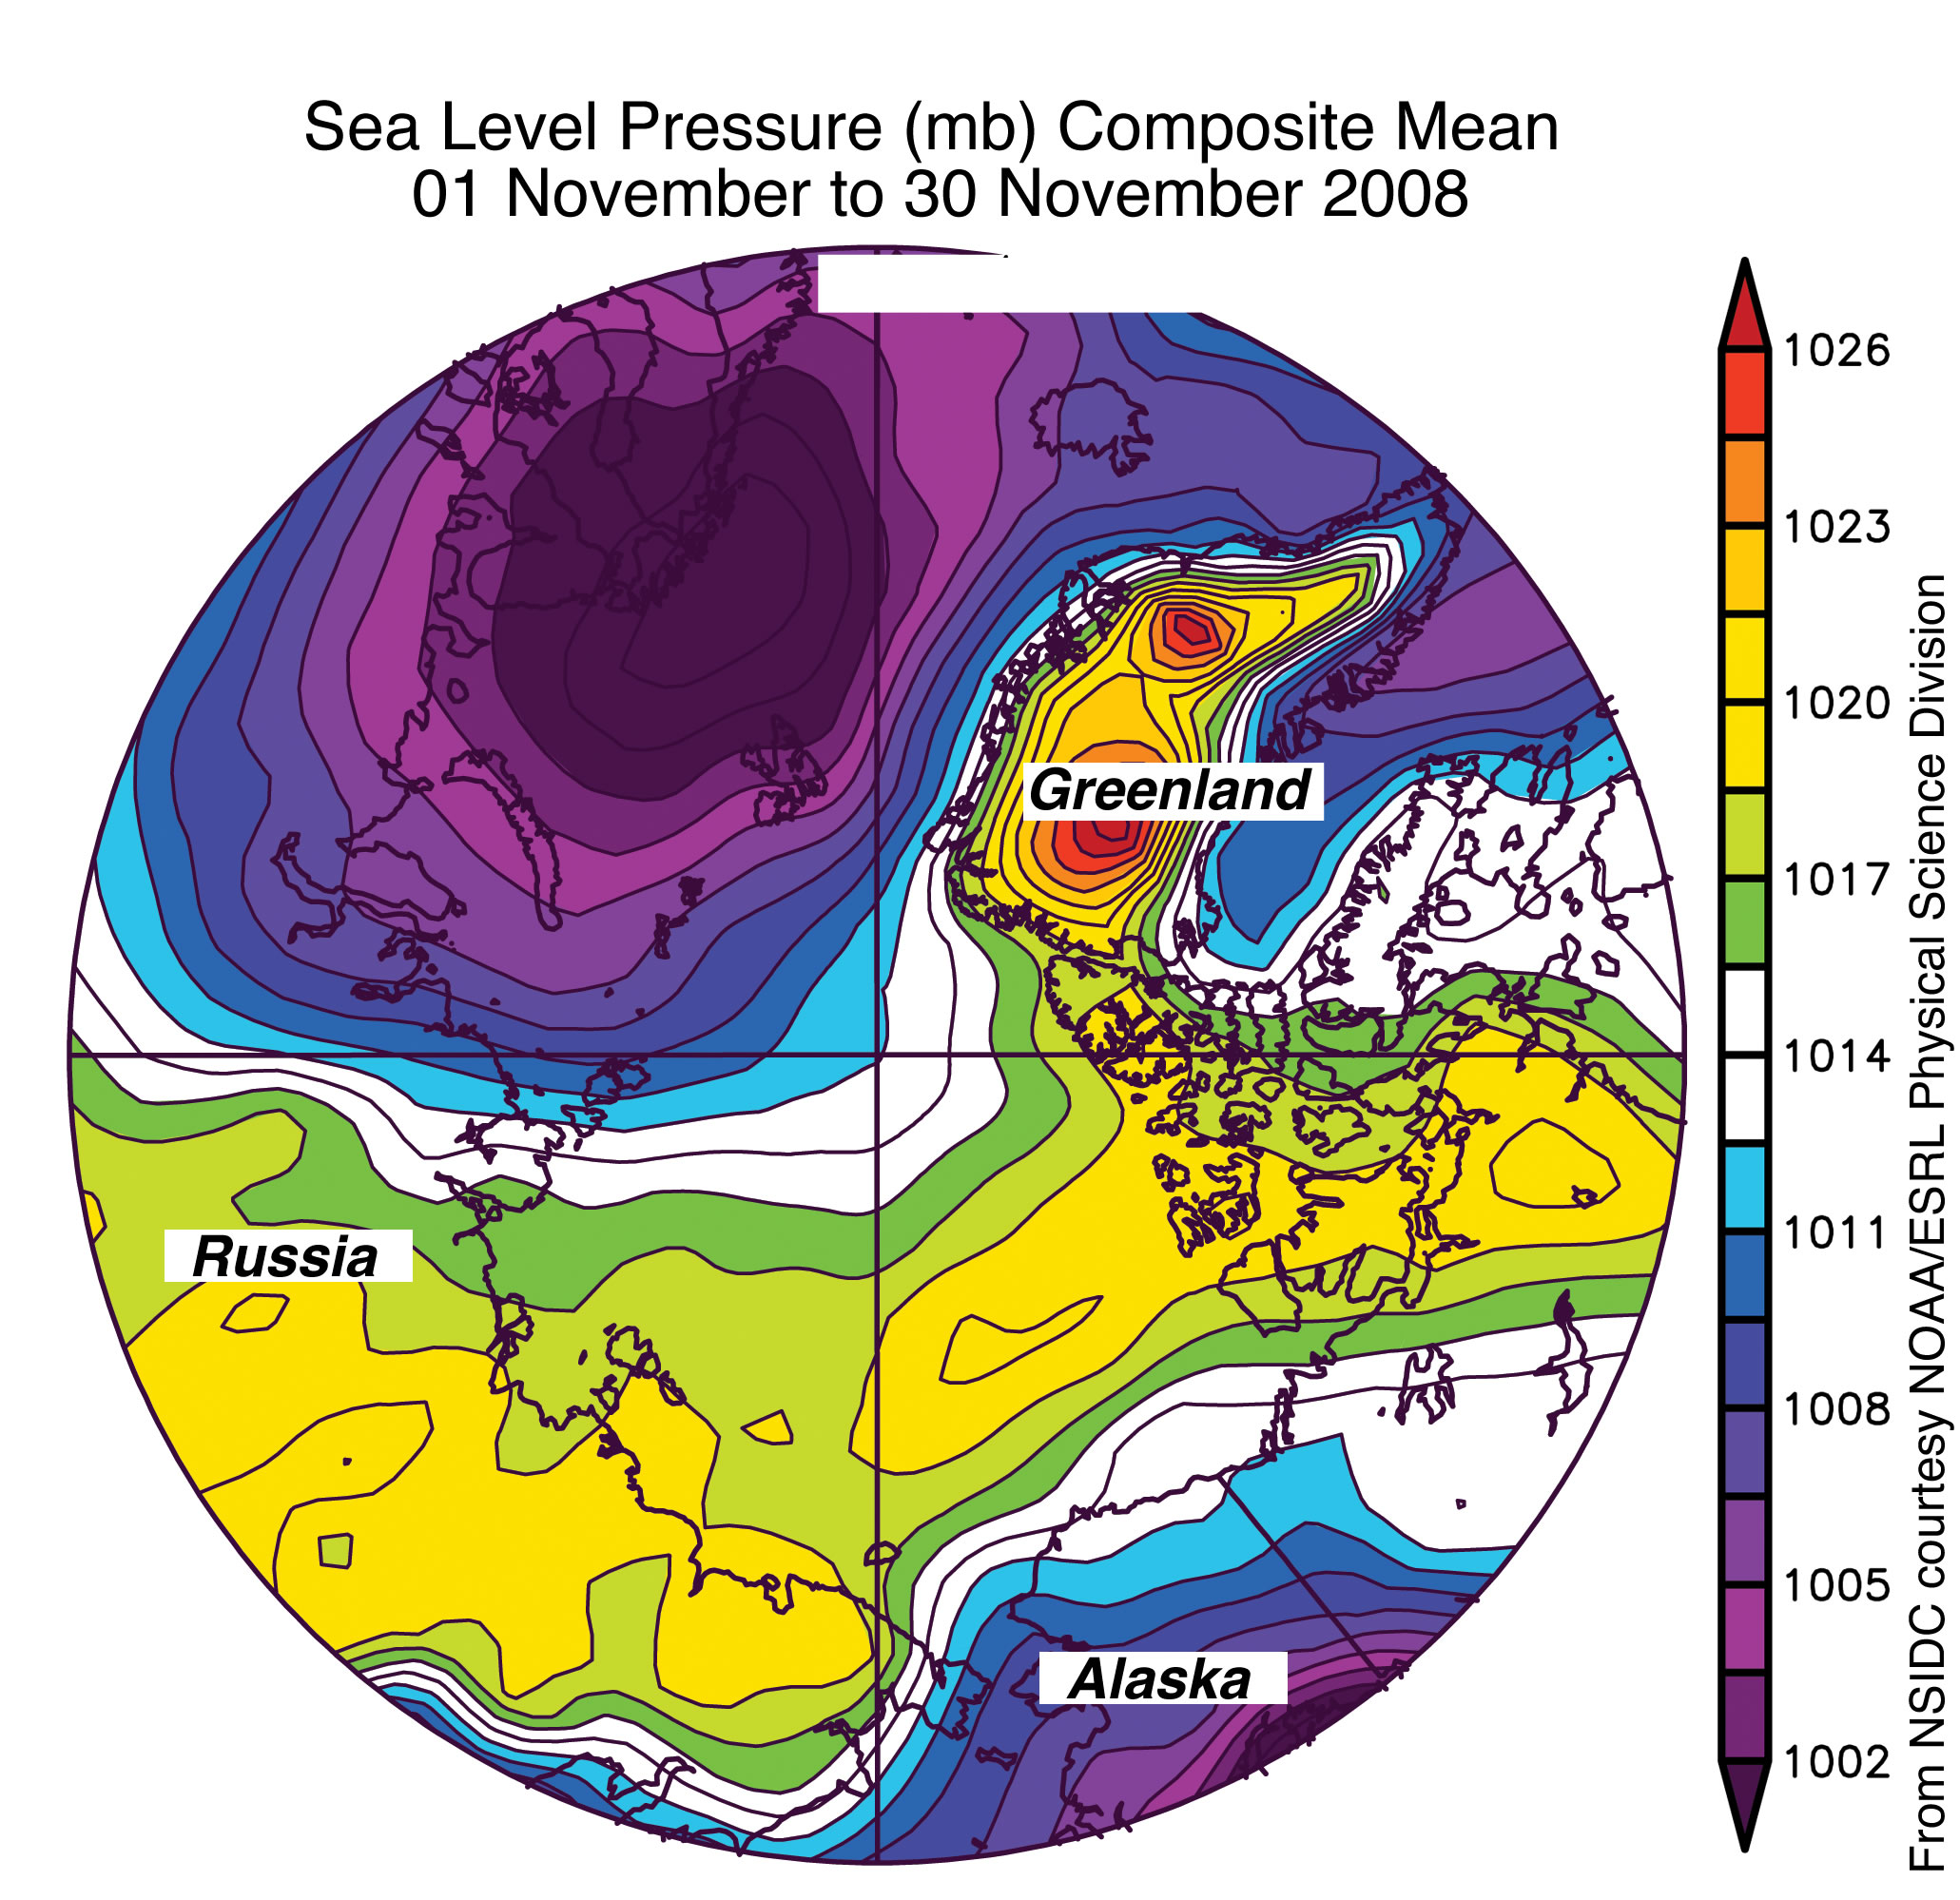 Figure 4.
Sea level pressure for November 2008 shows high- and low-pressure cells over the Arctic Ocean; strong winds have brought warmer-than-average air into the region. Regions of higher pressure are show in yellow and orange, regions of lower pressure are in purple.
—Credit: From National Snow and Ice Data Center courtesy NOAA/ESRL Physical Sciences Laboratory
High-resolution image
Warm air from the south
Pressure differences between high- and low-pressure cells, in conjunction with the Coriolis force, result in winds that blow parallel to the pressure contours (Buys-Ballot’s Law). In November, winds between the high-pressure cell north of Alaska and the unusually low-pressure cell on the Atlantic side of the Arctic Ocean have brought warmer-than-average air into the region. This is consistent with the pattern of temperature anomalies shown in Figure 3.
For previous analysis, please see the drop-down menu under Archives in the right navigation at the top of this page.
![]() NSIDC scientists provide Arctic Sea Ice News & Analysis, with partial support from NASA.
NSIDC scientists provide Arctic Sea Ice News & Analysis, with partial support from NASA.