Nearly frozen up by the end of October, the Arctic Ocean still showed small regions of open water within the Beaufort and Chukchi seas on its western side, and within the Kara Sea on its eastern side. These open water areas contributed to warmer than average air temperatures over the western Arctic.
Overview of conditions
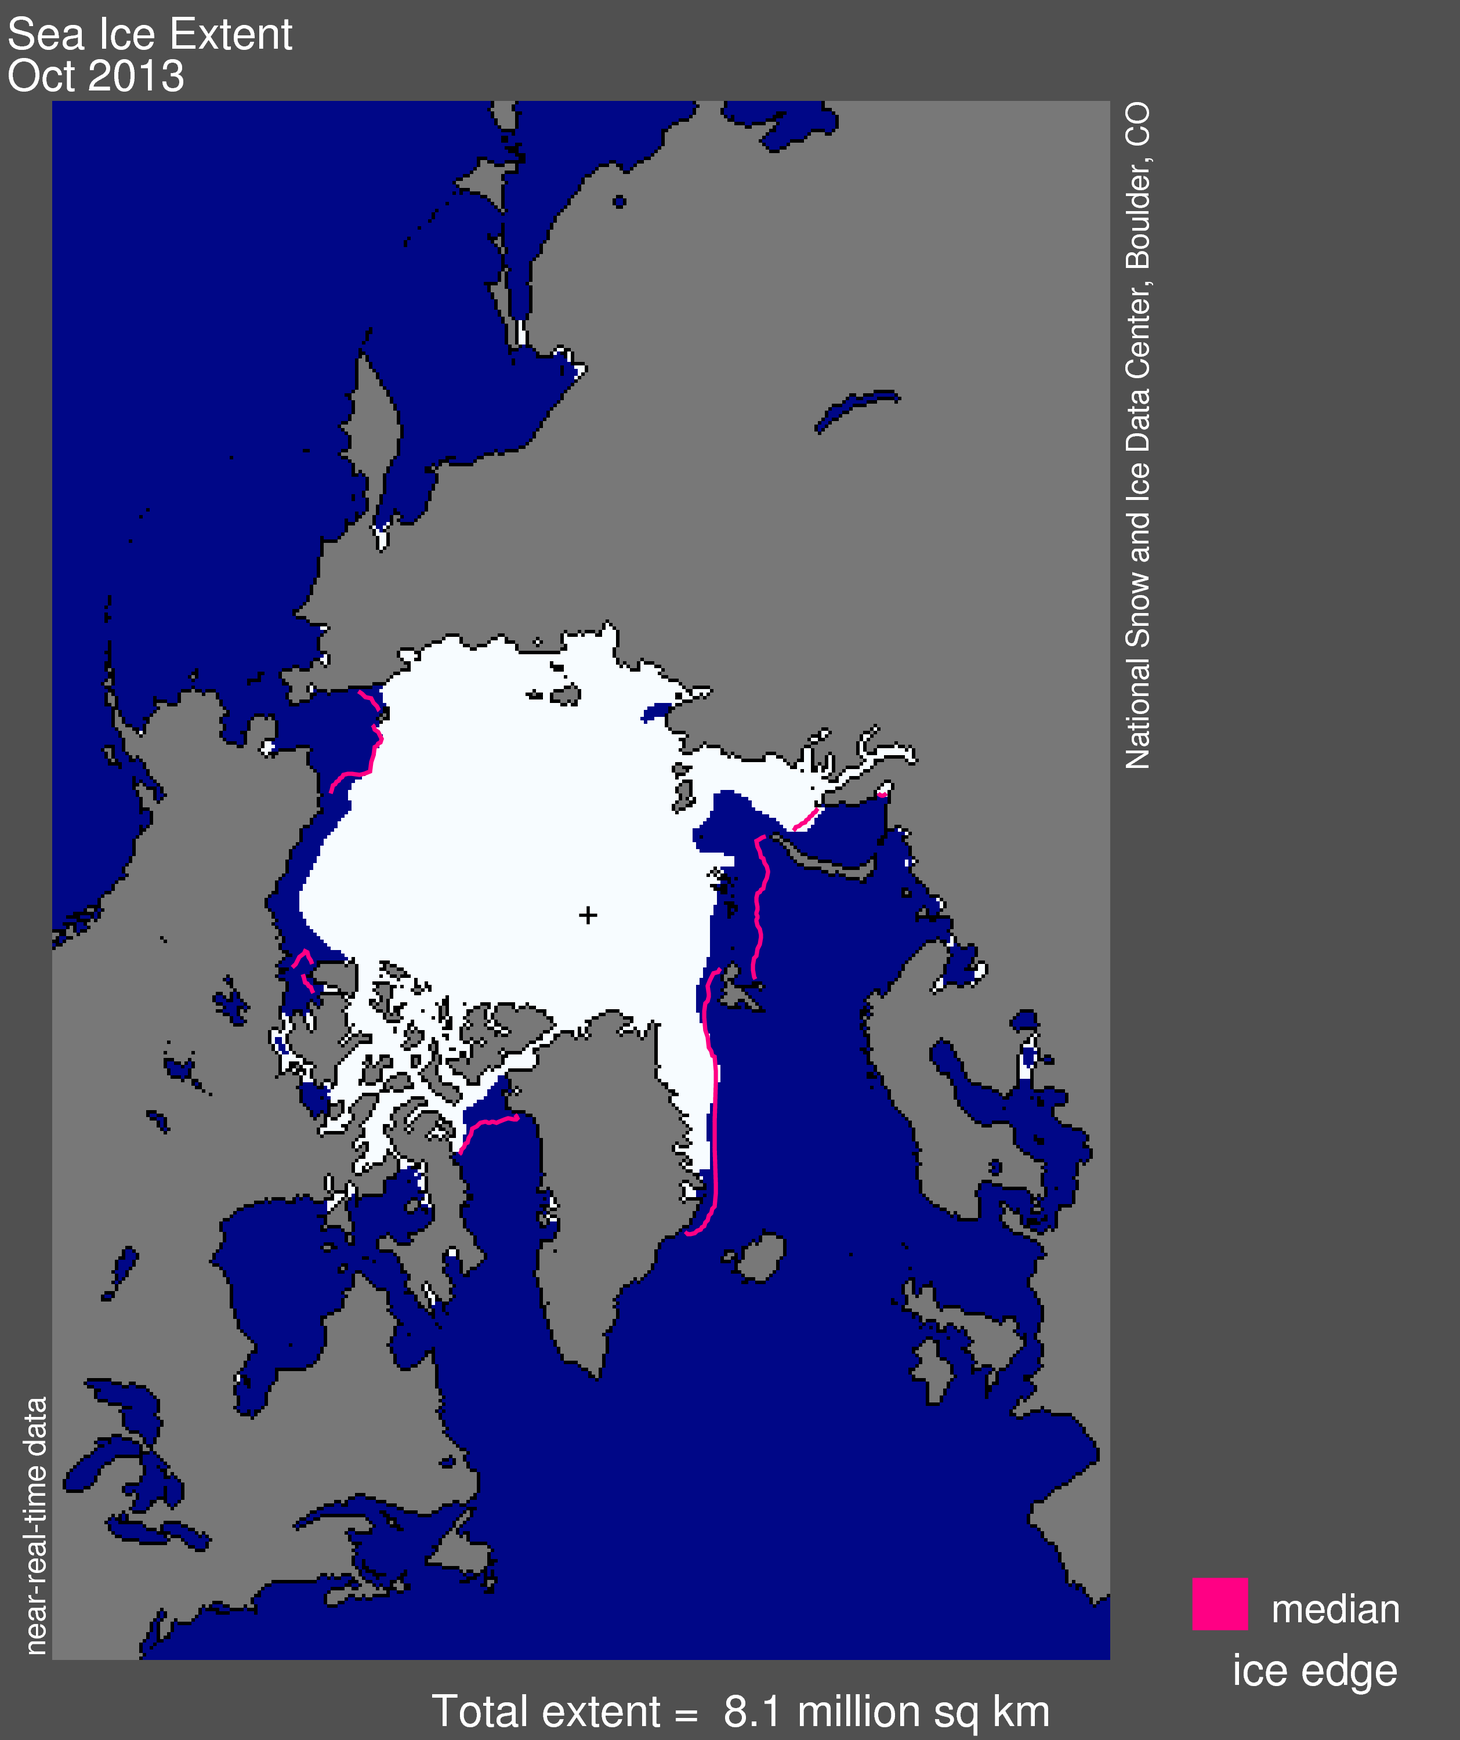
Figure 1. Arctic sea ice extent for October 2013 was 8.10 million square kilometers (3.13 million square miles). The magenta line shows the 1981 to 2010 median extent for that month. The black cross indicates the geographic North Pole. Sea Ice Index data. About the data
Credit: National Snow and Ice Data Center
High-resolution image
Arctic sea ice continued to expand during October as temperatures dropped and the number of daylight hours diminished, gaining 3.21 million square kilometers (1.24 million square miles) of ice since the beginning of the month. Average ice extent for October was 8.10 million square kilometers (3.13 million square miles), making it the 6th lowest October extent in the 35-year satellite data record. This was 810,000 square kilometers (313,000 square miles) below the 1981 to 2010 average extent. The October 2013 extent remains within two standard deviations of the long-term 1981 to 2010 average.
As open water areas refreeze and continue to lose the heat gained during the summer back to the atmosphere, near surface air temperatures have remained higher than average over areas that have not yet completely frozen over. As of the beginning of November, small parts of the Beaufort, Chukchi, and Kara seas remain ice free, while the East Siberian and Laptev seas have completely frozen over. Higher than average air temperatures have been observed over the ice-free regions while the rest of the Arctic is at near average to below average temperatures. This is in contrast to the first half of October 2012 when large parts of the East Siberian and Laptev seas remained ice free and the entire Arctic was warmer than average.
Conditions in context
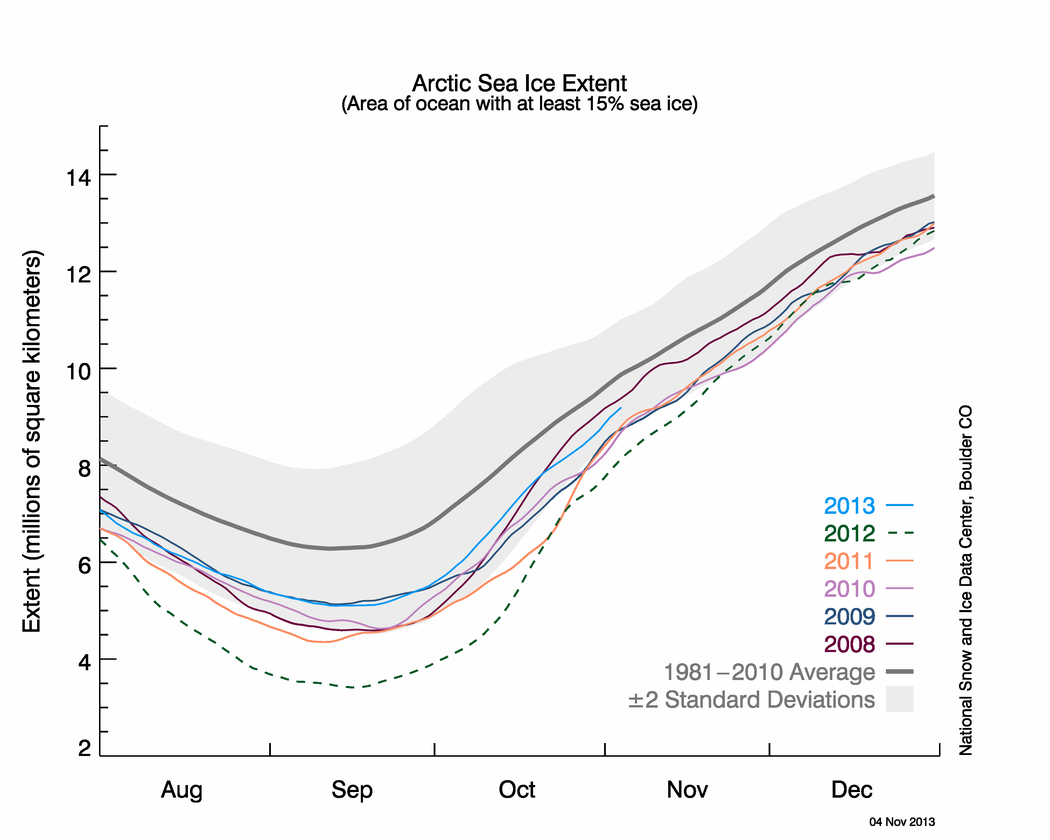
Figure 2. The graph above shows Arctic sea ice extent as of November 4, 2013, along with daily ice extent data for five previous years. 2013 is shown in blue, 2012 in green, 2011 in orange, 2010 in pink, 2009 in navy, and 2008 in purple. The 1981 to 2010 average is in dark gray. Sea Ice Index data.
Credit: National Snow and Ice Data Center
High-resolution image
Ice grew at rates faster than average throughout October, at 103,500 square kilometers (40,000 square miles) per day compared to the 1981 to 2010 average of 87,500 square kilometers per day (33,800 square miles per day). However, this rate is slower than last year, when ice extent doubled during the month of October. Nevertheless, the ice cover is more extensive than in 2012. At the end of the month the extent was 710,000 square kilometers (274,100 square miles) below average and 1.1 million square kilometers (424,700 square miles) above the same time last year.
While the sea ice extent this summer was higher than the past several summers, extent remained anomalously low compared to the long-term mean, and the larger regions of open water during summer were able to absorb the sun’s energy, leading to higher sea surface temperatures. Before the ocean can refreeze in the autumn, it releases this excess heat back to the atmosphere, resulting in higher than average air temperatures. In October, air temperatures along the coastal Beaufort Sea were 6 to 8 degrees Celsius (11 to 14 degrees Fahrenheit) higher than average. Air temperatures were also 2 to 4 degrees Celsius (4 to 7 degrees Fahrenheit) higher than average over much of the western and central Arctic and near Greenland and the Canadian Archipelago.
October 2013 compared to previous years
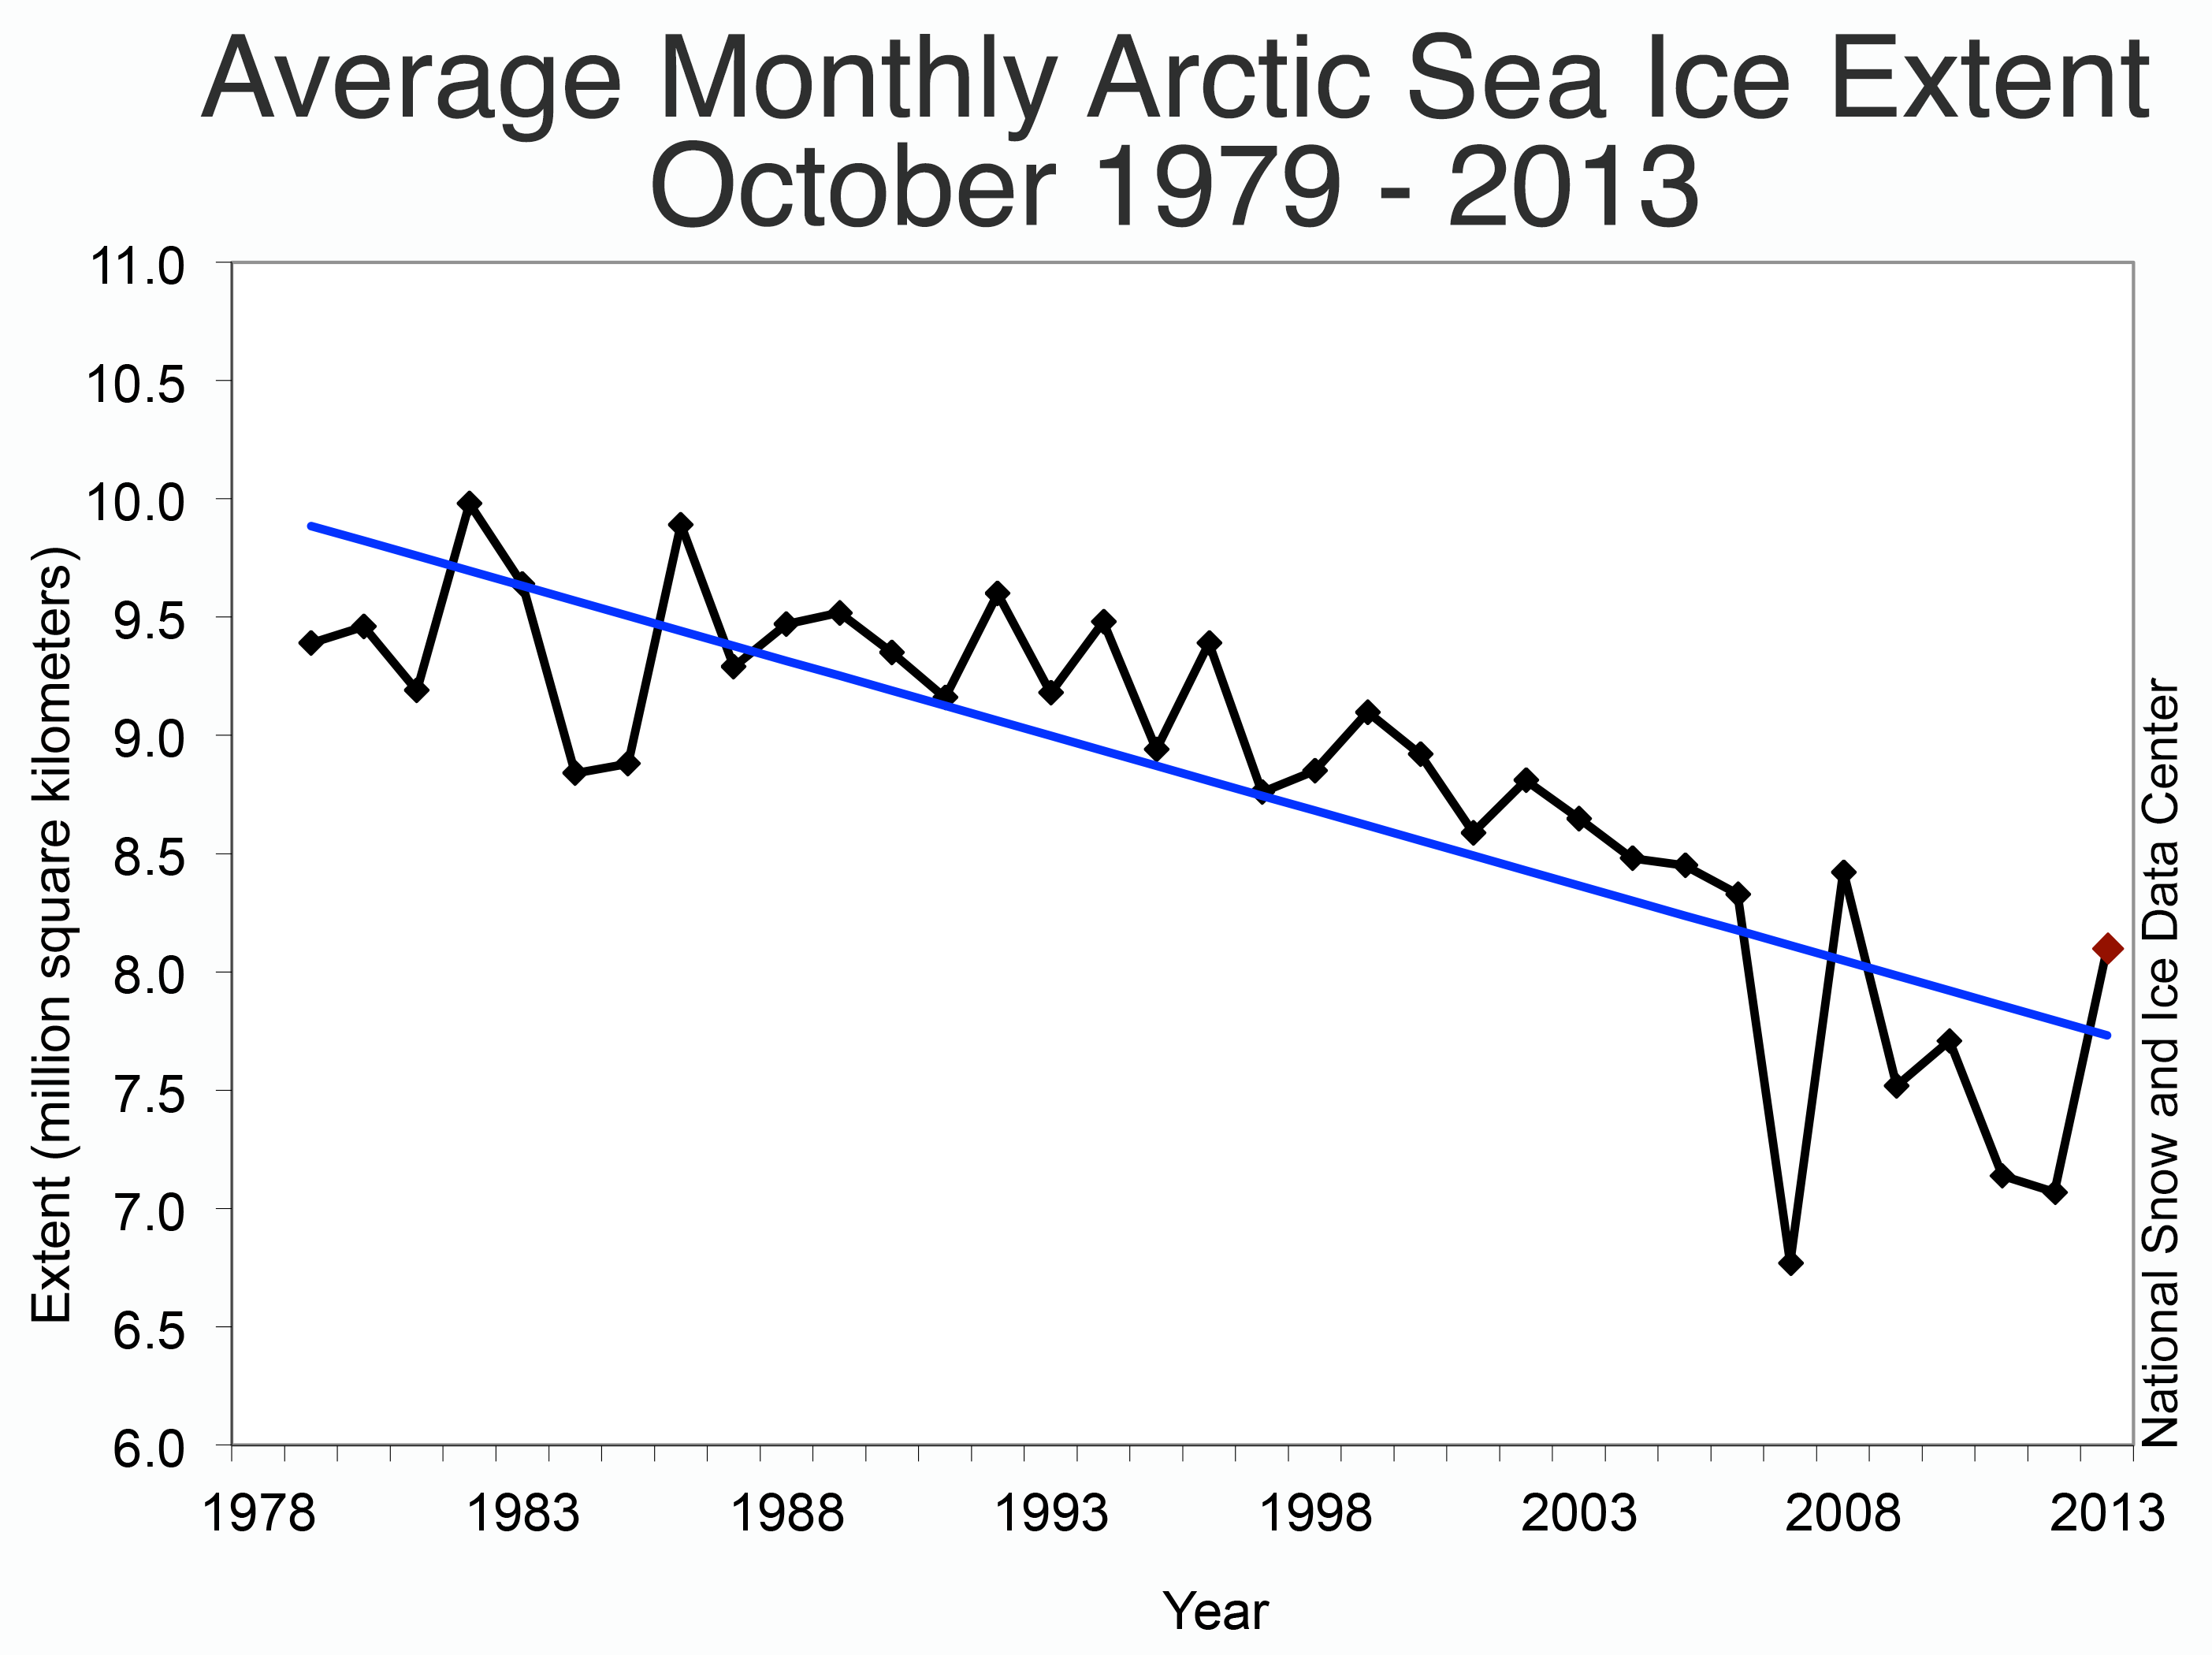
Figure 3. Monthly October ice extent for 1979 to 2013 shows a decline of –7.1% per decade relative to the 1981 to 2010 average.
Credit: National Snow and Ice Data Center
High-resolution image
The year 2013 marks the first October with an extent above 8 million square kilometers (3.09 million square miles) since 2009 and only the second since 2006. From 1979 to 2006, average October extent was never below 8 million square kilometers, and several years had October extents above 9 million square kilometers (3.47 million square miles). The lowest October extent, less than 7 million square kilometers (2.7 million square miles), was observed in 2007. The linear trend in October ice extent is –7.1 % per decade relative to the 1981 to 2010 mean, or –63,400 square kilometers per year (–24,500 square miles per year).
Sea ice decline and the greening of Arctic tundra
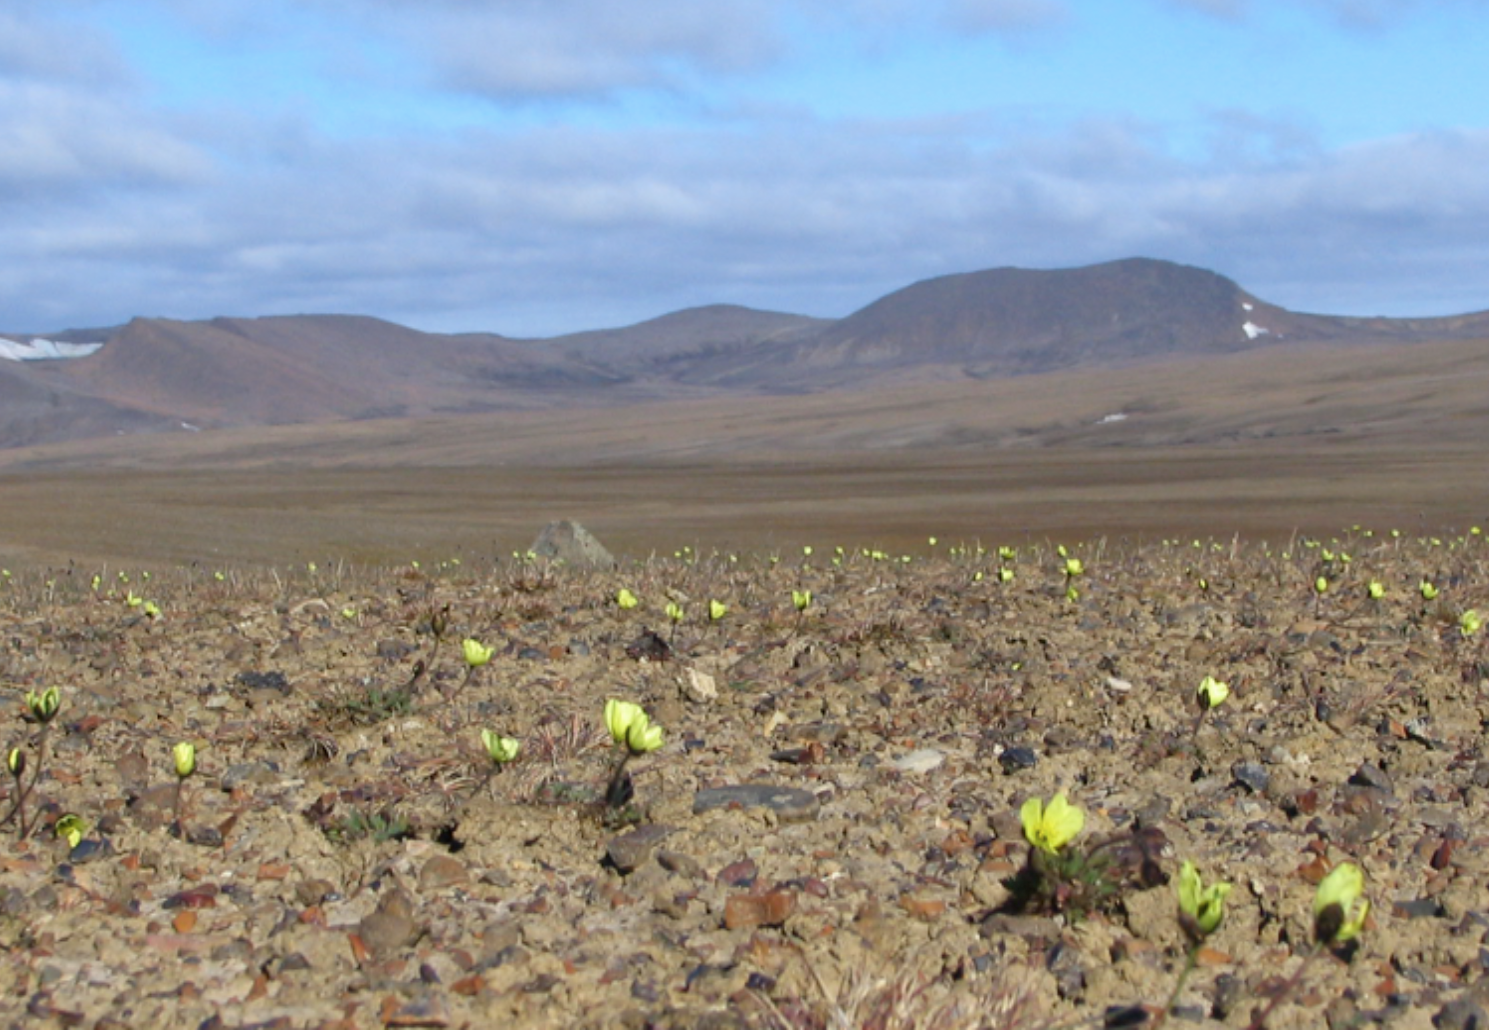
Figure 4. Yellow flowers (Papaver dahlianum), typical of the high Arctic subzone A, dot the tundra on Ellef Ringnes Island in Nunuvut, Canada. Arctic tundra is the coldest of the Circumpolar Arctic Vegetation Map’s bioclimate subzones. The subzones range from mean July temperatures just above freezing in the tundra (Subzone A) to mean July temperatures of around 10 degrees Celsius in Subzone E where shrubs can reach up to heights of 2 meters.
Credit: D. A. Walker
High-resolution image
As sea ice extent declined over the past years, Arctic tundra has received an increased amount of summer warmth and has gotten greener. Arctic tundra (Figure 4) is a maritime biome, most of which can be found within 100 kilometers (62 miles) of seasonally ice-covered seas. This proximity to sea ice limits the tundra’s exposure to available warmth and vegetation growth. Over 30 years of remote sensing data show that the decline in sea ice extent corresponds to land surface warming (Figure 5, left panel) and increased vegetation cover (Figure 5, right panel, Maximum Normalized Difference Vegetation Index, or MaxNDVI). When sea ice extent is below average in coastal seas, land surfaces warm, and satellites see a stronger signal of vegetation.
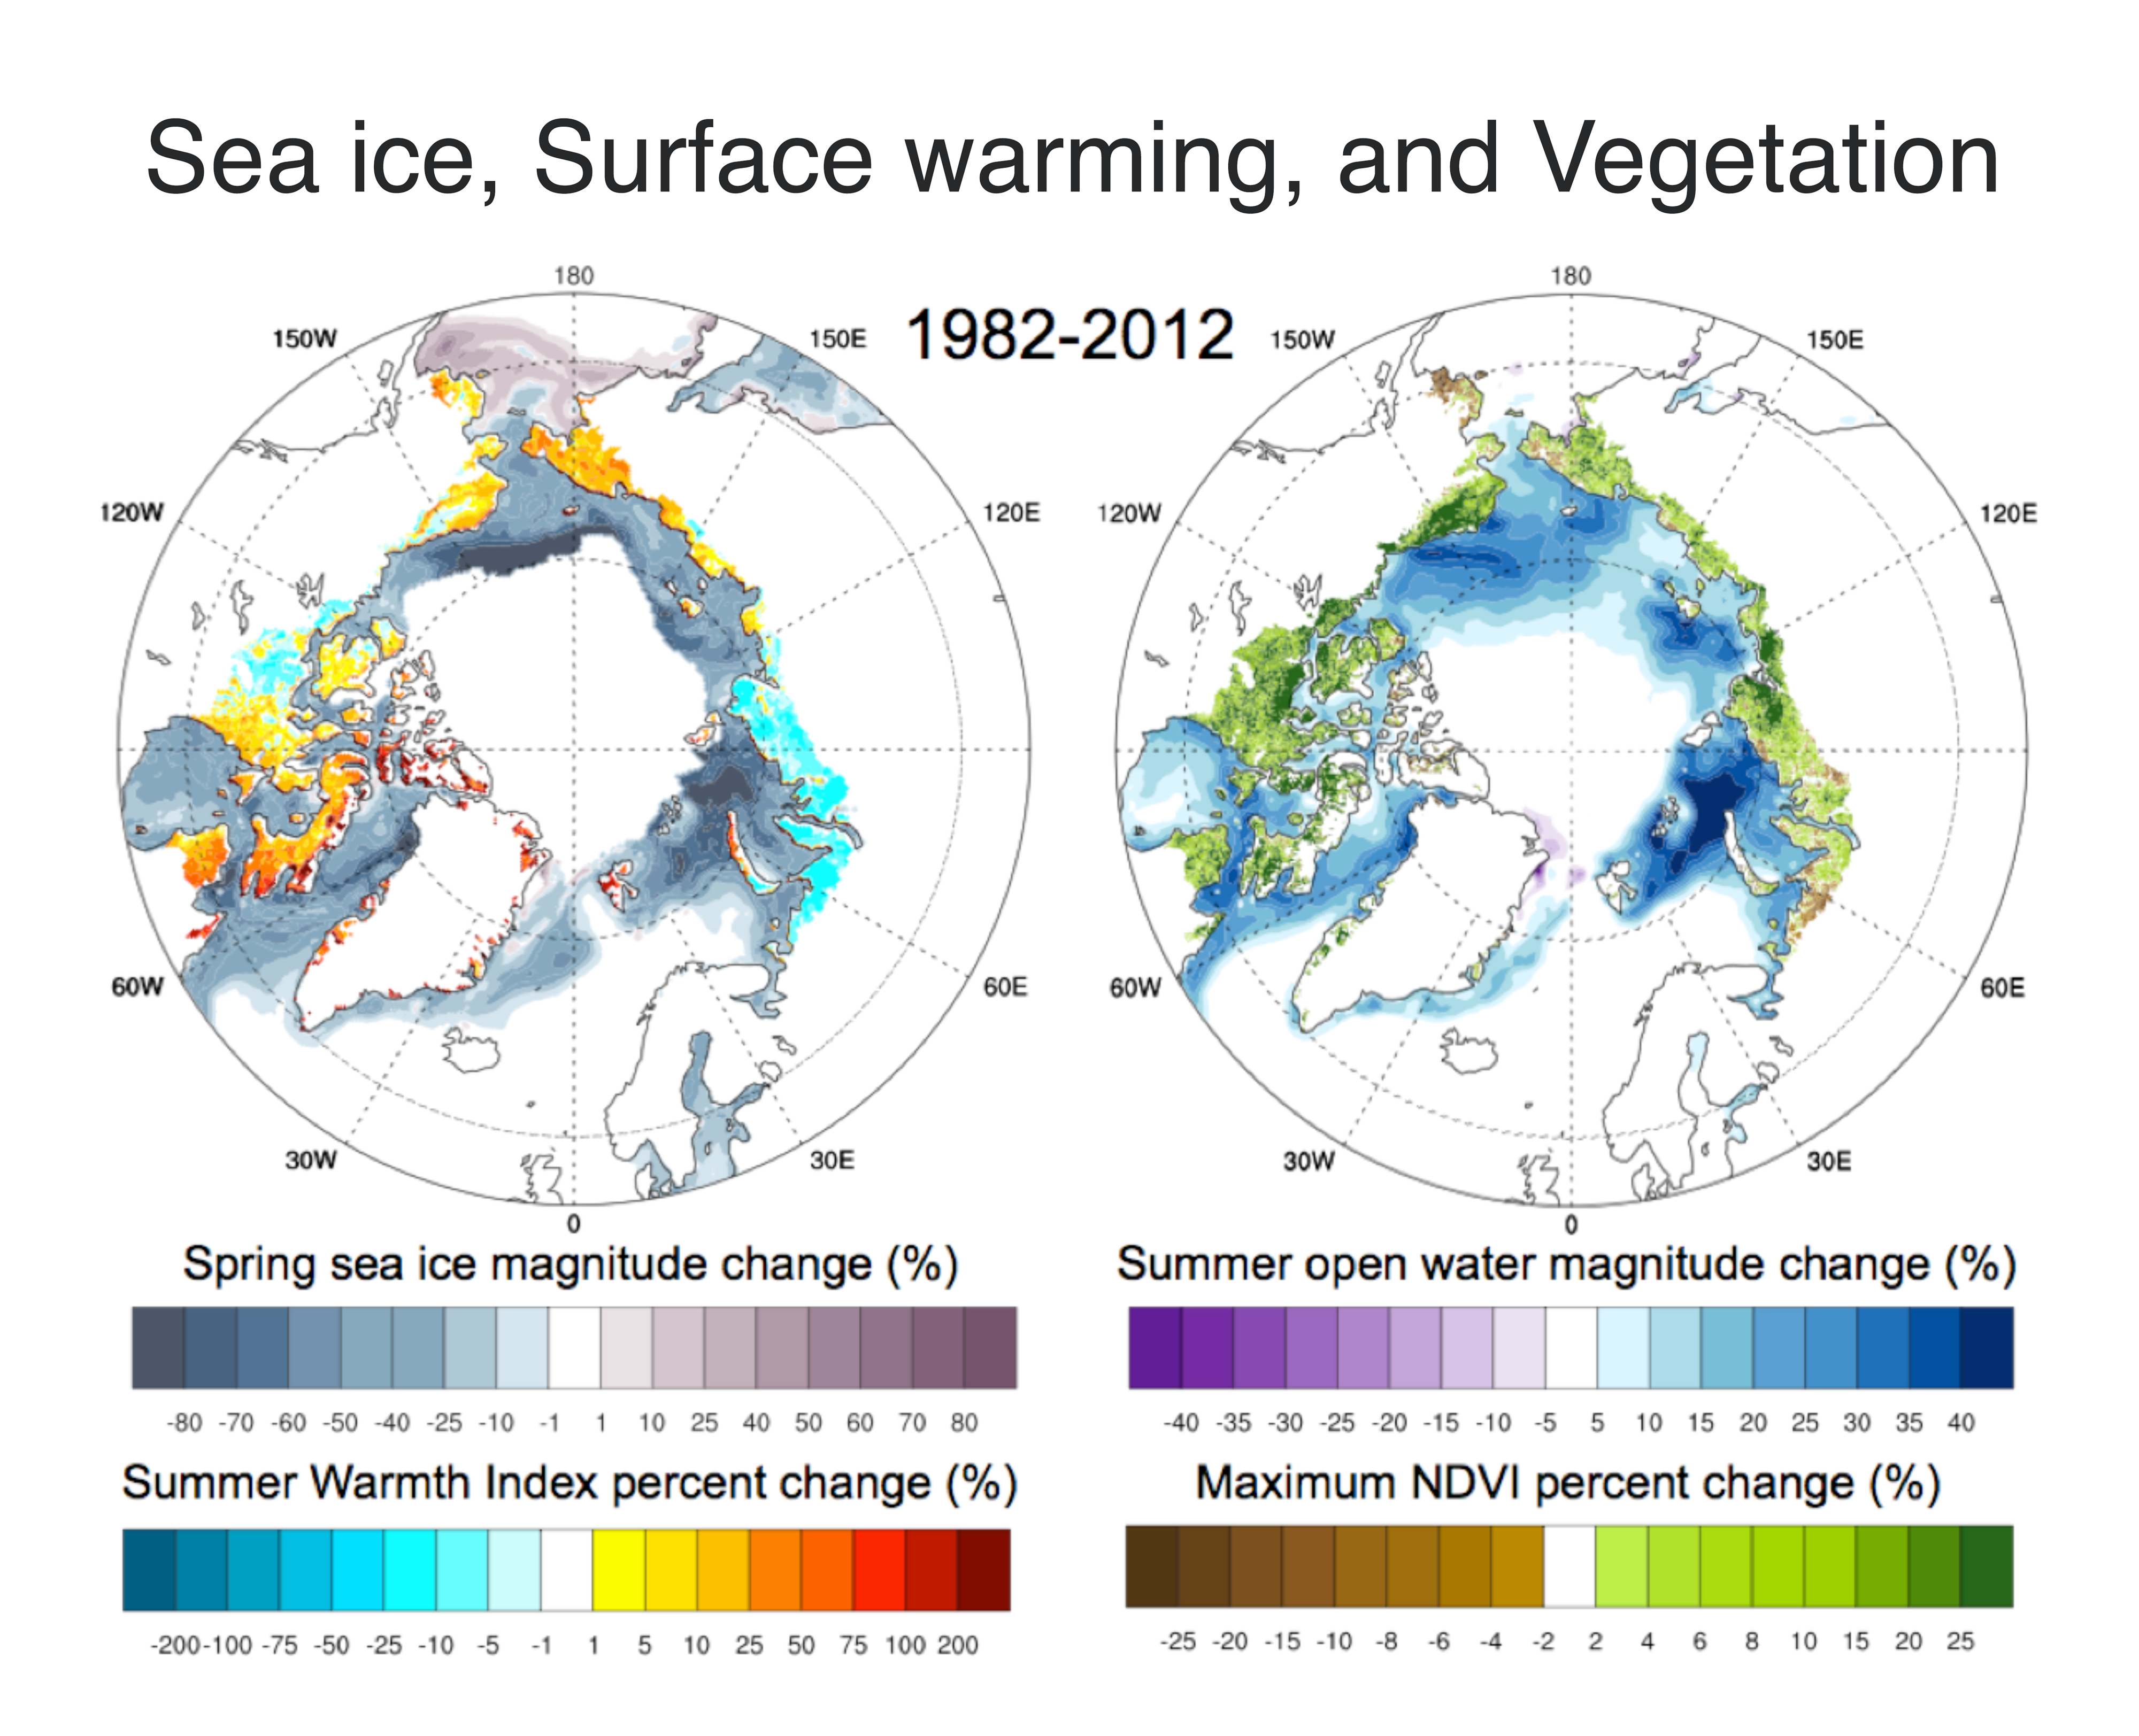
Figure 5. These charts show trends in spring sea ice, land surface warmth, open water area, and vegetation from 1982 to 2012. The percent trend highlights the size of relative changes in the Arctic. Sea ice (top left) is shown as percent concentration; land surface temperature (top right) is expressed as summer warmth index (SWI); open water (bottom left) is expressed as percent of area; and vegetation (bottom right) is shown as Maximum Normalized Difference Vegetation Index (MaxNDVI). Data are derived from AVHRR.
Credit: U.S. Bhatt
High-resolution image
However, the same data offer a few puzzles. While land surface warming and vegetation cover have steadily increased in the vicinity of Greenland over the last thirty years, warming and vegetation have actually decreased in some parts of Eurasia over the last decade. This suggests that once sea ice declines or the climate warms beyond a limit, other processes begin to play a more central role in summer climate variability, such as moisture availability in the soil or cloudiness, which can lead to cooler conditions during the northern summer. Another mystery is the decline in vegetation cover over the southwest Alaskan tundra despite an increase in land surface temperature over the same period. Researchers are looking into these puzzles as they think ahead to what the tundra may look like in a future of ice-free summers.
Further reading
Bhatt, U.S., D.A. Walker, M.K. Raynolds, P.A. Bieniek, H.E. Epstein, J.C. Comiso, J.E. Pinzon, C.J. Tucker, and I.V. Polyakov. 2013. Recent Declines in Warming and Arctic Vegetation Greening Trends over Pan-Arctic Tundra. Remote Sensing (Special NDVI3g Issue), 5, 4229-4254; doi:10.3390/rs5094229.
Bhatt, U.S., D.A. Walker, M.K. Raynolds, J.C. Comiso, H.E. Epstein, G. Jia, R. Gens, J.E. Pinzon, C.J. Tucker, C.E. Tweedie, and P.J. Webber. 2010. Circumpolar Arctic tundra vegetation change is linked to sea-ice decline. Earth Interactions. August 2010, Vol. 14, No. 8: 1-20. doi: 10.1175/2010EI315.1.
Raynolds, M.K., Walker, D.A. & Maier, H.A. 2006. NDVI patterns and phytomass distribution in the circumpolar Arctic. Remote Sens. Environ. 102: 271-281.
Walker, D.A. et al. 2005. The Circumpolar Arctic Vegetation Map. J. Veg. Sci., 16, 267–282.

