After starting the year with record lows in January and February, Arctic sea ice extent ended tied with 2008 for the sixth lowest average September extent in the satellite record. The 2018 minimum extent was reached on both September 19 and 23. September 23 is among the latest dates for the seasonal minimum in the nearly 40-year satellite record. In the Antarctic, the annual maximum extent appears to have been reached on October 2.
Overview of conditions

Figure 1. Arctic sea ice extent for September 2018 was 4.71 million square kilometers (1.82 million square miles). The magenta line shows the 1981 to 2010 average extent for the month. Sea Ice Index data. About the data
Credit: National Snow and Ice Data Center
High-resolution image
Arctic sea ice extent for September 2018 averaged 4.71 million square kilometers (1.82 million square miles), tying with 2008 for the sixth lowest September in the 1979 to 2018 satellite record. This was 1.70 million square kilometers (656,000 square miles) below the 1981 to 2010 average, and 1.14 million square kilometers (440,000 square miles) above the record low recorded for September 2012. Prior to September 19, sea ice extent declined at a relatively rapid 14,440 square kilometers (5,580 square miles) per day, significantly faster than in most years. The near-zero loss rate between September 19 and 23, and the very late onset of significant seasonal ice growth after September 23, were atypical of the satellite record.
Sea ice loss during the first half of September primarily occurred within the East Siberian, northern Laptev, and northern Chukchi Seas, in part because winds from the south brought warm air into the region and inhibited ice from drifting or growing southward. Retreat in these areas was partially offset by ice expansion in the eastern Beaufort Sea and the northern Kara and Barents Seas. The old ice that had been persisting in the Beaufort Sea near Prudhoe Bay mostly melted out by the end of September. While the Northern Sea Route opened again this year, as it has every year since 2008, ice lingered in the central section of the southern route of the Northwest Passage between Bellot Strait and Gjoa Haven.
Since the seasonal minimum extent, reached on September 19 and again on September 23 at 4.59 million square kilometers (1.77 million square miles), ice cover has expanded in the Canadian Archipelago, the northern Chukchi and Beaufort Seas, and the East Greenland Sea, while retreating slightly within the Kara Sea.
Conditions in context
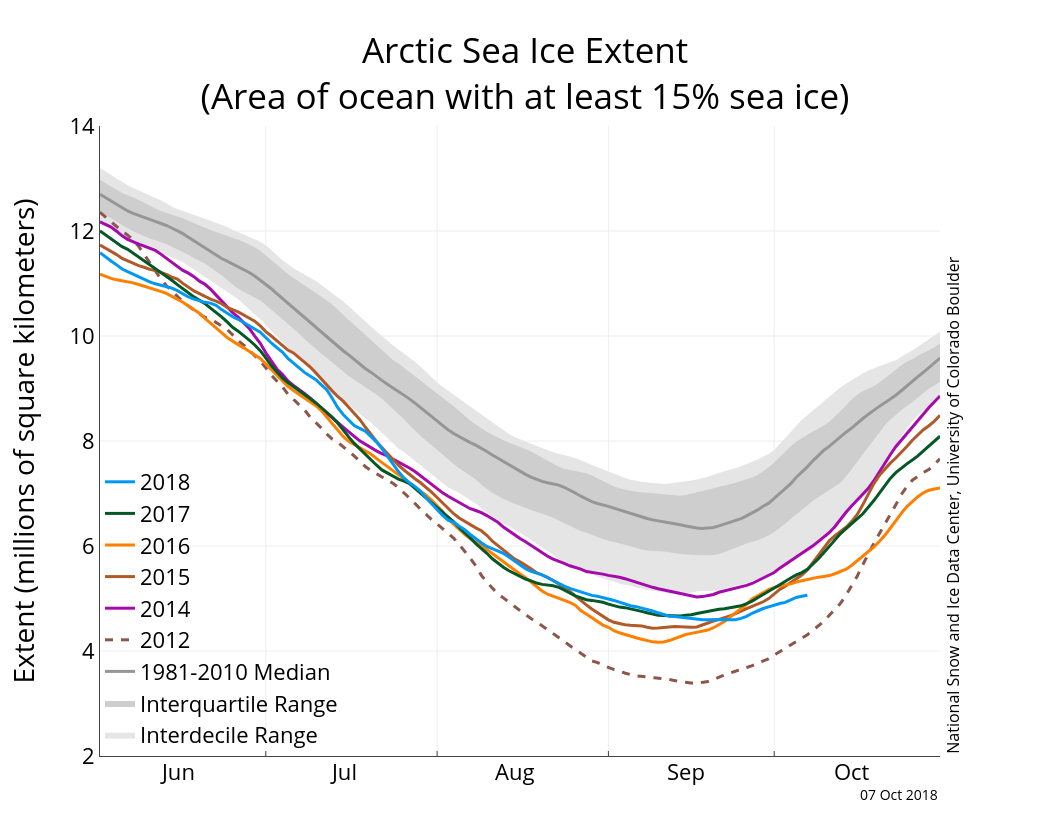
Figure 2a. The graph above shows Arctic sea ice extent as of October 07, 2018, along with daily ice extent data for four previous years and the record low year. 2018 is shown in blue, 2017 in green, 2016 in orange, 2015 in brown, 2014 in purple, and 2012 in dotted brown. The 1981 to 2010 median is in dark gray. The gray areas around the median line show the interquartile and interdecile ranges of the data. Sea Ice Index data.
Credit: National Snow and Ice Data Center
High-resolution image

Figure 2b. This plot shows the difference from average air temperature in the Arctic at the 925 hPa level, in degrees Celsius, for September 2018. Yellows and reds indicate higher than average temperatures; blues and purples indicate lower than average temperatures.
Credit: NSIDC courtesy NOAA Earth System Research Laboratory Physical Sciences Division
High-resolution image
September air temperatures at the 925 hPa level (about 2,500 feet above the surface) were from 3 to 8 degrees Celsius (5 to 14 degrees Fahrenheit) above average over the western Beaufort, Chukchi, and East Siberian Seas. As noted above, this delayed the seasonal onset of ice growth in these areas, seen in the late timing of the seasonal sea ice minimum for the Arctic as a whole, and the near-zero change in ice extent over the period September 19 to 23.
A very pronounced high pressure ridge contributed to this unusual warmth. The Capital Weather Gang reports that the high pressure ridge, which formed over the Bering Sea in early September, drifted eastward, became especially pronounced late in the month, and then expanded into the Beaufort and Chukchi Seas. This contributed to the slow freeze up after the minimum. Sunny, warm, and dry conditions spread across much of Alaska. Anchorage, Alaska experienced its warmest September on record. Air motion under a pressure ridge tends to be downwards, inhibiting the formation of clouds, rainfall, or snowfall.
September 2018 compared to previous years
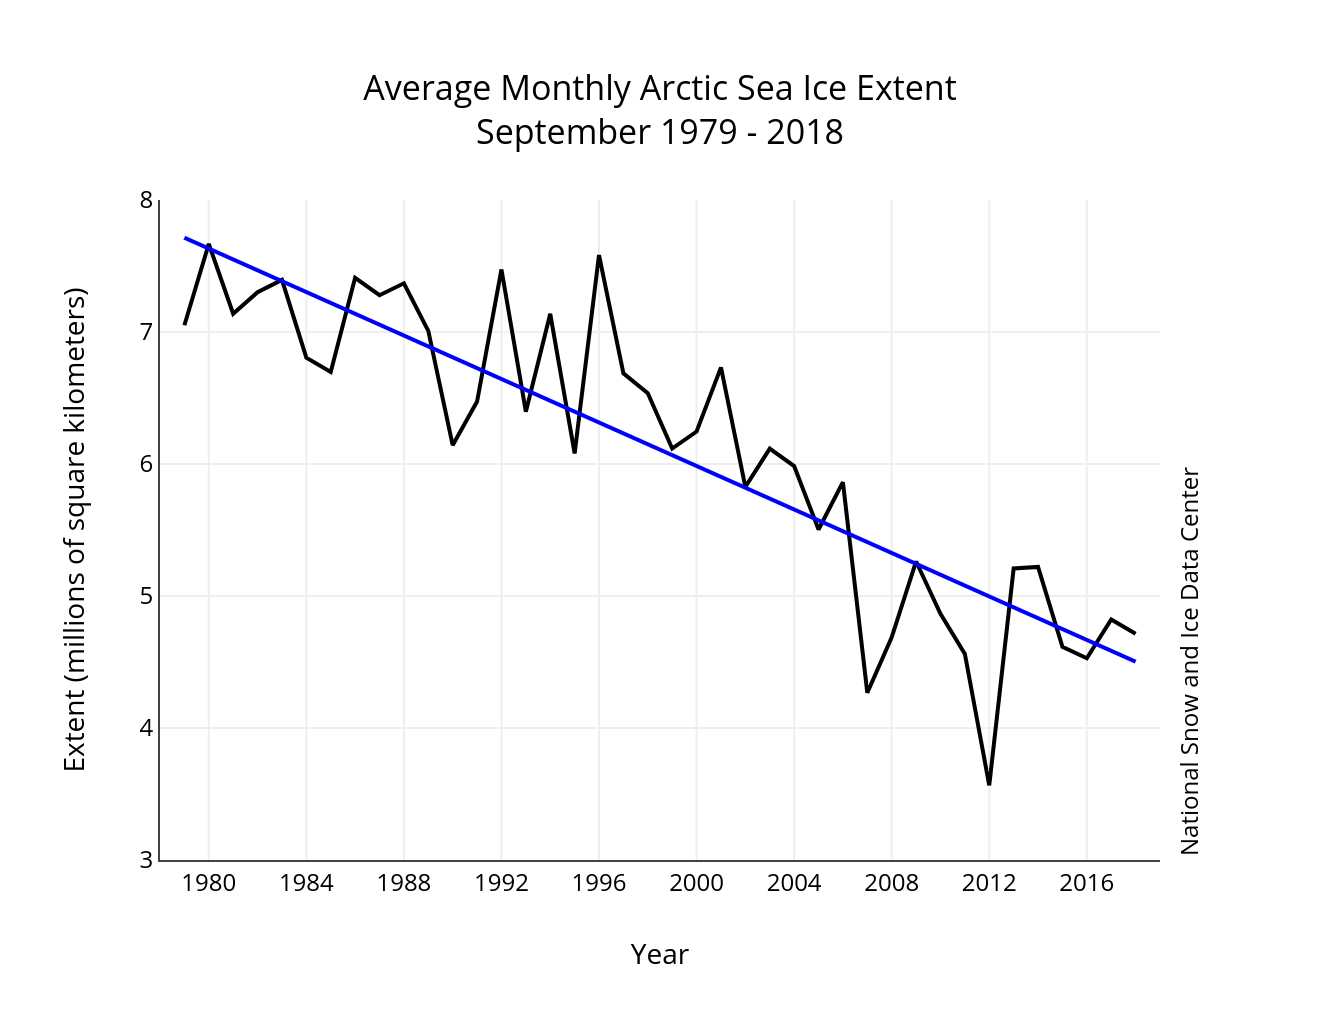
Figure 3. Monthly September ice extent for 1979 to 2018 shows a decline of 12.8 percent per decade.
Credit: National Snow and Ice Data Center
High-resolution image
Sea ice extent for September 2018 fell just above the long-term linear trend line. The linear rate of sea ice decline for September is 82,300 square kilometers (32,000 square miles) per year, or 12.8 percent per decade relative to the 1981 to 2010 average.
A look back at the summer melt season
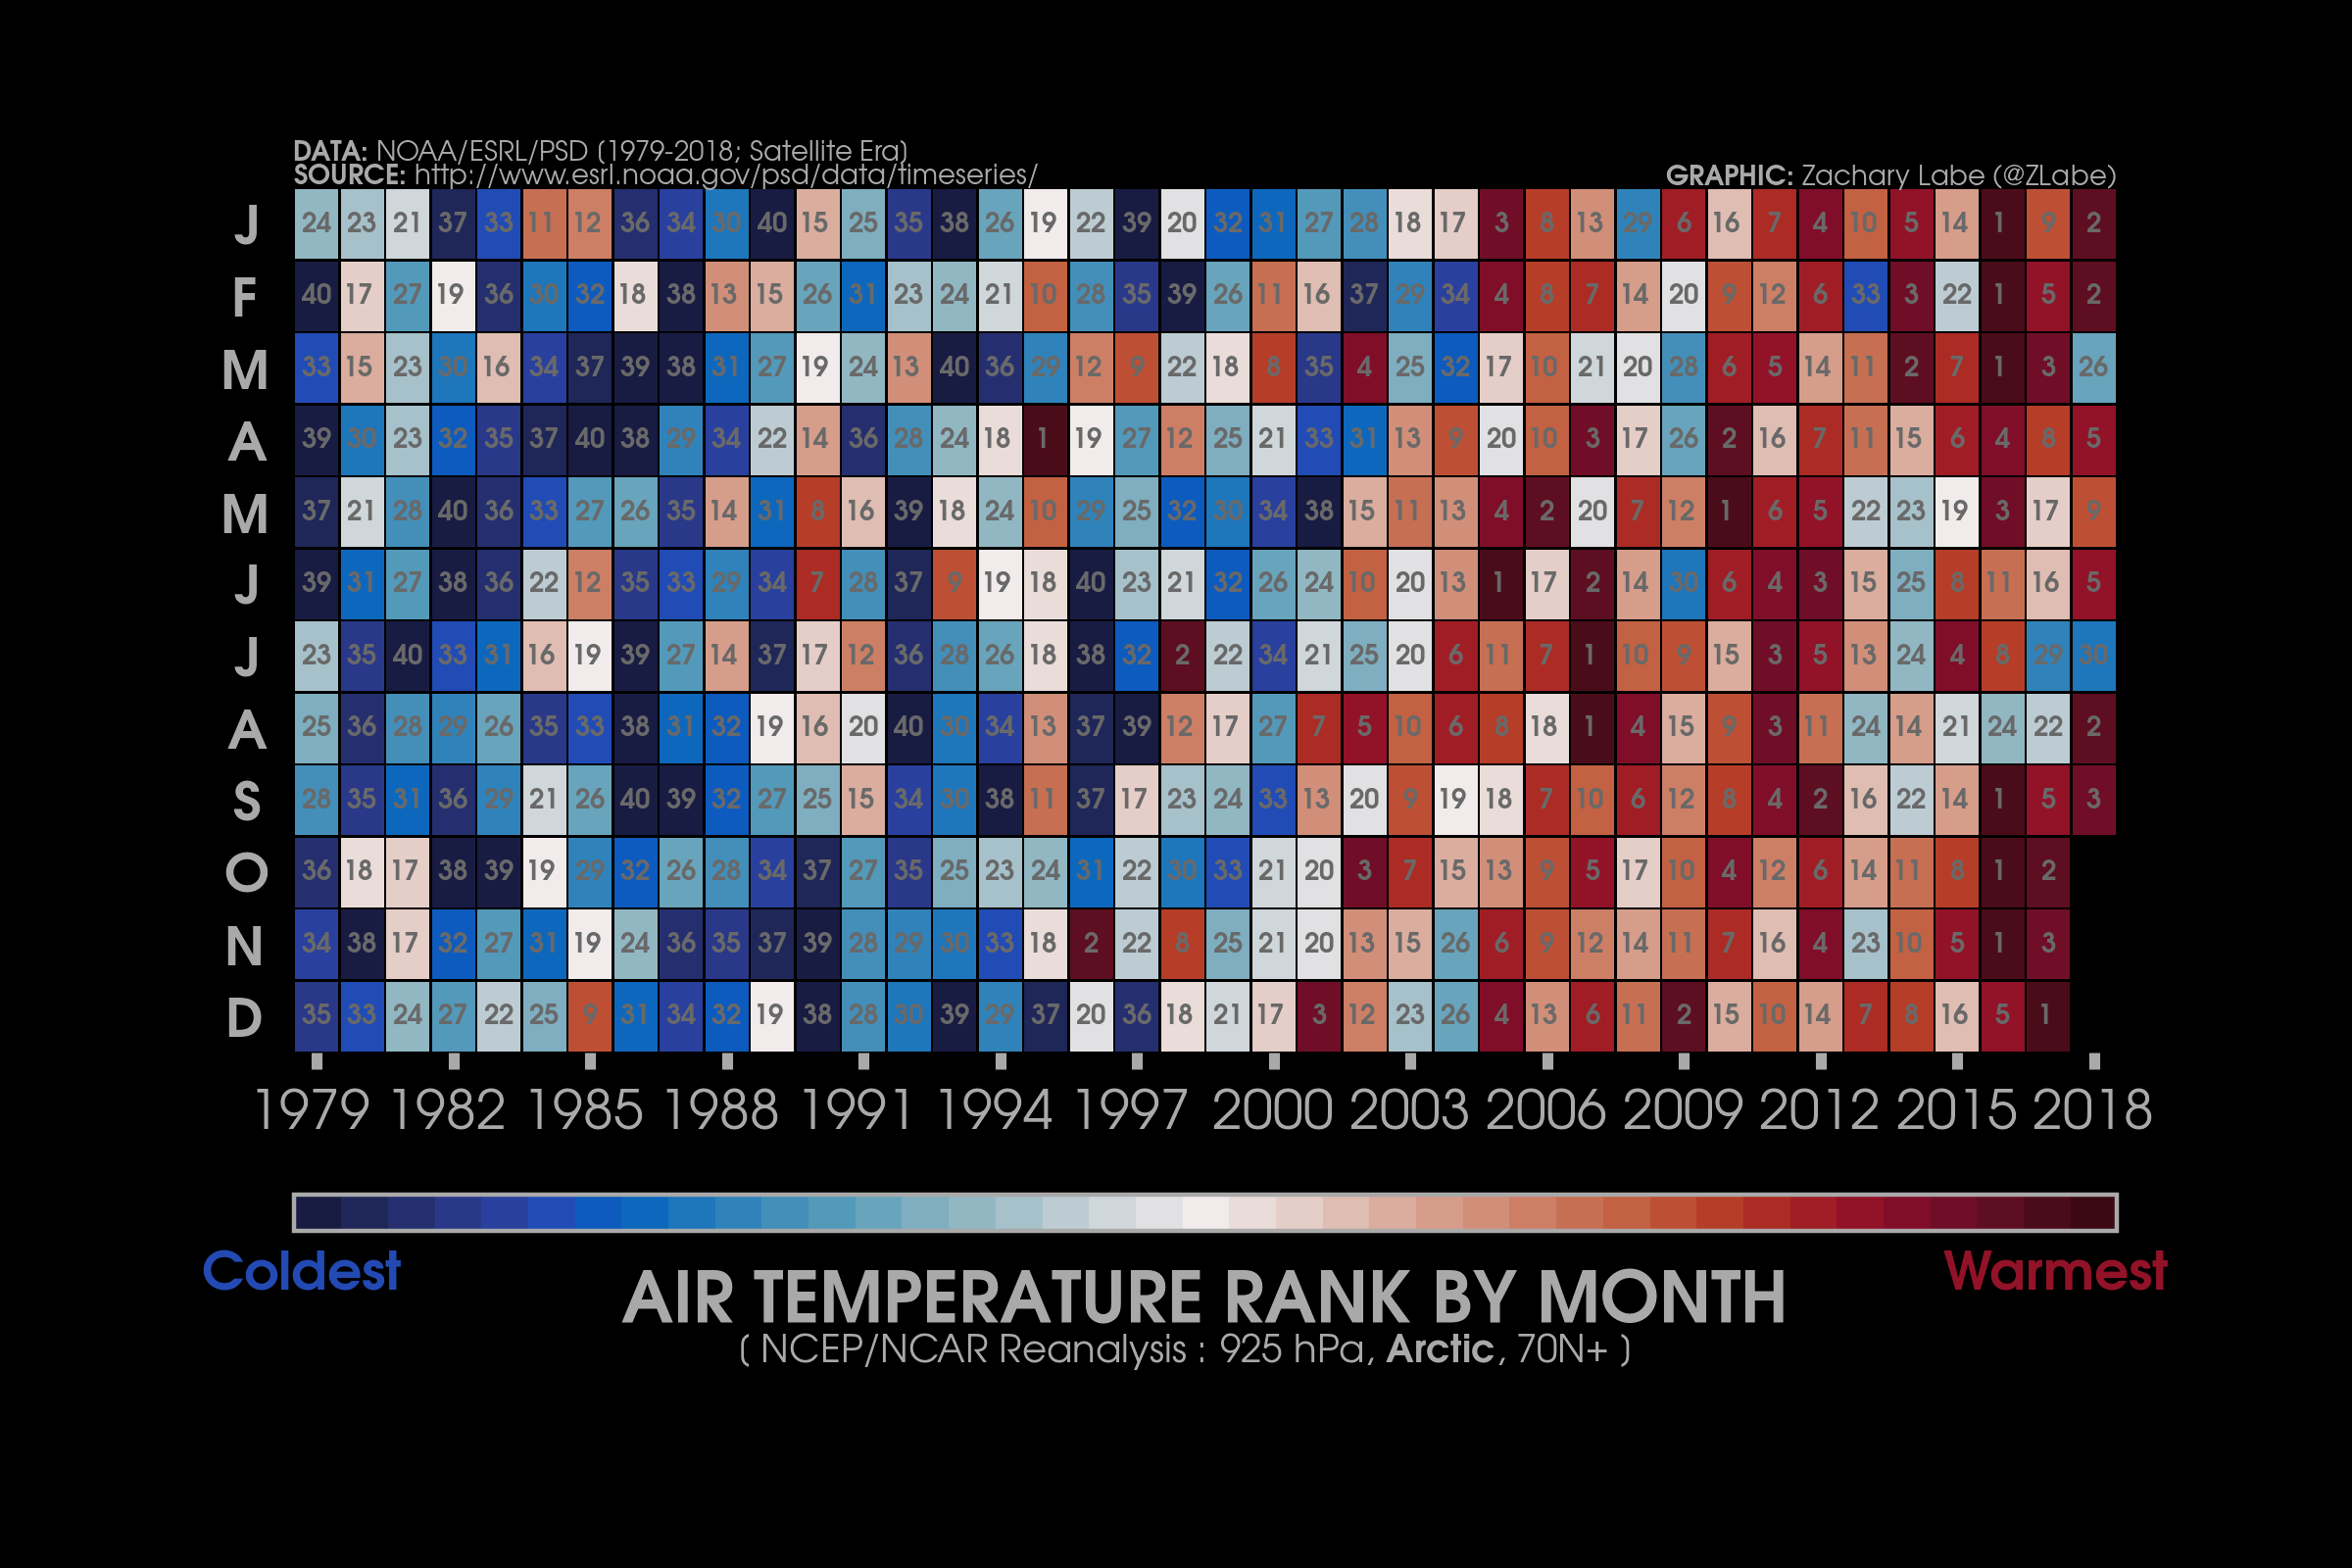
Figure 4a. This graphic ranks months based on their Arctic air temperature from 1979 to 2018 at 925 hPa from the National Centers for Environmental Prediction/National Center for Atmospheric Research (NCEP/NCAR) Reanalysis for all areas north of 70 degrees N. Dark reds indicate warmest months; dark blues indicate coldest months.
Credit: Z. Labe, University of California, Irvine
High-resolution image
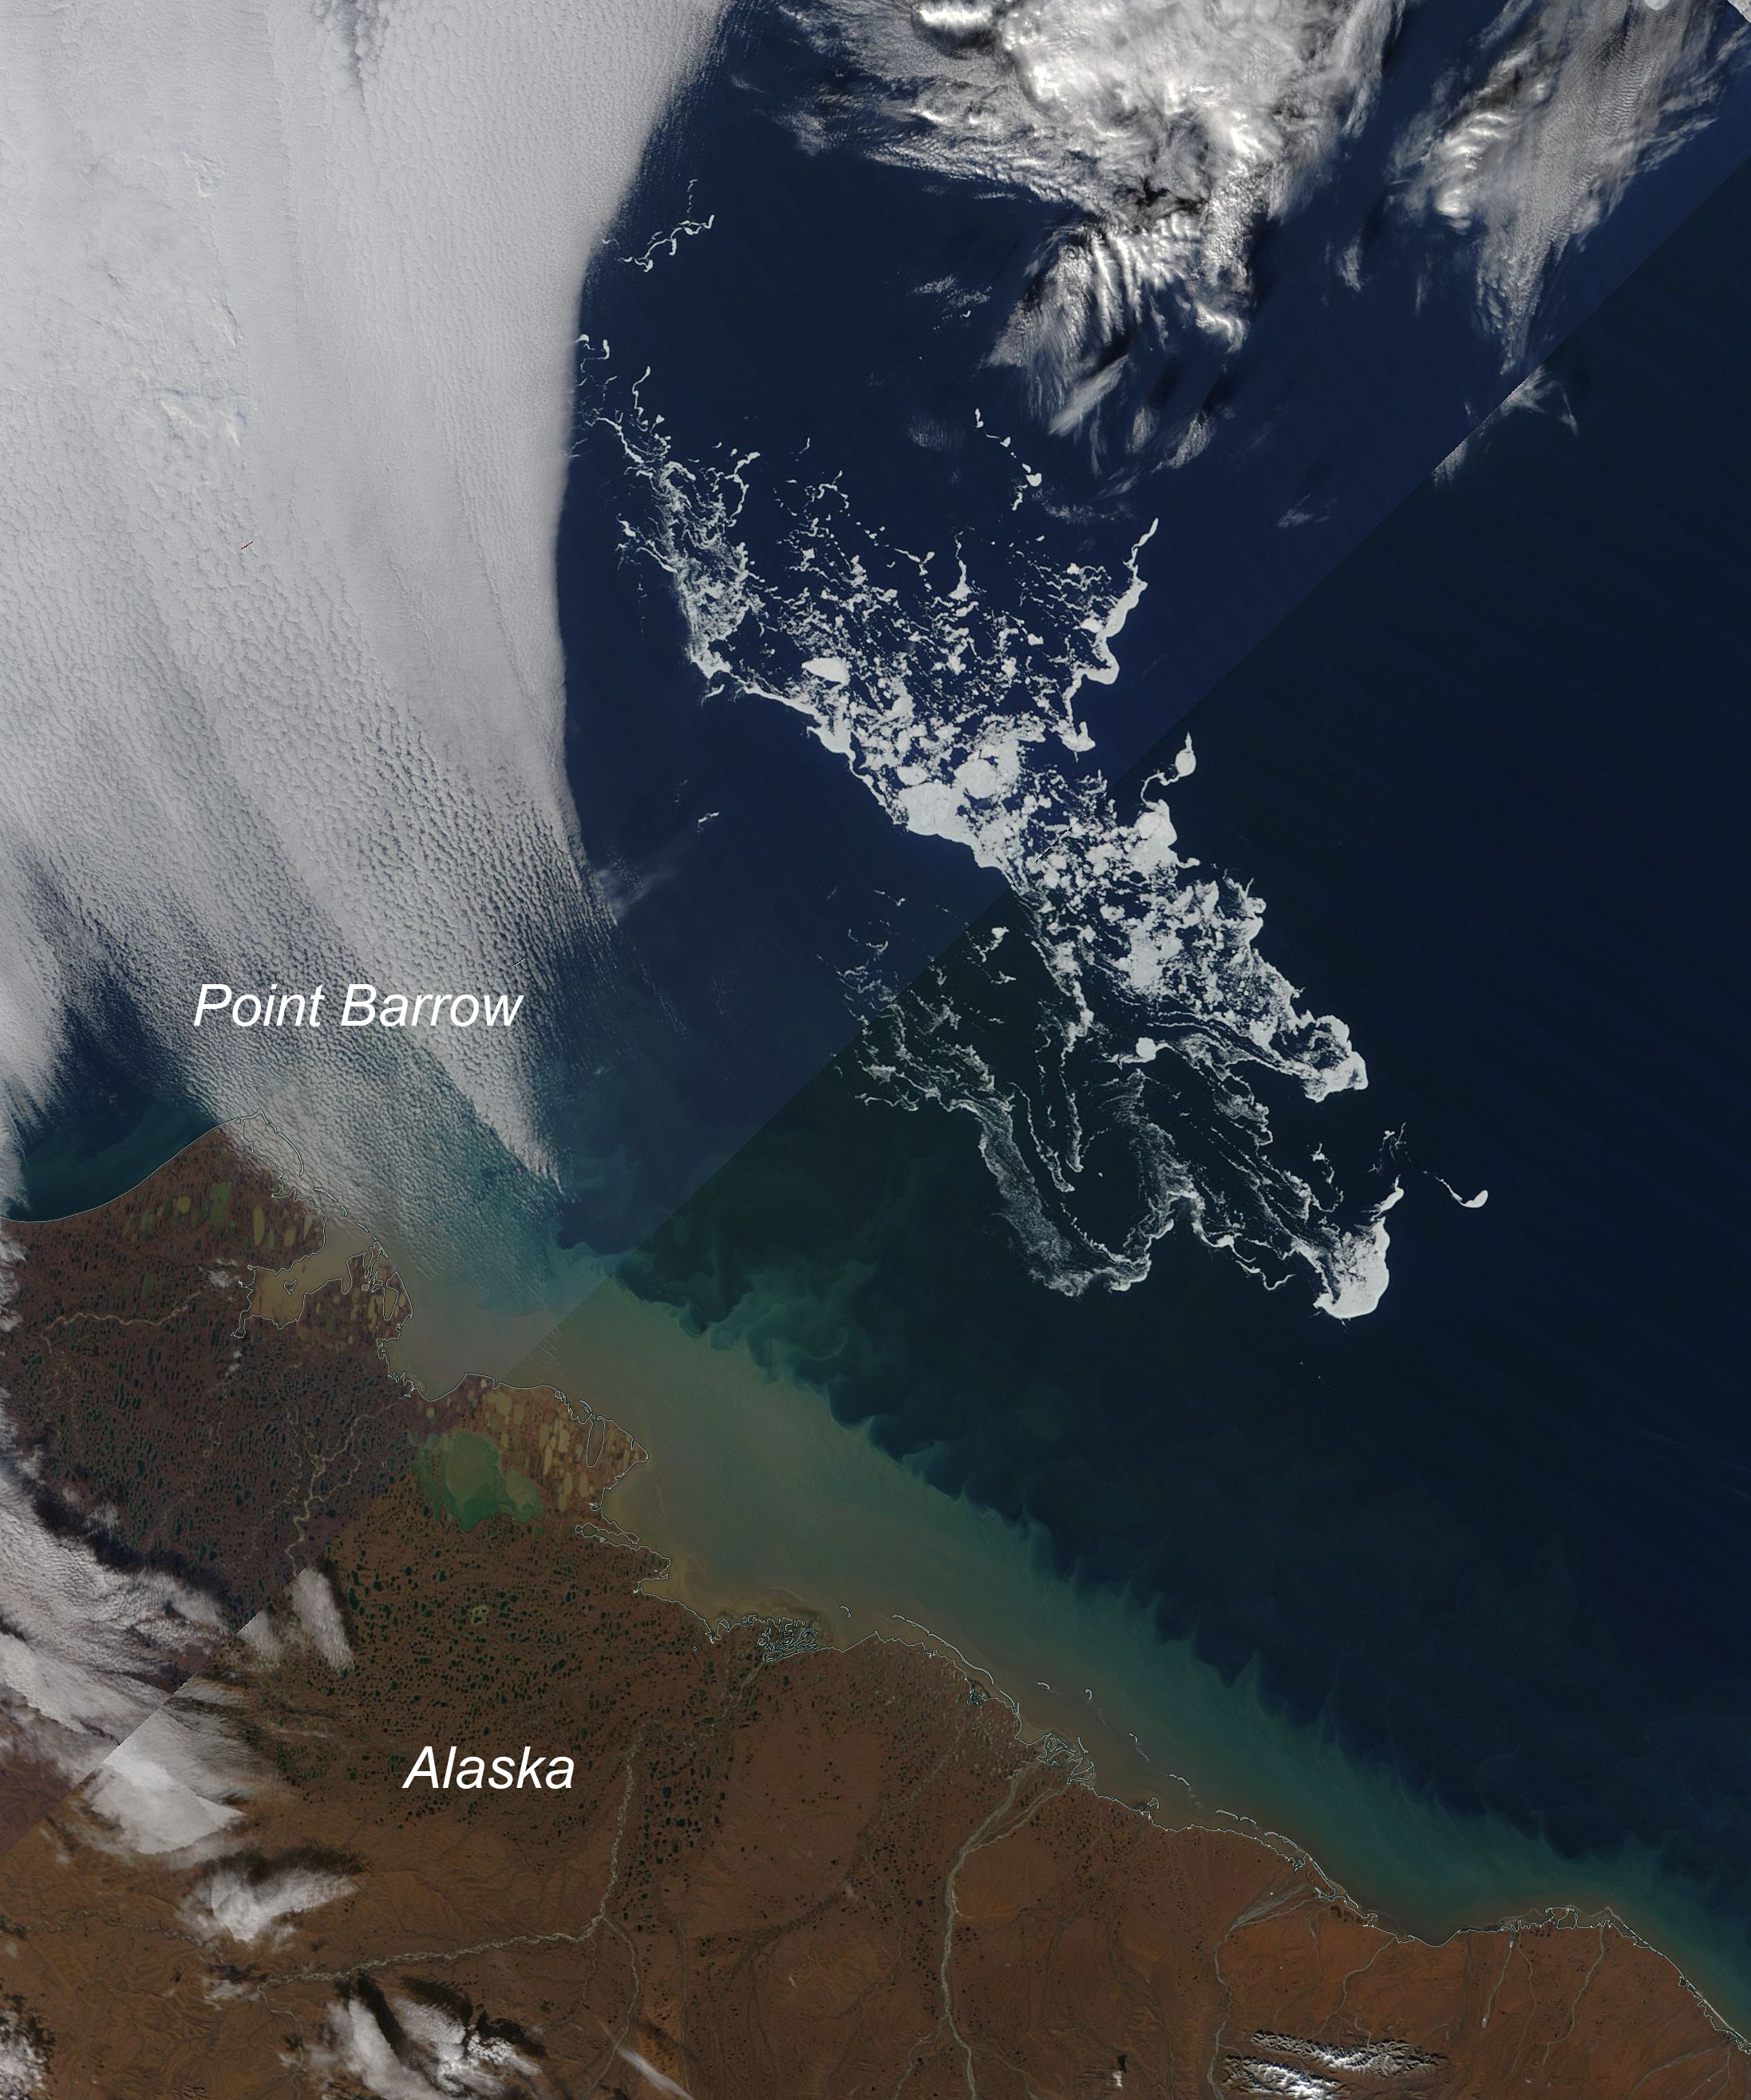
Figure 4b. This true color composite shows the patch of sea ice off Point Barrow, north of Utqiaġvik, Alaska, taken by the Moderate Resolution Imaging Spectroradiometer (MODIS) sensor on the NASA Terra satellite on September 19, 2018.
Credit: NASA Worldview
High-resolution image
Total sea ice extent reached record lows in January and February, and stayed at second lowest from March through May, largely due to extremely low extent in the Bering Sea. However, the September extent tied for sixth lowest in the record, slightly above the long-term trend line.
Melt began slowly over most of the western Arctic Ocean and the East Siberian Sea. As a result, despite June temperatures that were slightly above average (Figure 4a), the rate of ice loss in June of 52,800 square kilometers (20,000 square miles) per day was slightly below the 1981 to 2010 average of 56,300 square kilometers (22,000 square miles) per day. A cloudy and cool July followed, especially over the East Siberian Sea and stretching westward towards the Kara Sea. In response, ice was particularly slow to retreat in the East Siberian Sea. Indeed, July ranked as the ninth coldest July since 1979.
Puzzling in this regard is that the July ice decline rate of 105,400 square kilometers (41,000 square miles) per day, was considerably faster than the 1981 to 2010 average decline of 86,800 square kilometers (34,000 square miles) per day. Only in 2007 and 2009 did July have faster rates of ice loss. This is counter intuitive, and likely illustrates the importance of atmospheric processes in transporting ice northwards, and the role of ocean warmth in melting ice.
While July is usually the warmest month of the year, air temperatures this August exceeded those in July. This has only happened once before in the last 70 years, according to analysis of data from the National Centers for Environmental Prediction/National Center for Atmospheric Research (NCEP/NCAR) Reanalyses. August air temperatures at the 925 hPa level were up to 5 degrees Celsius (9 degrees Fahrenheit) above average in the Laptev Sea. Still, the August ice loss of 57,500 square kilometers (22,000 square miles) per day was nearly identical to the 1981 to 2010 average decline. The large tongue of ice that had been persisting within the East Siberian Sea started to melt out. Above average air temperatures continued through early September, especially in the East Siberian Sea, which helped to further melt sea ice that had persisted all summer. By the end of the melt season, about 267,000 square kilometers (103,000 square miles) of ice remained in this sector. The least amount of sea ice within the East Siberian Sea was recorded in 2007 (2,980 square kilometers or 1,150 square miles). As discussed above, the late date of the sea ice minimum and the near-zero change in ice extent from September 19 to 23 reflects the influence of the very warm conditions associated with the high pressure ridge.
A patch of sea ice remained through the summer in the Beaufort Sea, northeast of Point Barrow, consisting of first-year ice interspersed with floes of more resistant multiyear ice. This patch was no longer detected in the passive microwave imagery once it became too sparse. However, ice was still evident through the end of the melt season in visible imagery from the Moderate Resolution Imaging Spectroradiometer (MODIS) (Figure 4b) and was charted in operational analyses from the Multisensor Analyzed Sea Ice Extent (MASIE).
In short, the reasons why September sea ice extent for 2018 ended up as sixth lowest, well above 2007 and 2012, remains to be fully determined. Melt onset was somewhat late, but despite cool conditions the July ice loss was rather rapid. The ice loss rate in August was near average. Further research is warranted.
The importance of ice age
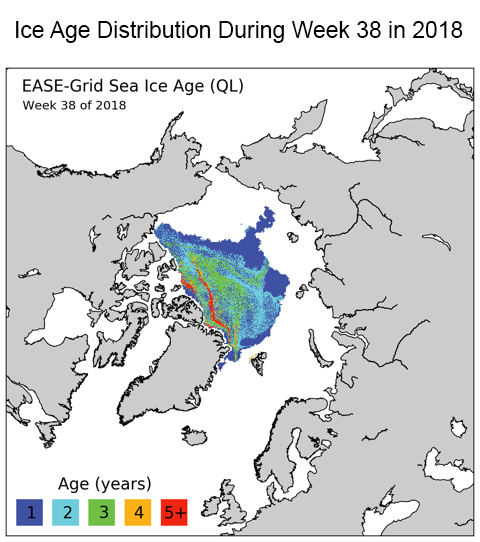
Figure 5a. This map shows sea ice age category during week 38 in 2018, showing the origin of the patch of ice in the Beaufort Sea and the last remnant. The age category value designates the maximum age of that ice. Click here for the full animation.
Credit: M. Tschudi, S. Stewart, University of Colorado, Boulder, and W. Meier, J. Stroeve, NSIDC
High-resolution image
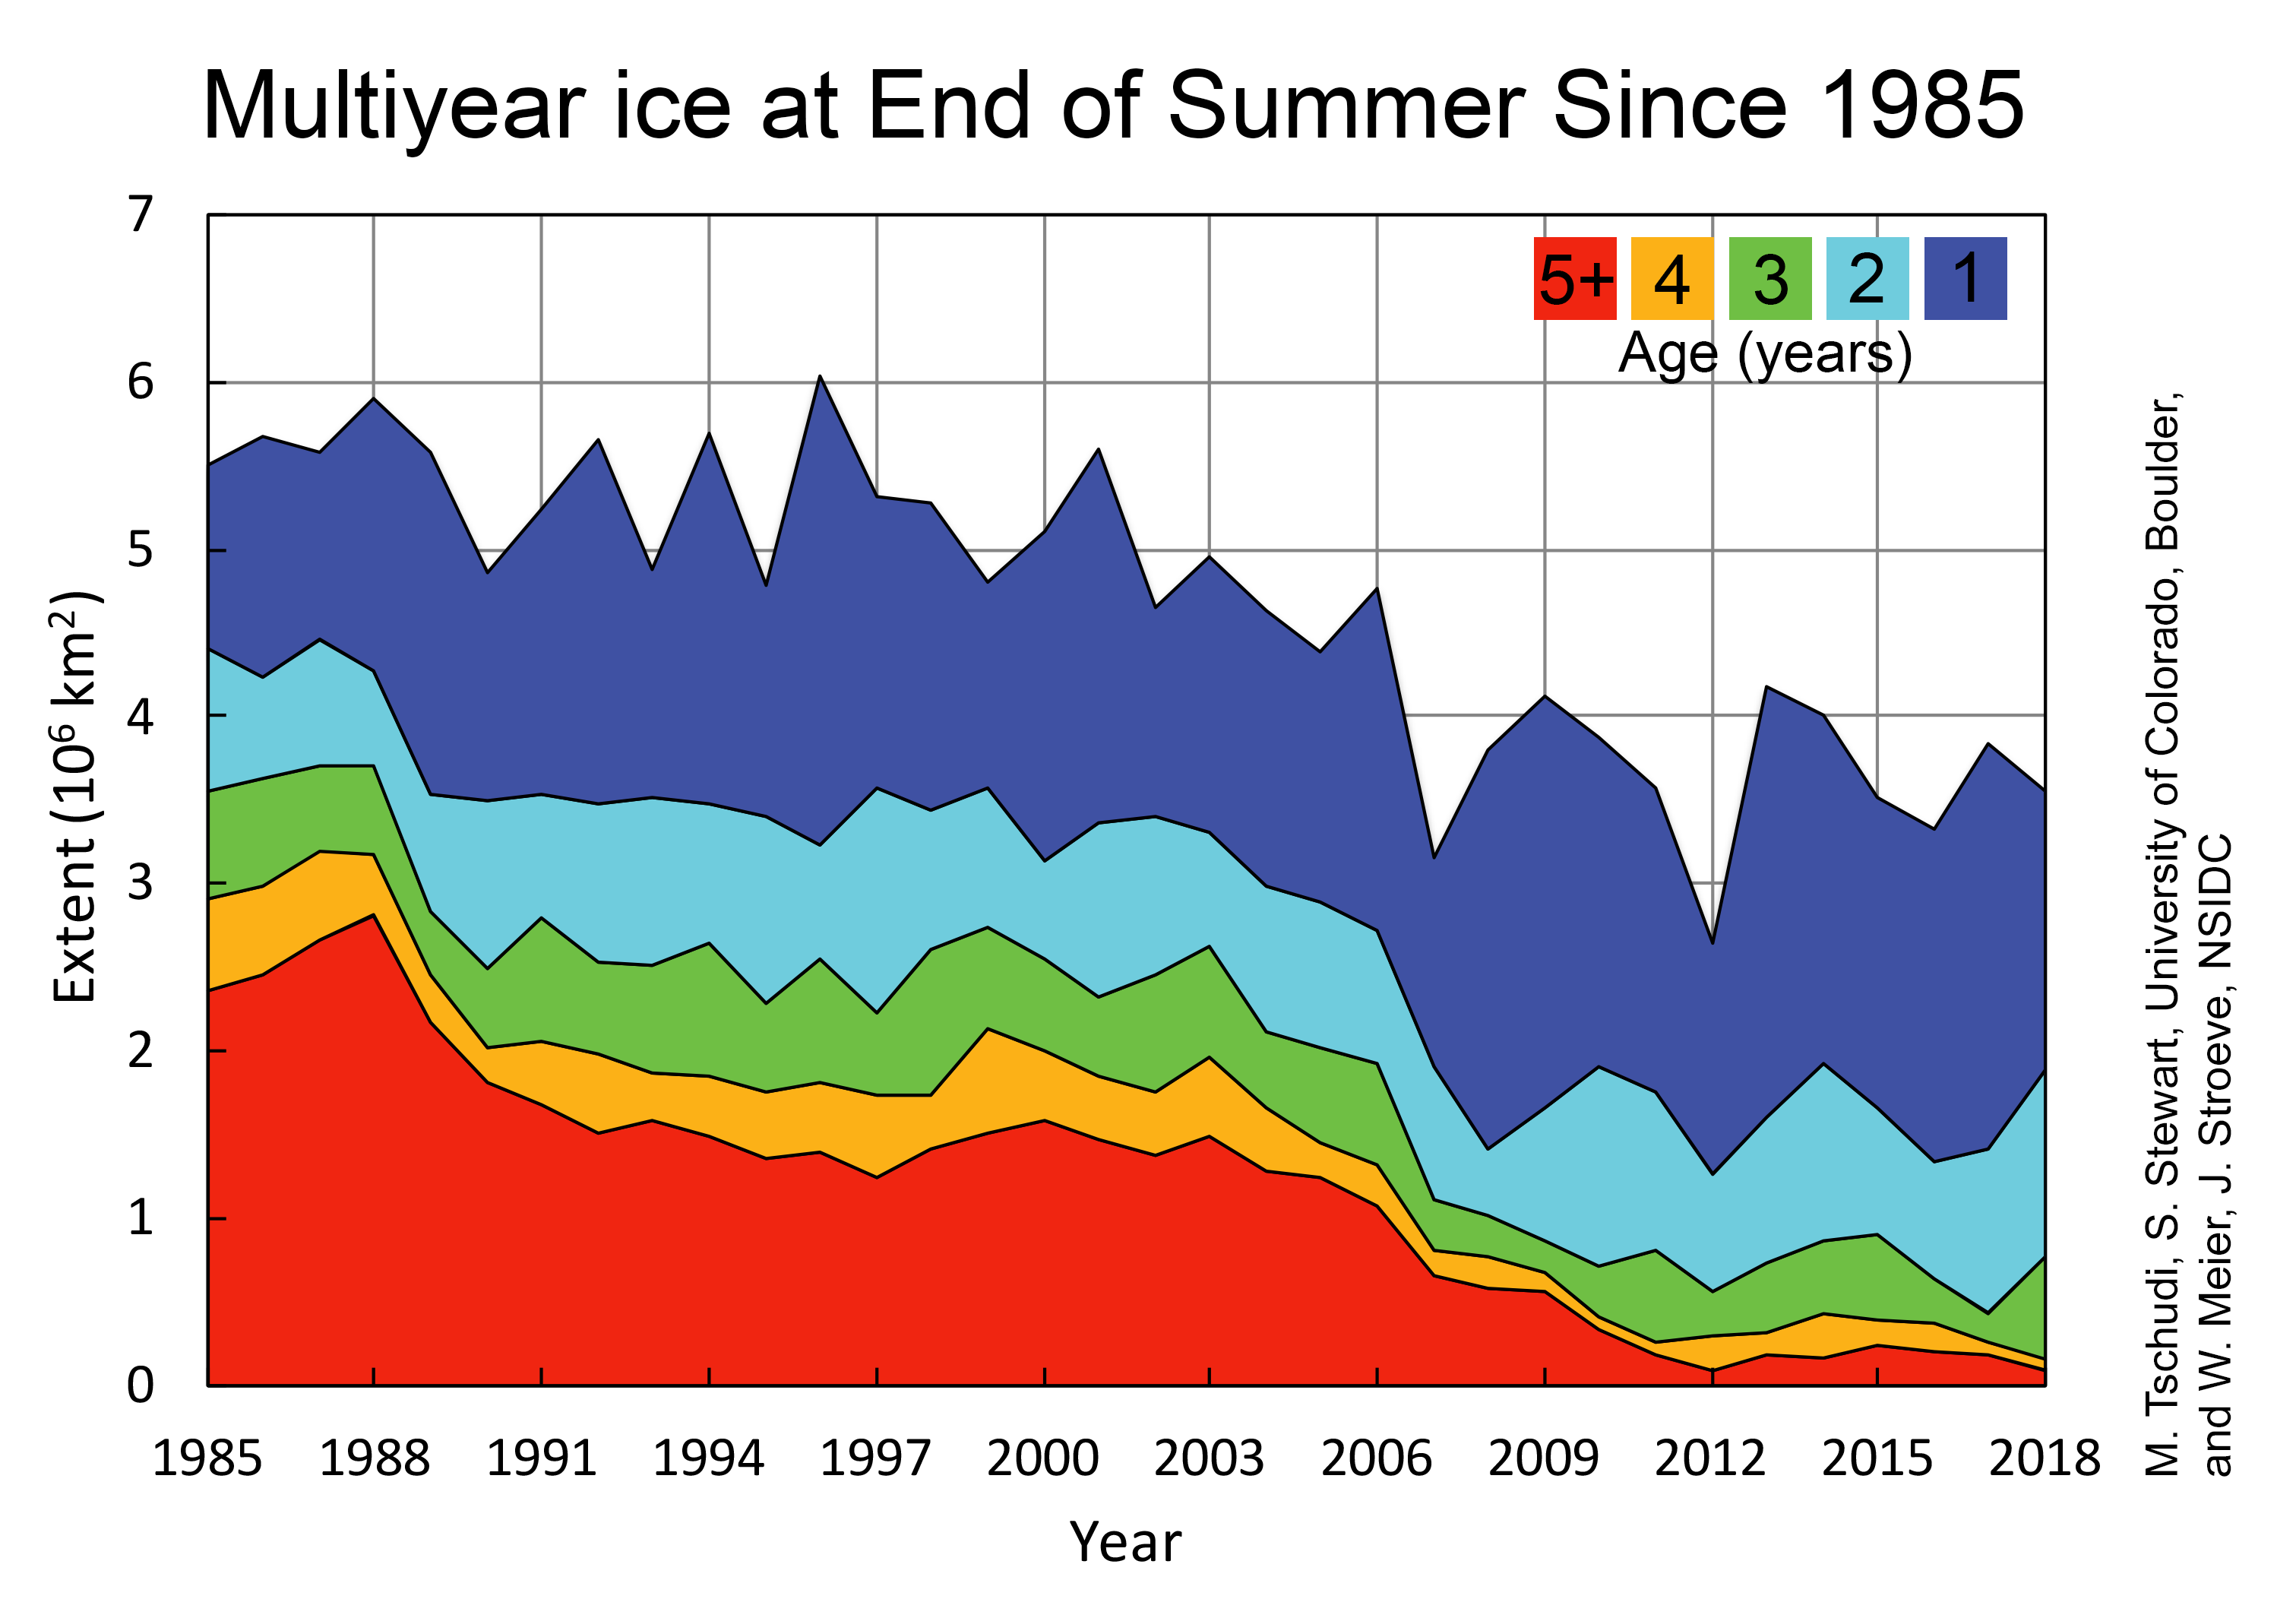
Figure 5b. This time series shows multiyear ice at the end of each summer melt season since 1985. Note that these images are based on an updated soon-to-be-released version of the current sea ice age product and a near-real-time version for 2018.
Credit: M. Tschudi, S. Stewart, University of Colorado, Boulder, and W. Meier, J. Stroeve, NSIDC
High-resolution image
Over a winter season, first-year ice can grow up to 1.5 to 2 meters (4.9 to 6.6 feet) thick. Ice that survives the summer season can grow through the next winter by ridging and rafting and additional thermodynamic ice growth to well over 3 meters (9.8 feet) thick. Multiyear ice has a better chance of surviving the following melt season. Multiyear ice moved into the Beaufort Sea from the northwest through the spring and summer as part of the Beaufort Gyre—a clockwise circulation of ice centered over the northern Beaufort Sea (Figure 5a). By contrast, the tongue of ice in the East Siberian Sea largely consisted of first-year ice. Overall, the amount of multiyear ice remaining at the end of summer (Figure 5b) is considerably lower than it used to be during the 1980s and 1990s. Now multiyear ice covers 2 million square kilometers (772,000 square miles) or less of the Arctic Ocean. The oldest ice, which has survived at least four melt seasons, used to cover nearly 1.5 million square kilometers (579,000 square miles). In 2018, this old ice covered only 94,000 square kilometers (36,0000 square miles) at the September minimum.
Antarctica’s wandering path to its seasonal maximum
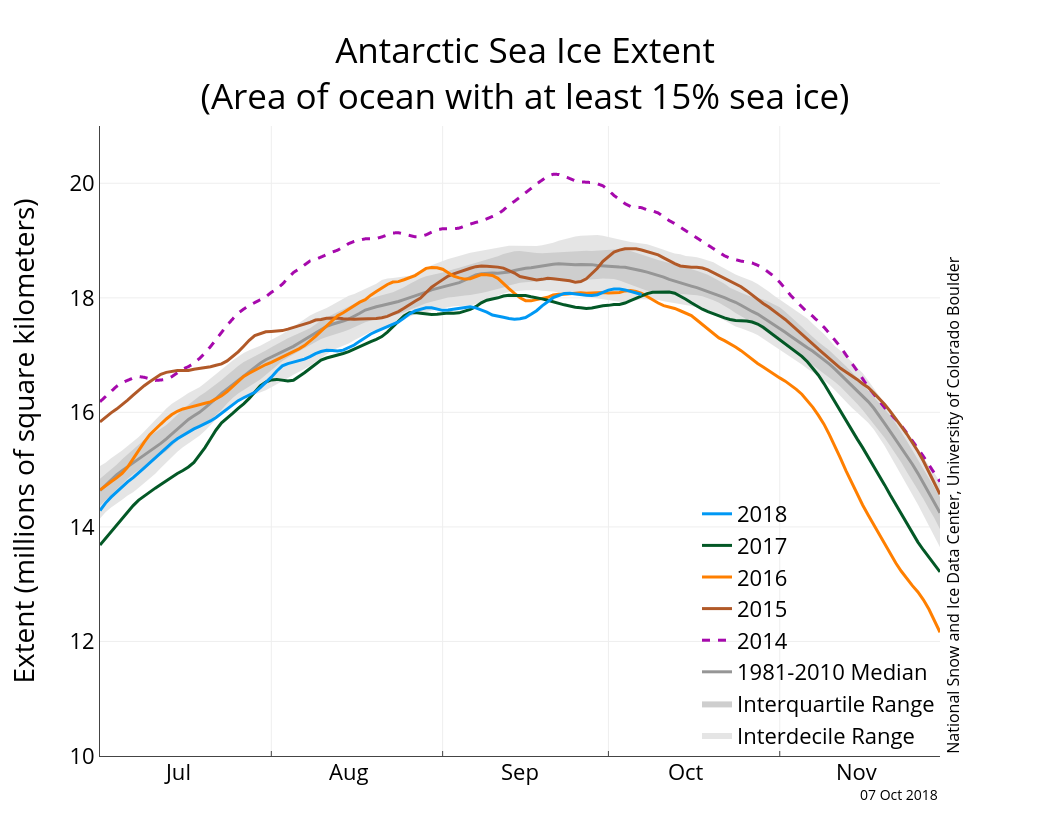
Figure 6. The graph above shows Antarctic sea ice extent as of October 7, 2018, along with daily ice extent data for four previous years. 2018 is shown in blue, 2017 in green, 2016 in orange, 2015 in brown, and 2014 in dotted purple. The 1981 to 2010 median is in dark gray. The gray areas around the median line show the interquartile and interdecile ranges of the data. Sea Ice Index data.
Credit: National Snow and Ice Data Center
High-resolution image
Antarctic sea ice may have reached its maximum extent on October 2, 2018, at 18.15 million square kilometers (7.01 million square miles). If the downward trend continues, it will be the fourth lowest maximum in the satellite record—higher than the 1986, 2002, and 2017 maxima. It is 180,000 square kilometers (70,000 square miles) above the record low Antarctic maximum set in 1986, at 17.97 million square kilometers (6.94 million square miles). It is also 560,000 square kilometers (216,000 square miles) below the 1981 to 2010 average maximum extent of 18.71 million square kilometers (7.22 million square miles). This year’s maximum date of October 2 is about nine days later than the 1981 to 2010 median date and ten days later than the 1981 to 2010 average date. With spring sunshine and warmth increasing daily, the likelihood of a major sea ice expansion is small. However, some years, as in 2002, the maximum was reached on October 12, the latest in the satellite record. There are also brief increases in ice extent as late as October 22 that do not result in new maxima.
In 2018, the Southern Ocean has been true to form. Overall, September sea ice extent has been at near-record lows over the period of satellite observations. A peak in ice extent early in September was followed by a steep decline through mid-month. By the third week of September, extent increased steadily. After a few days of minimal decline, extent reached its maximum on October 2.
Recent ice growth has occurred in the northernmost Ross Sea, partially offsetting ice losses in the area north of Dronning Maud Land and the Drake Passage. Temperatures from August 21 to September 20 at the 925 hPa level were 2 to 5 degrees Celsius (4 to 9 degrees Fahrenheit) above average over much of the ice edge in the Weddell and western Ross Seas. Cool conditions, with temperatures of 4 to 8 degrees Celsius (7 to 14 degrees Fahrenheit) below average, characterized the northern Bellingshausen Sea. Sea surface temperatures near the ice edge were near average except in the northern Bellingshausen Sea, where they have been 0.5 to 1.5 degrees Celsius (0.9 to 2.7 degrees Fahrenheit) lower than average.

