Arctic sea ice appears to have reached its annual maximum extent on March 7. This is the lowest maximum in the 38-year satellite record. NSIDC will post a detailed analysis of the 2016 to 2017 winter sea ice conditions in our regular monthly post in early April.
Overview of conditions
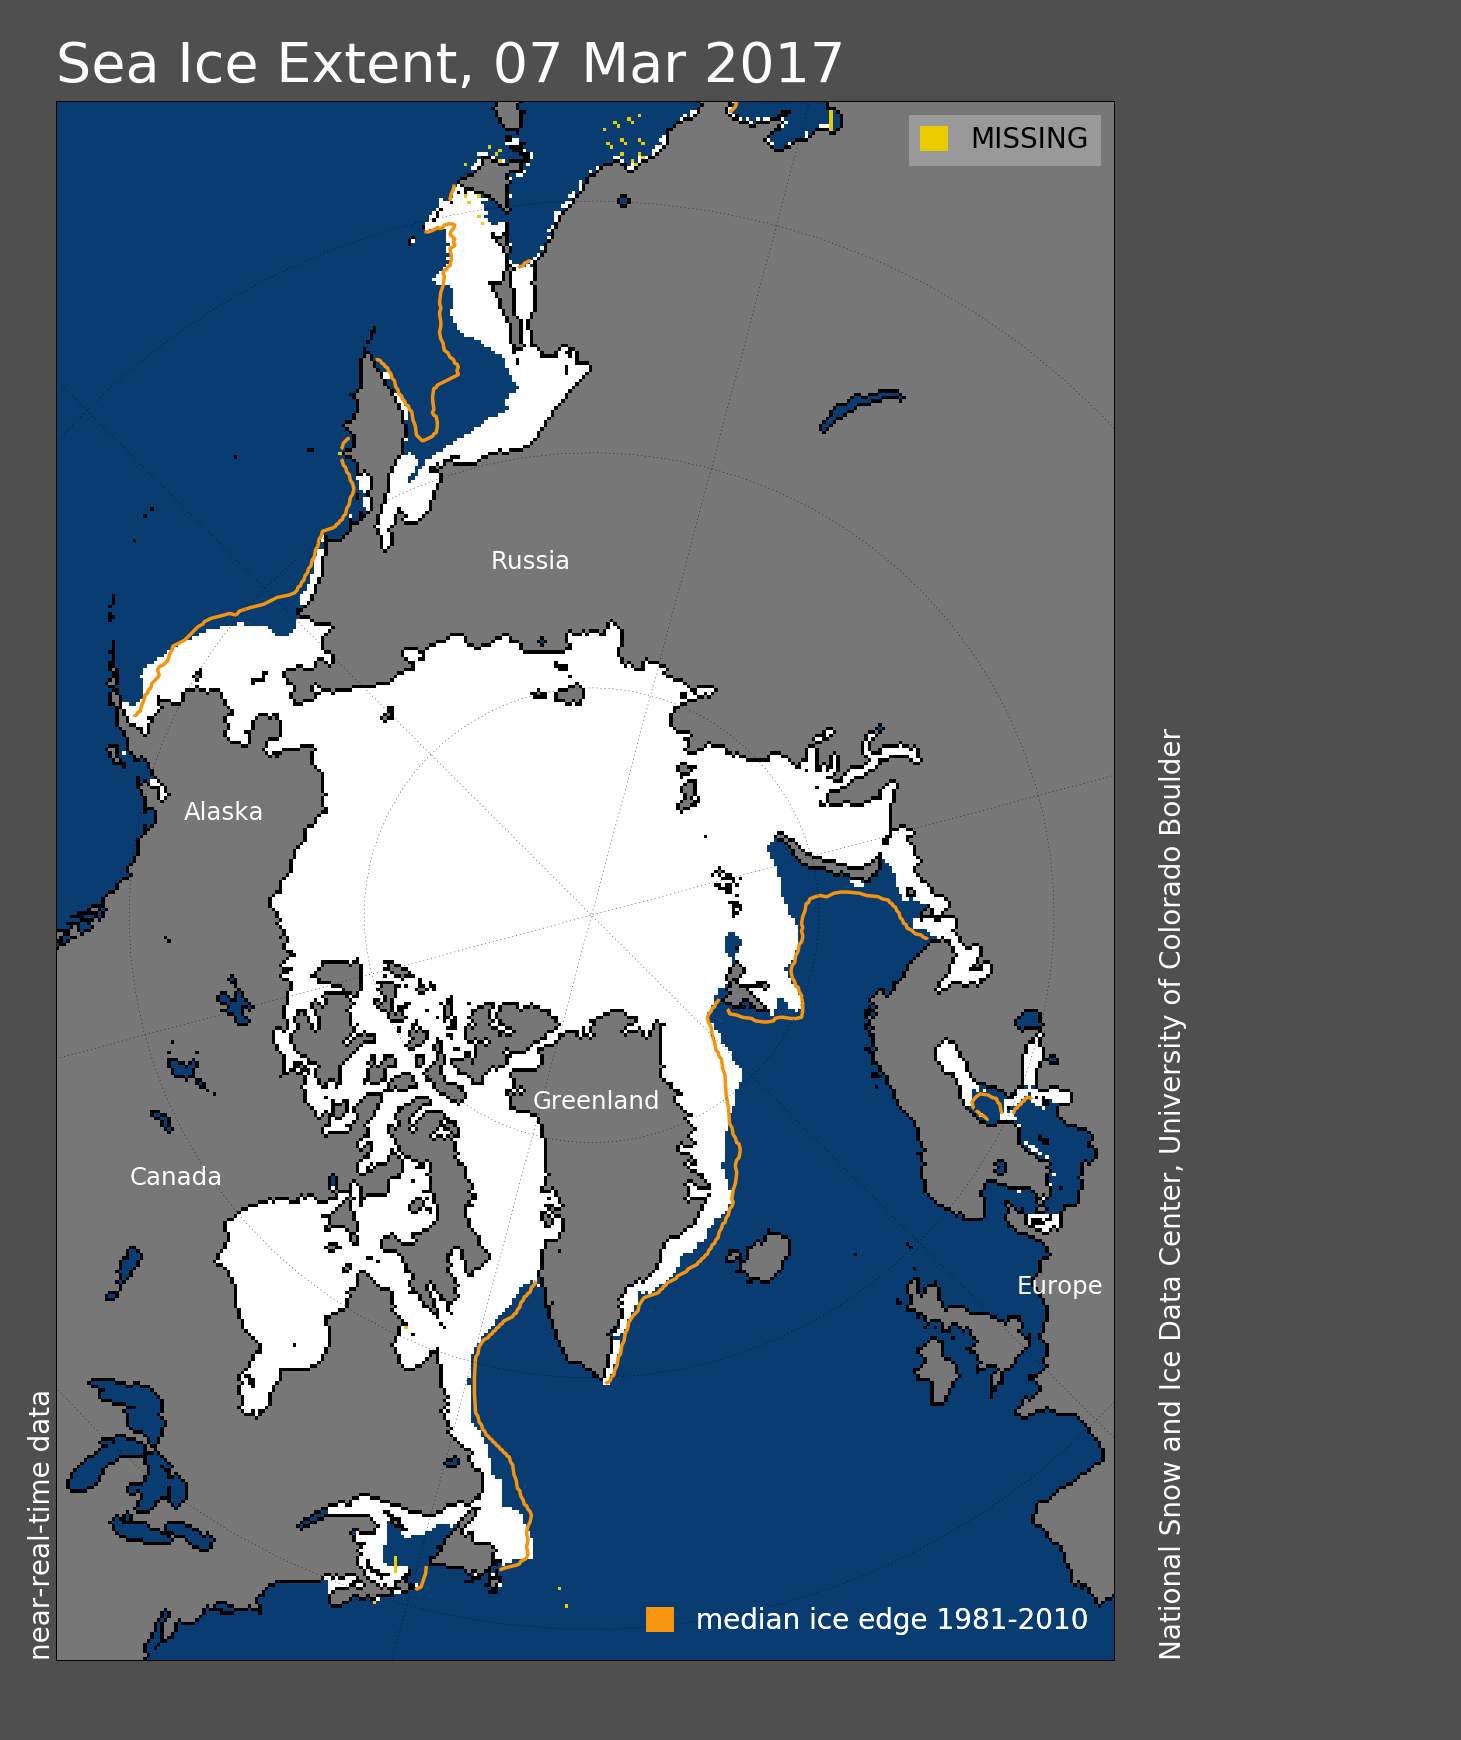
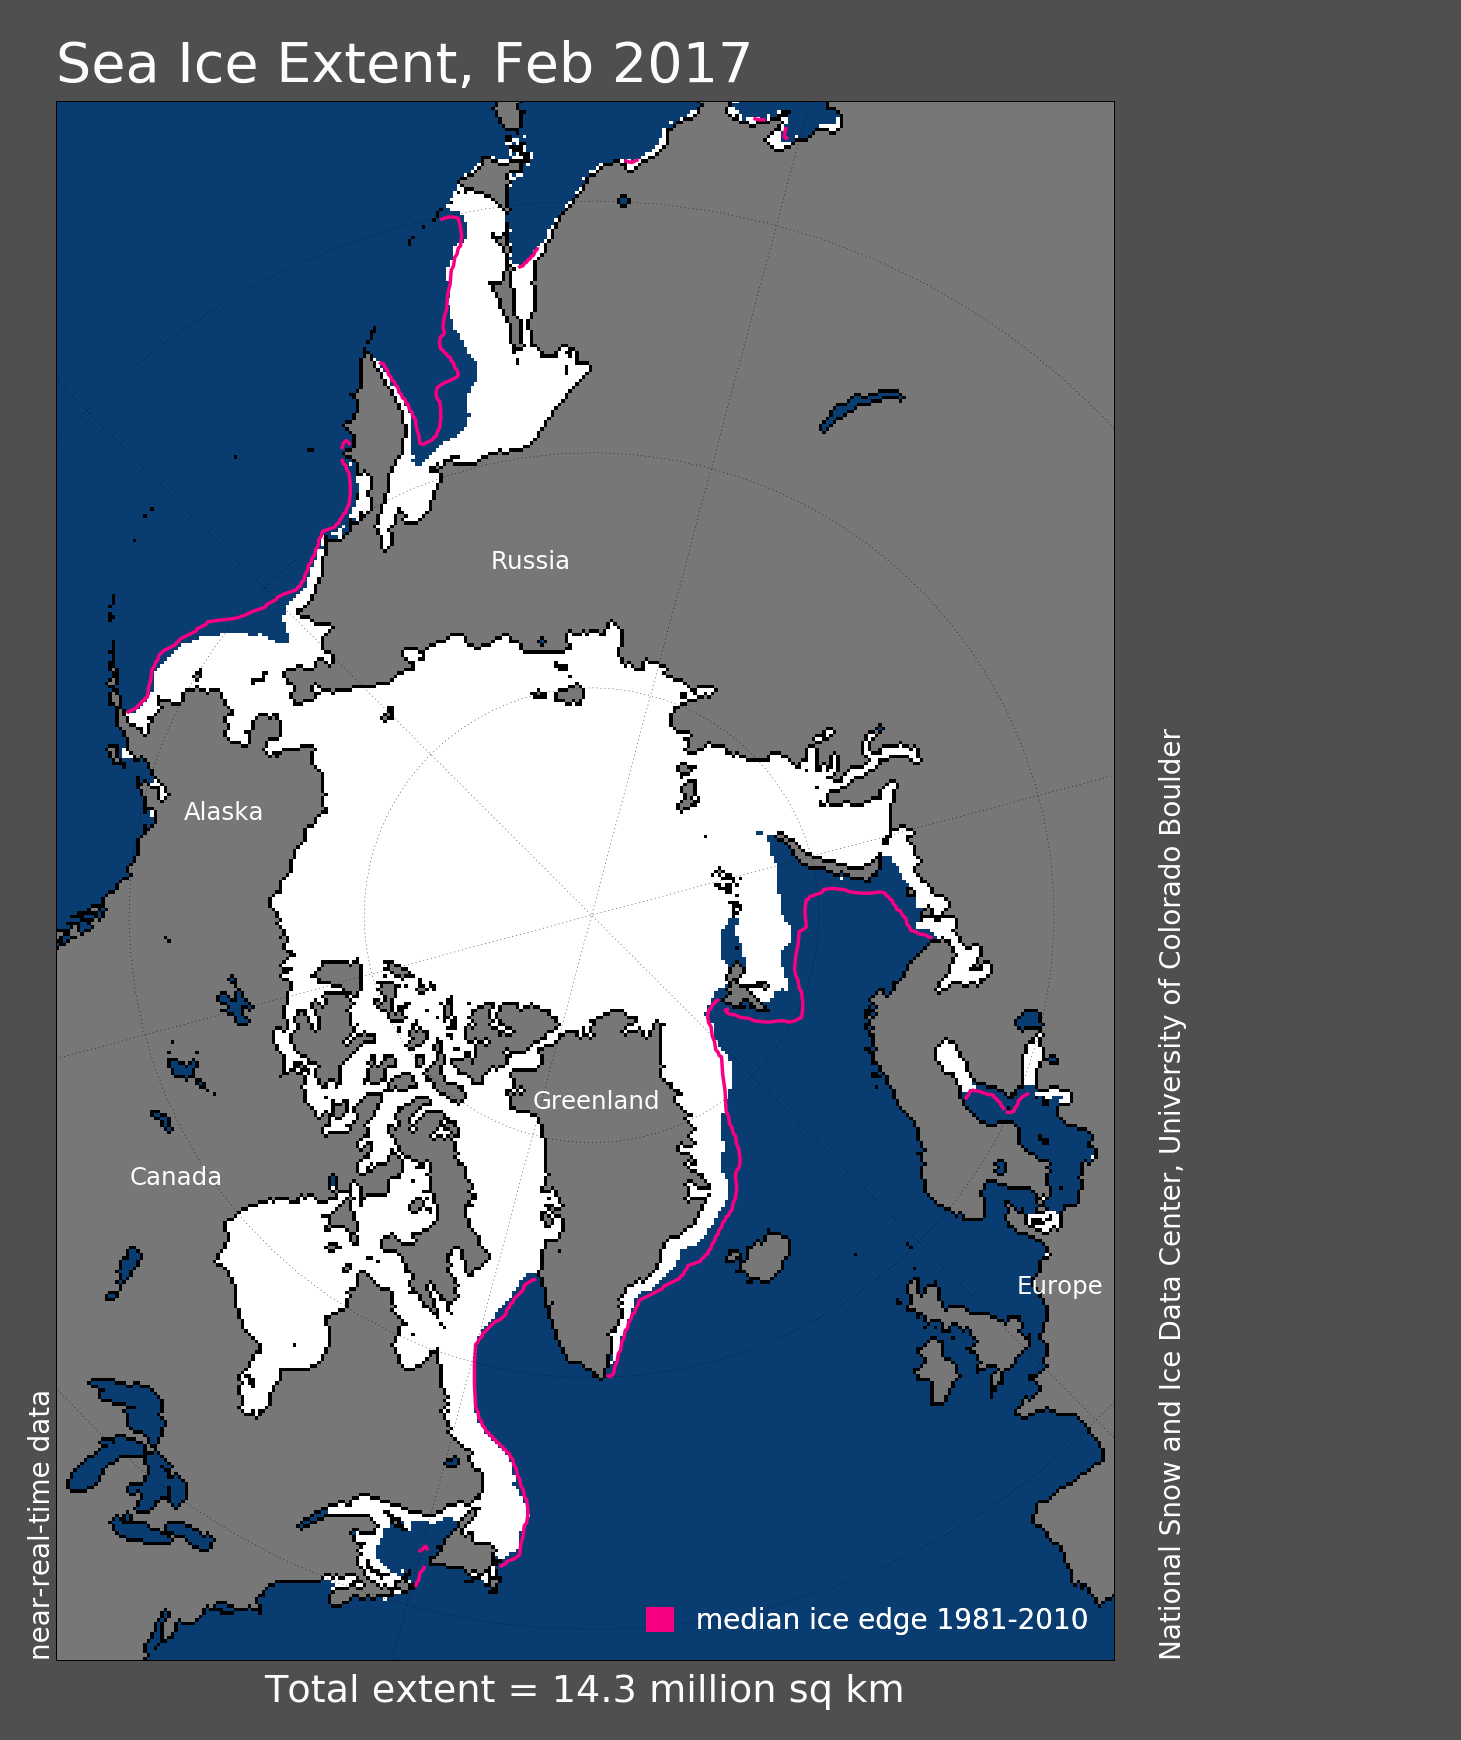
Figure 1. Arctic sea ice extent for March 7, 2017 was 14.42 million square kilometers (5.57 million square miles). The orange line shows the 1981 to 2010 median extent for that day. Sea Ice Index data. About the data
Credit: National Snow and Ice Data Center
High-resolution image
On March 7, 2017, Arctic sea ice likely reached its maximum extent for the year, at 14.42 million square kilometers (5.57 million square miles), the lowest in the 38-year satellite record. This year’s maximum extent is 1.22 million square kilometers (471,000 square miles) below the 1981 to 2010 average maximum of 15.64 million square kilometers (6.04 million square miles) and 97,000 square kilometers (37,000 square miles) below the previous lowest maximum that occurred on February 25, 2015. This year’s maximum is 100,000 square kilometers (39,000 square miles) below the 2016 maximum, which is now third lowest. (In 2016, we reported that year’s maximum as the lowest and 2015 the second lowest. An update to the Sea Ice Index last summer has changed our numbers slightly.)
Conditions in context
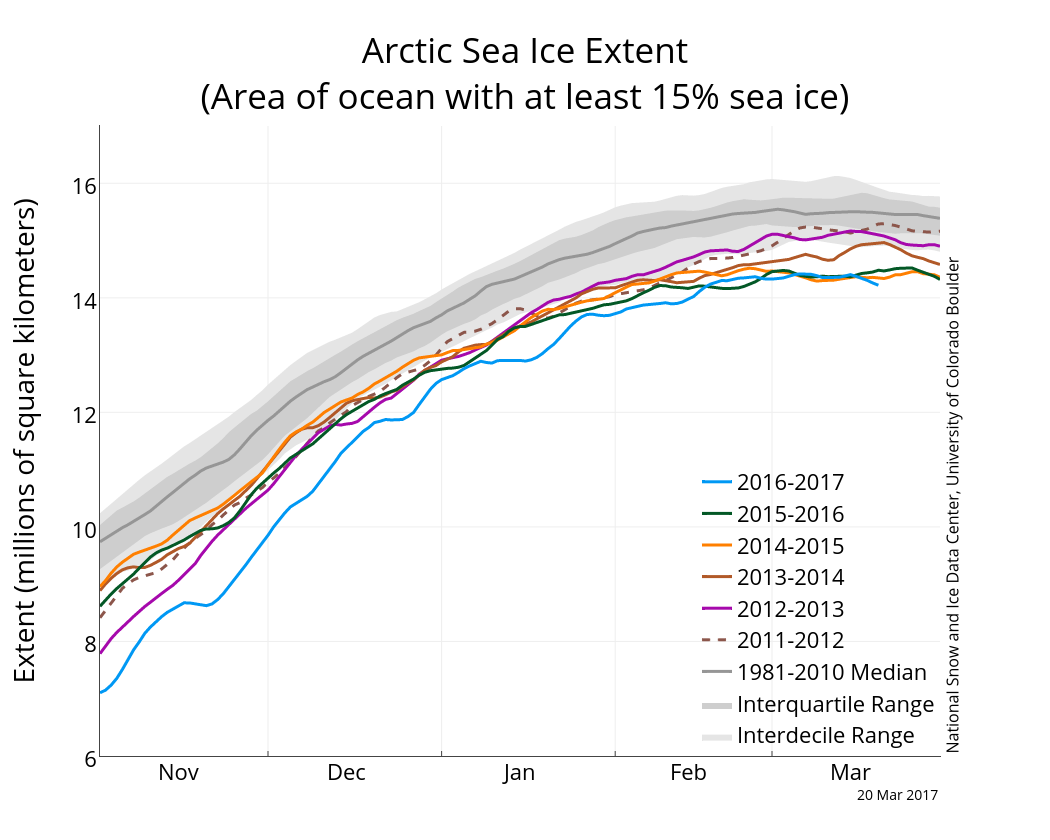
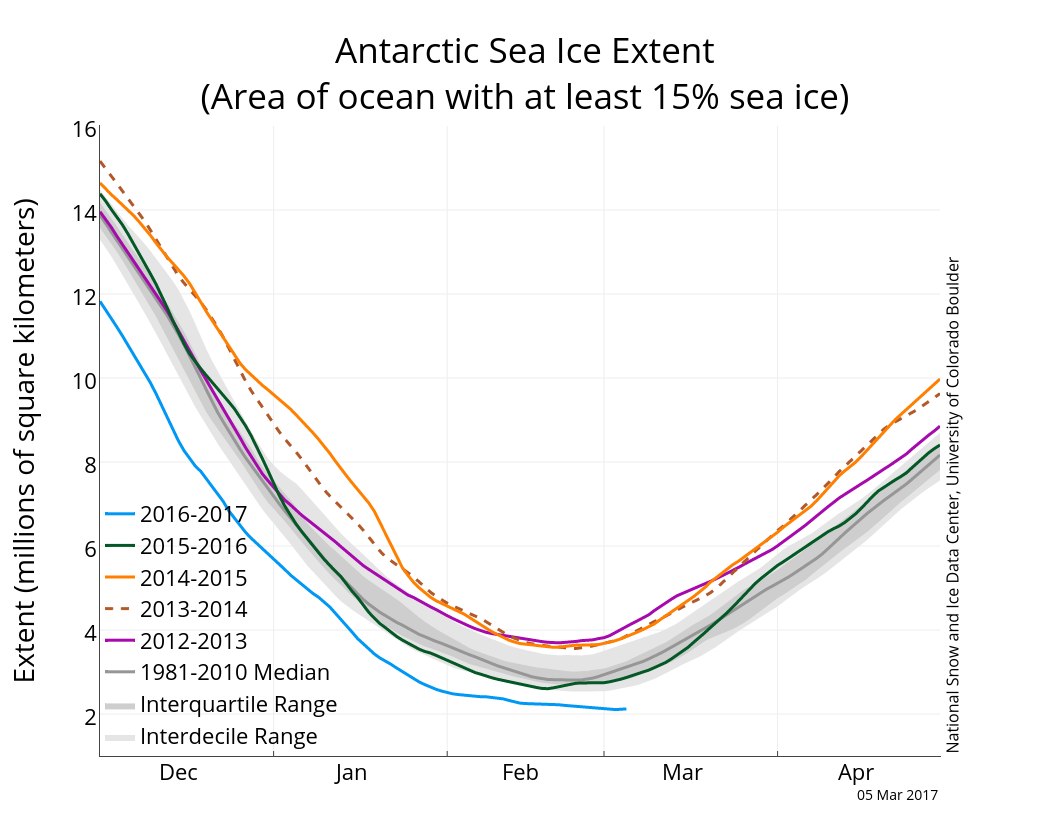
Figure 2a. The graph above shows Arctic sea ice extent as of March 20, 2017, along with daily ice extent data for five previous years. 2016 to 2017 is shown in blue, 2015 to 2016 in green, 2014 to 2015 in orange, 2013 to 2014 in brown, 2012 to 2013 in purple, and 2011 to 2012 in dashed brown. The 1981 to 2010 median is in dark gray. The gray areas around the median line show the interquartile and interdecile ranges of the data. Sea Ice Index data.
Credit: National Snow and Ice Data Center
High-resolution image
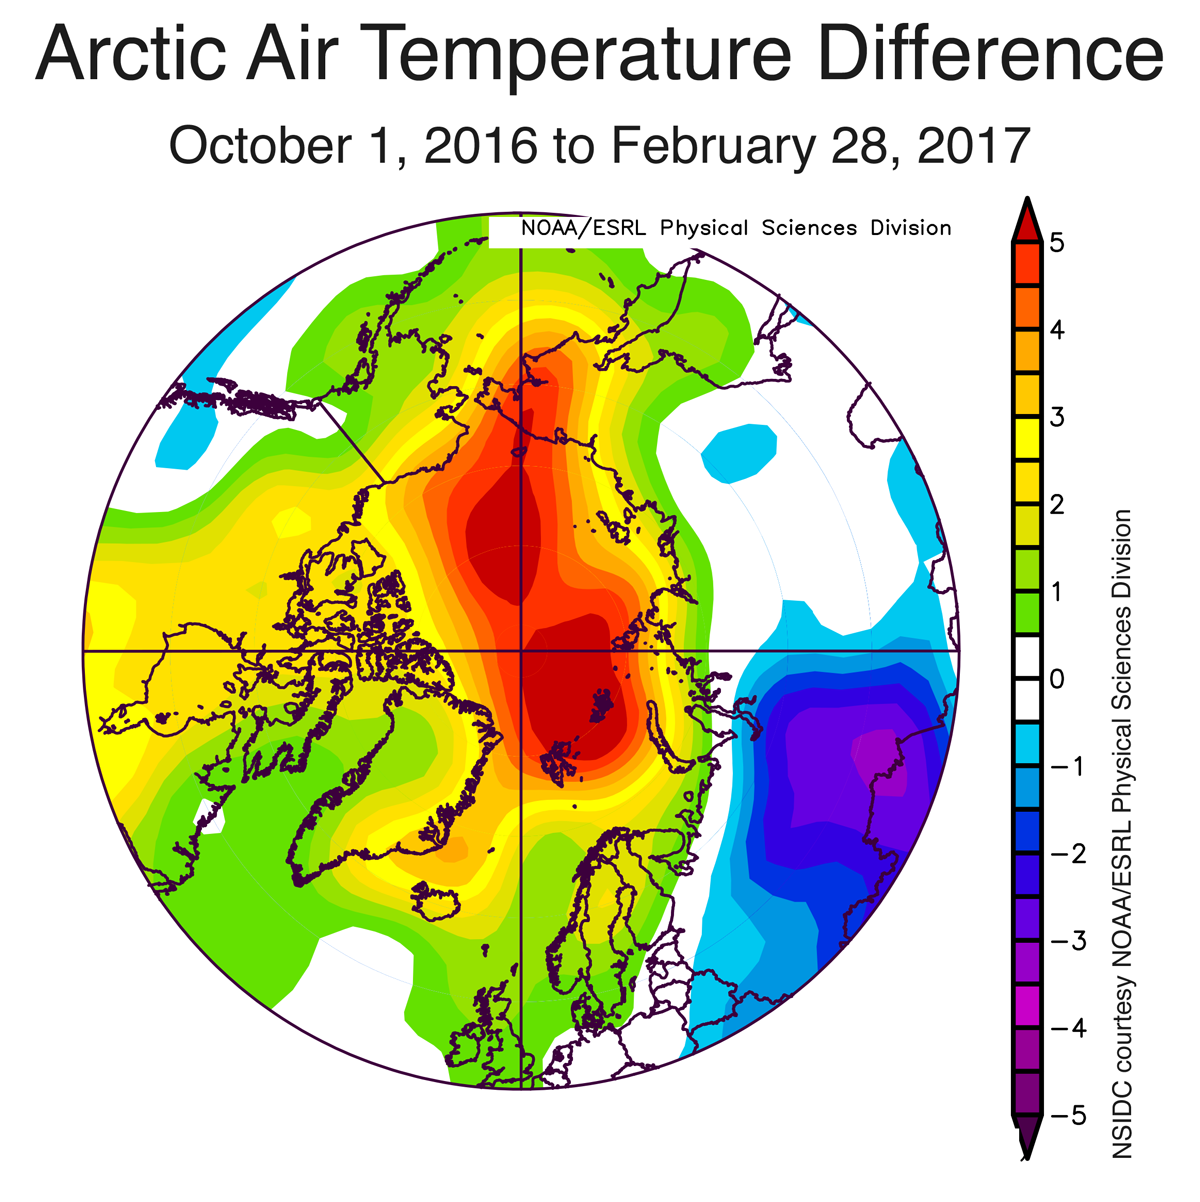
Figure 2b. The plot shows Arctic air temperature differences at the 925 hPa level (about 2,500 feet above sea level) in degrees Celsius from October 1, 2016 to February 28, 2017. Yellows and reds indicate temperatures higher than the 1981 to 2010 average; blues and purples indicate temperatures lower than the 1981 to 2010 average.
Credit: NSIDC courtesy NOAA Earth System Research Laboratory Physical Sciences Division
High-resolution image
It was a very warm autumn and winter. Air temperatures at the 925 hPa level (about 2,500 feet above sea level) over the five months spanning October 2016 through February 2017 were more than 2.5 degrees Celsius (4.5 degrees Fahrenheit) above average over the entire Arctic Ocean, and greater than 5 degrees Celsius (9 degrees Fahrenheit) above average over large parts of the northern Chukchi and Barents Seas. These overall warm conditions were punctuated by a series of extreme heat waves over the Arctic Ocean.
Data from the European Space Agency’s CryoSat-2 satellite indicate that this winter’s ice cover may be only slightly thinner than that observed at this time of year for the past four years. However, an ice-ocean model at the University of Washington (PIOMAS) that incorporates observed weather conditions suggests the volume of ice in the Arctic is unusually low.
The Antarctic minimum

Figure 3. Antarctic sea ice extent for March 3, 2017 was 2.11 million square kilometers (815,000 square miles). The orange line shows the 1981 to 2010 median extent for that day. Sea Ice Index data. About the data
Credit: National Snow and Ice Data Center
High-resolution image
In the Southern Hemisphere, sea ice likely reached its minimum extent for the year on March 3, at 2.11 million square kilometers (815,000 square miles). This year’s minimum extent was the lowest in the satellite record, continuing a period of satellite-era record low daily extents that began in early November. However, the Antarctic system has been highly variable. As recently as 2015, Antarctic sea ice set record high daily extents, and in September 2014 reached a record high winter maximum.
The Antarctic minimum extent is 740,000 square kilometers (286,000 square miles) below the 1981 to 2010 average minimum of 2.85 million square kilometers (1.10 million square miles) and 184,000 square kilometers (71,000 square miles) below the previous lowest minimum that occurred on February 27, 1997.
Antarctic air temperatures during the autumn and winter were above average, but less so than in the Arctic. Air temperatures at the 925 hPa level (about 2,500 feet above sea level) near the sea ice edge have been about 1 to 2.5 degrees Celsius (2 to 4.5 degrees Fahrenheit) above the 1981 to 2010 average.
Final analysis pending
At the beginning of April, NSIDC scientists will release a full analysis of winter conditions, along with monthly data for March. For more information about the maximum extent and what it means, see the NSIDC Icelights post, the Arctic sea ice maximum.
Correction
On March 27, 2017, we made corrections to clarify the second paragraph under Conditions in context. The paragraph originally read:
Data from the European Space Agency’s CryoSat-2 satellite indicate that this winter’s ice cover is slightly thinner compared to the past four years. An ice-ocean model at the University of Washington that incorporates observed weather conditions suggests the volume of ice in the Arctic is unusually low for this time of year.