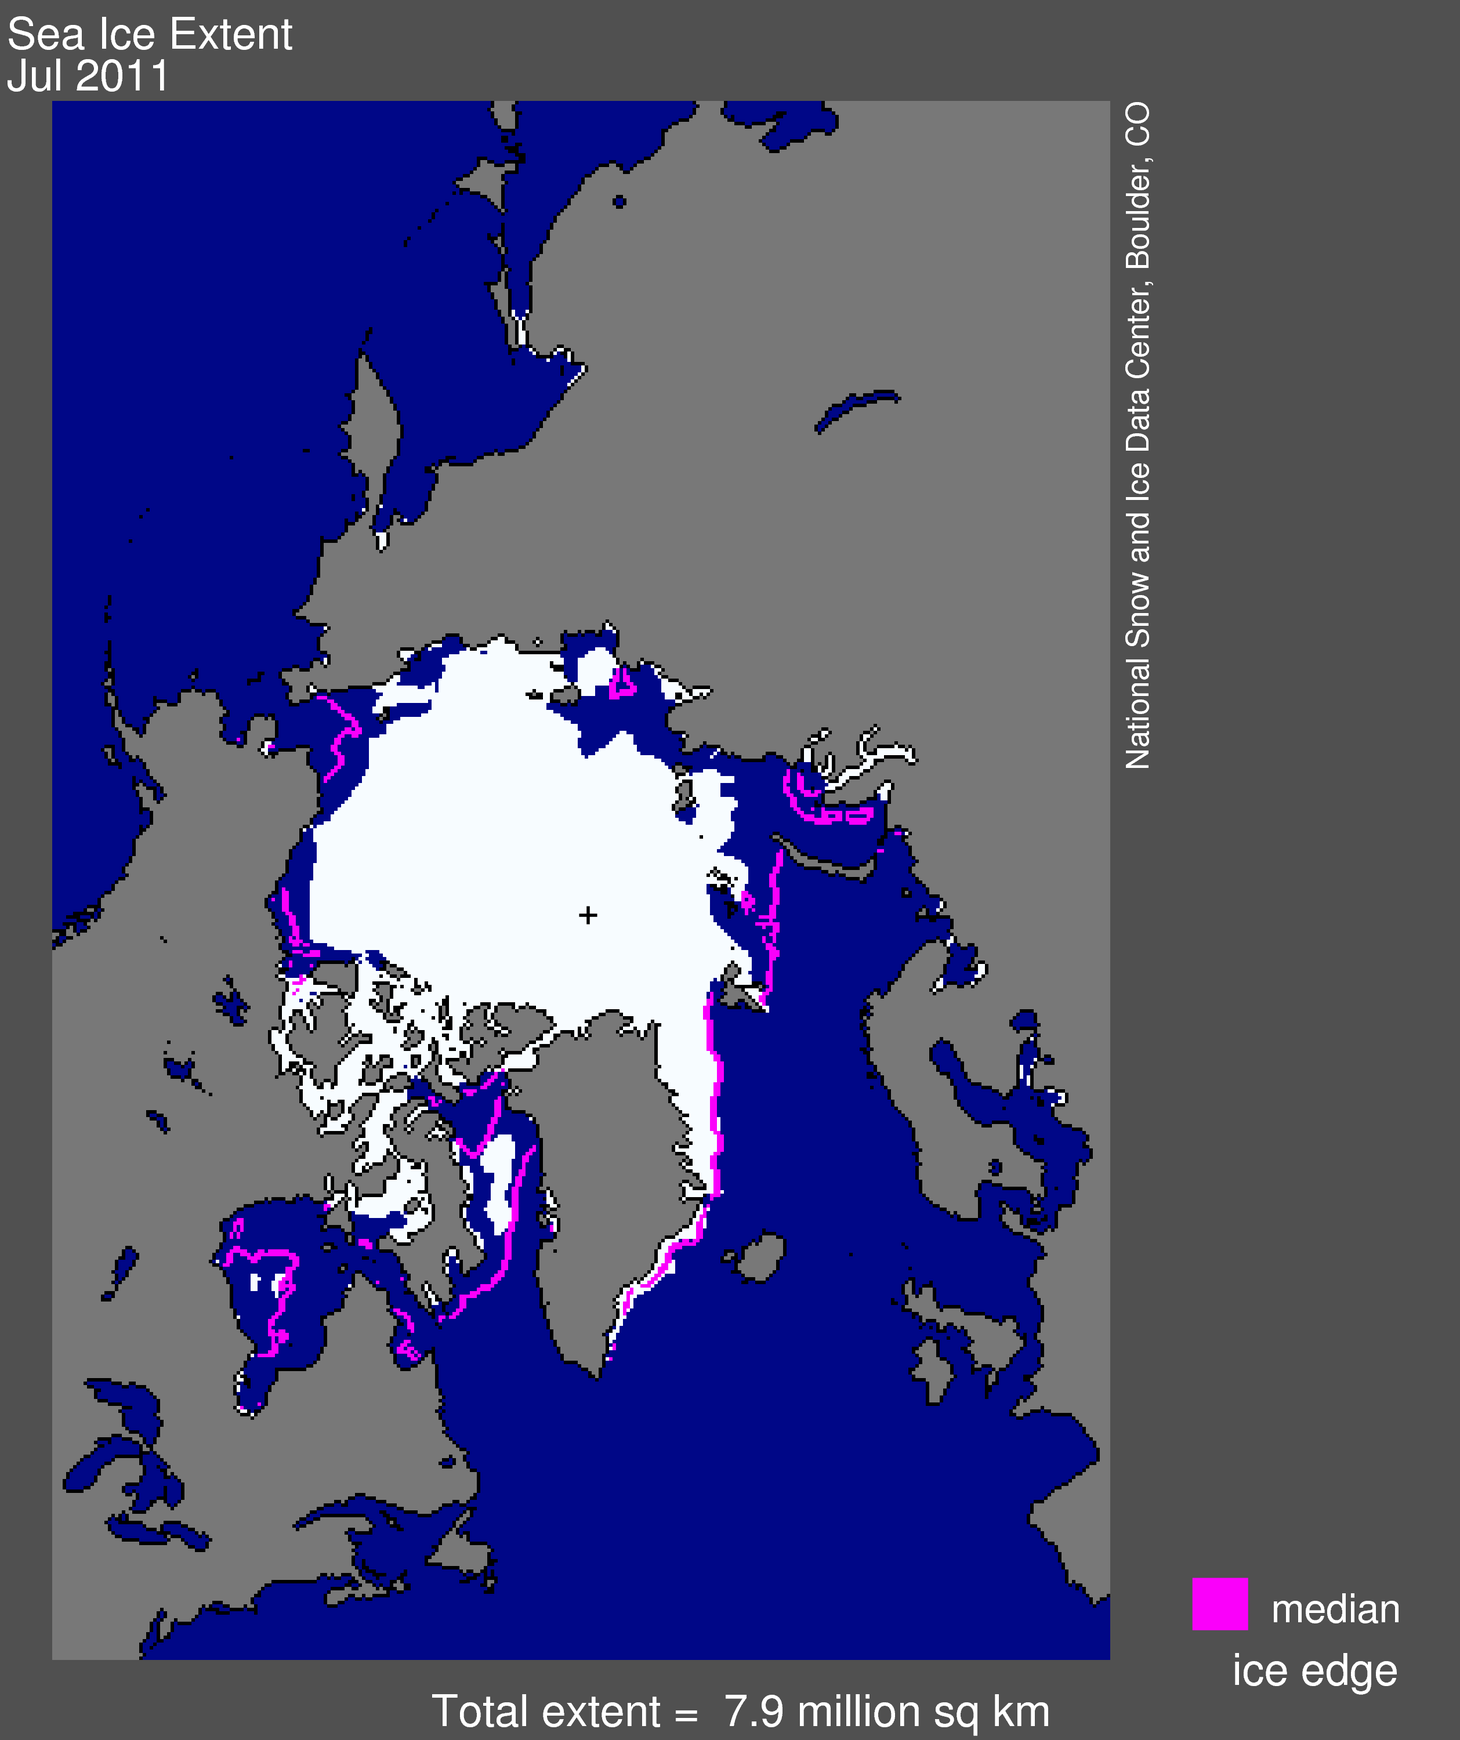
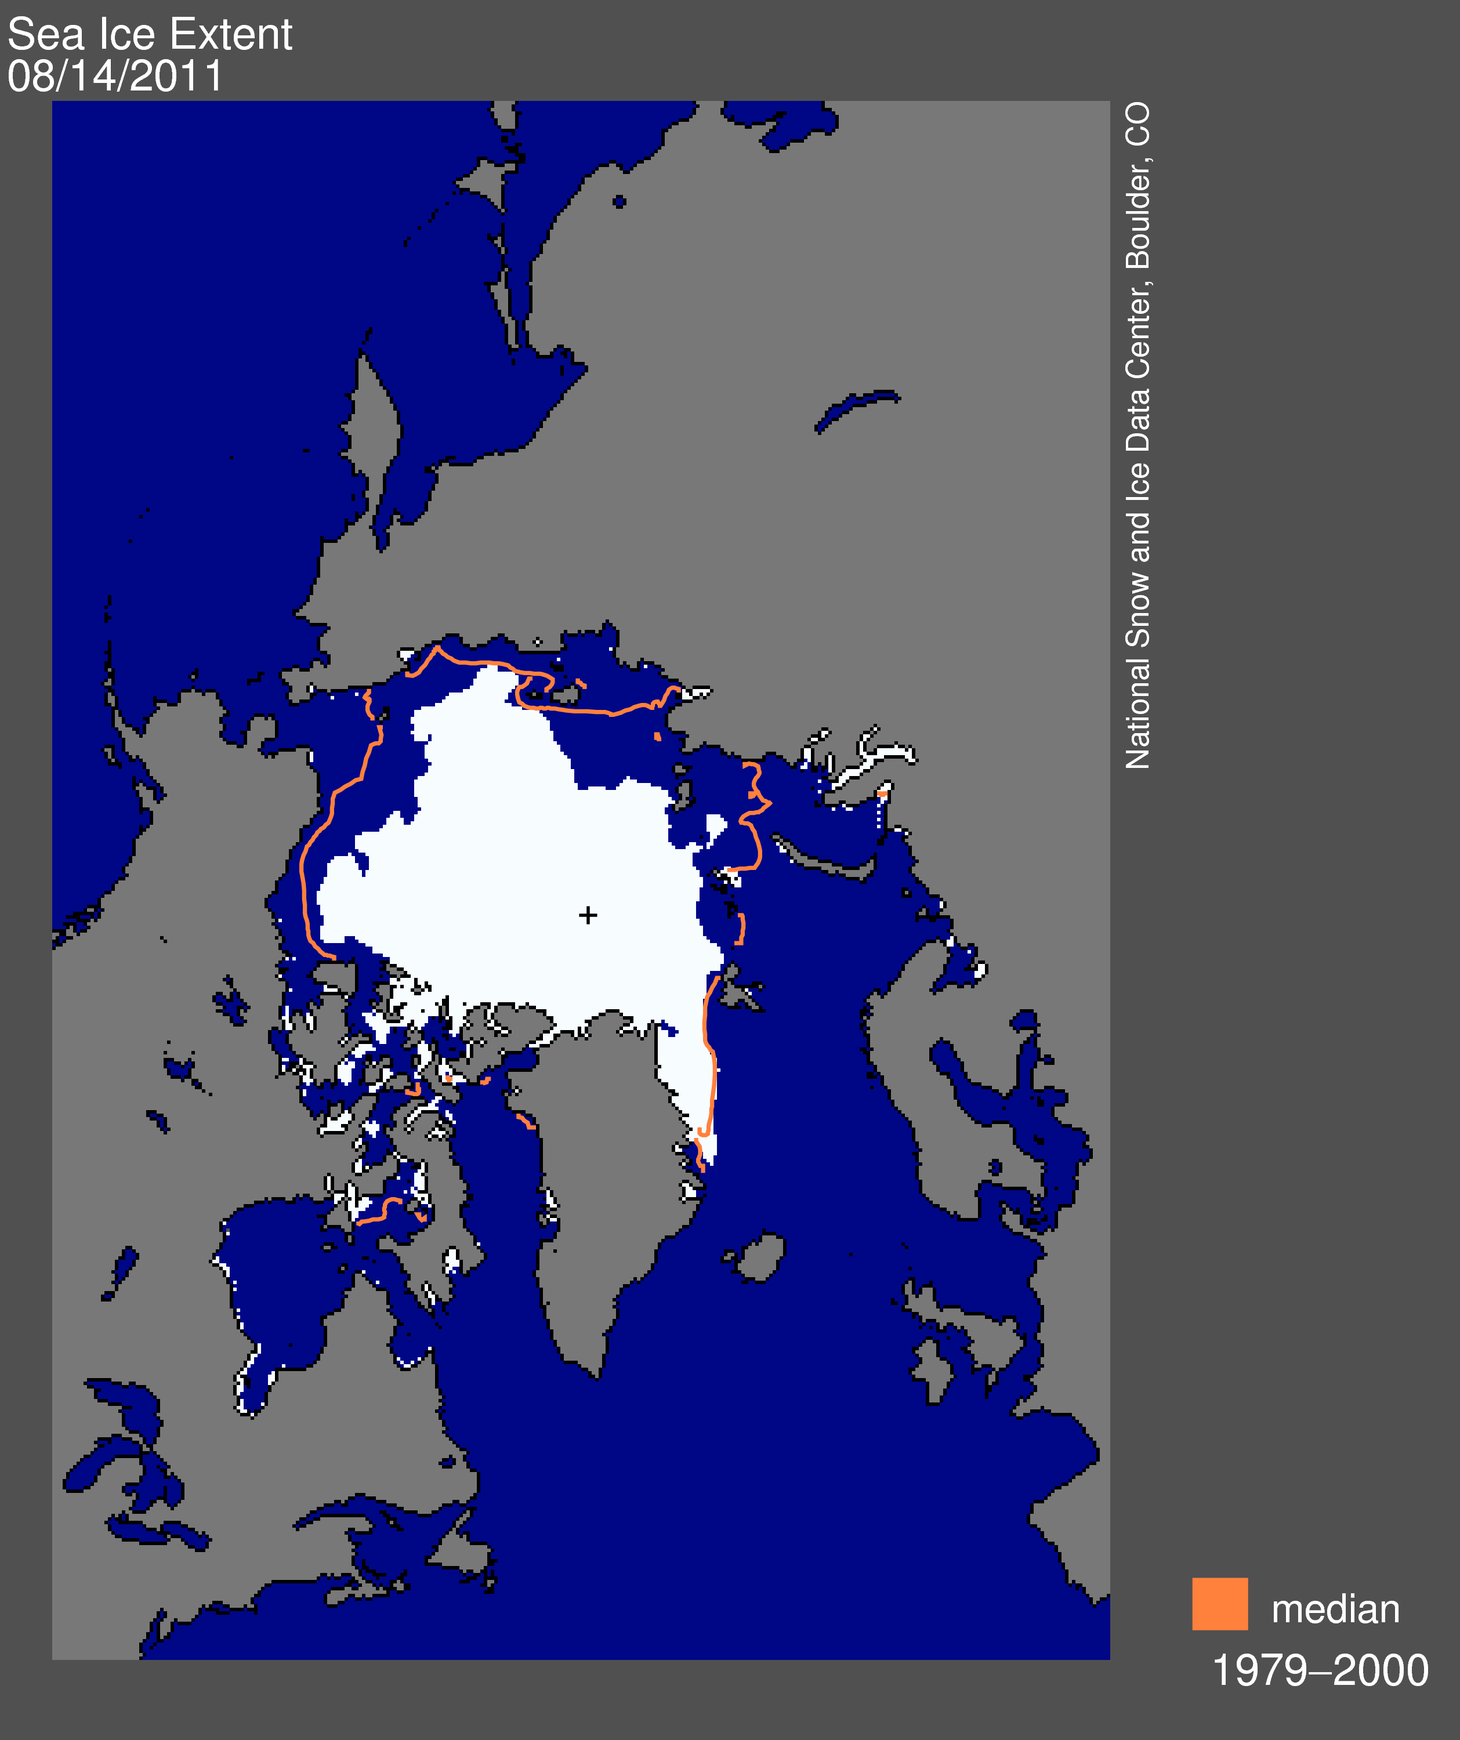
 Figure 1. Arctic sea ice extent on August 14, 2011 was 5.56 million square kilometers (2.15 million square miles). The orange line shows the 1979 to 2000 median extent for that day. The black cross indicates the geographic North Pole. Sea Ice Index data. About the data. —Credit: National Snow and Ice Data Center
High-resolution image
Overview of conditions
As of August 14, 2011, Arctic sea ice extent was 5.56 million square kilometers (2.15 million square miles), 2.11 million square kilometers (815,000 square miles) below the 1979 to 2000 average for that day, and 220,000 square kilometers (84,900 square miles) above the extent on that day in 2007.
Sea ice is low across almost all of the Arctic, with the exception of some areas of the East Greenland Sea. It is exceptionally low in the Laptev and Kara Sea areas.
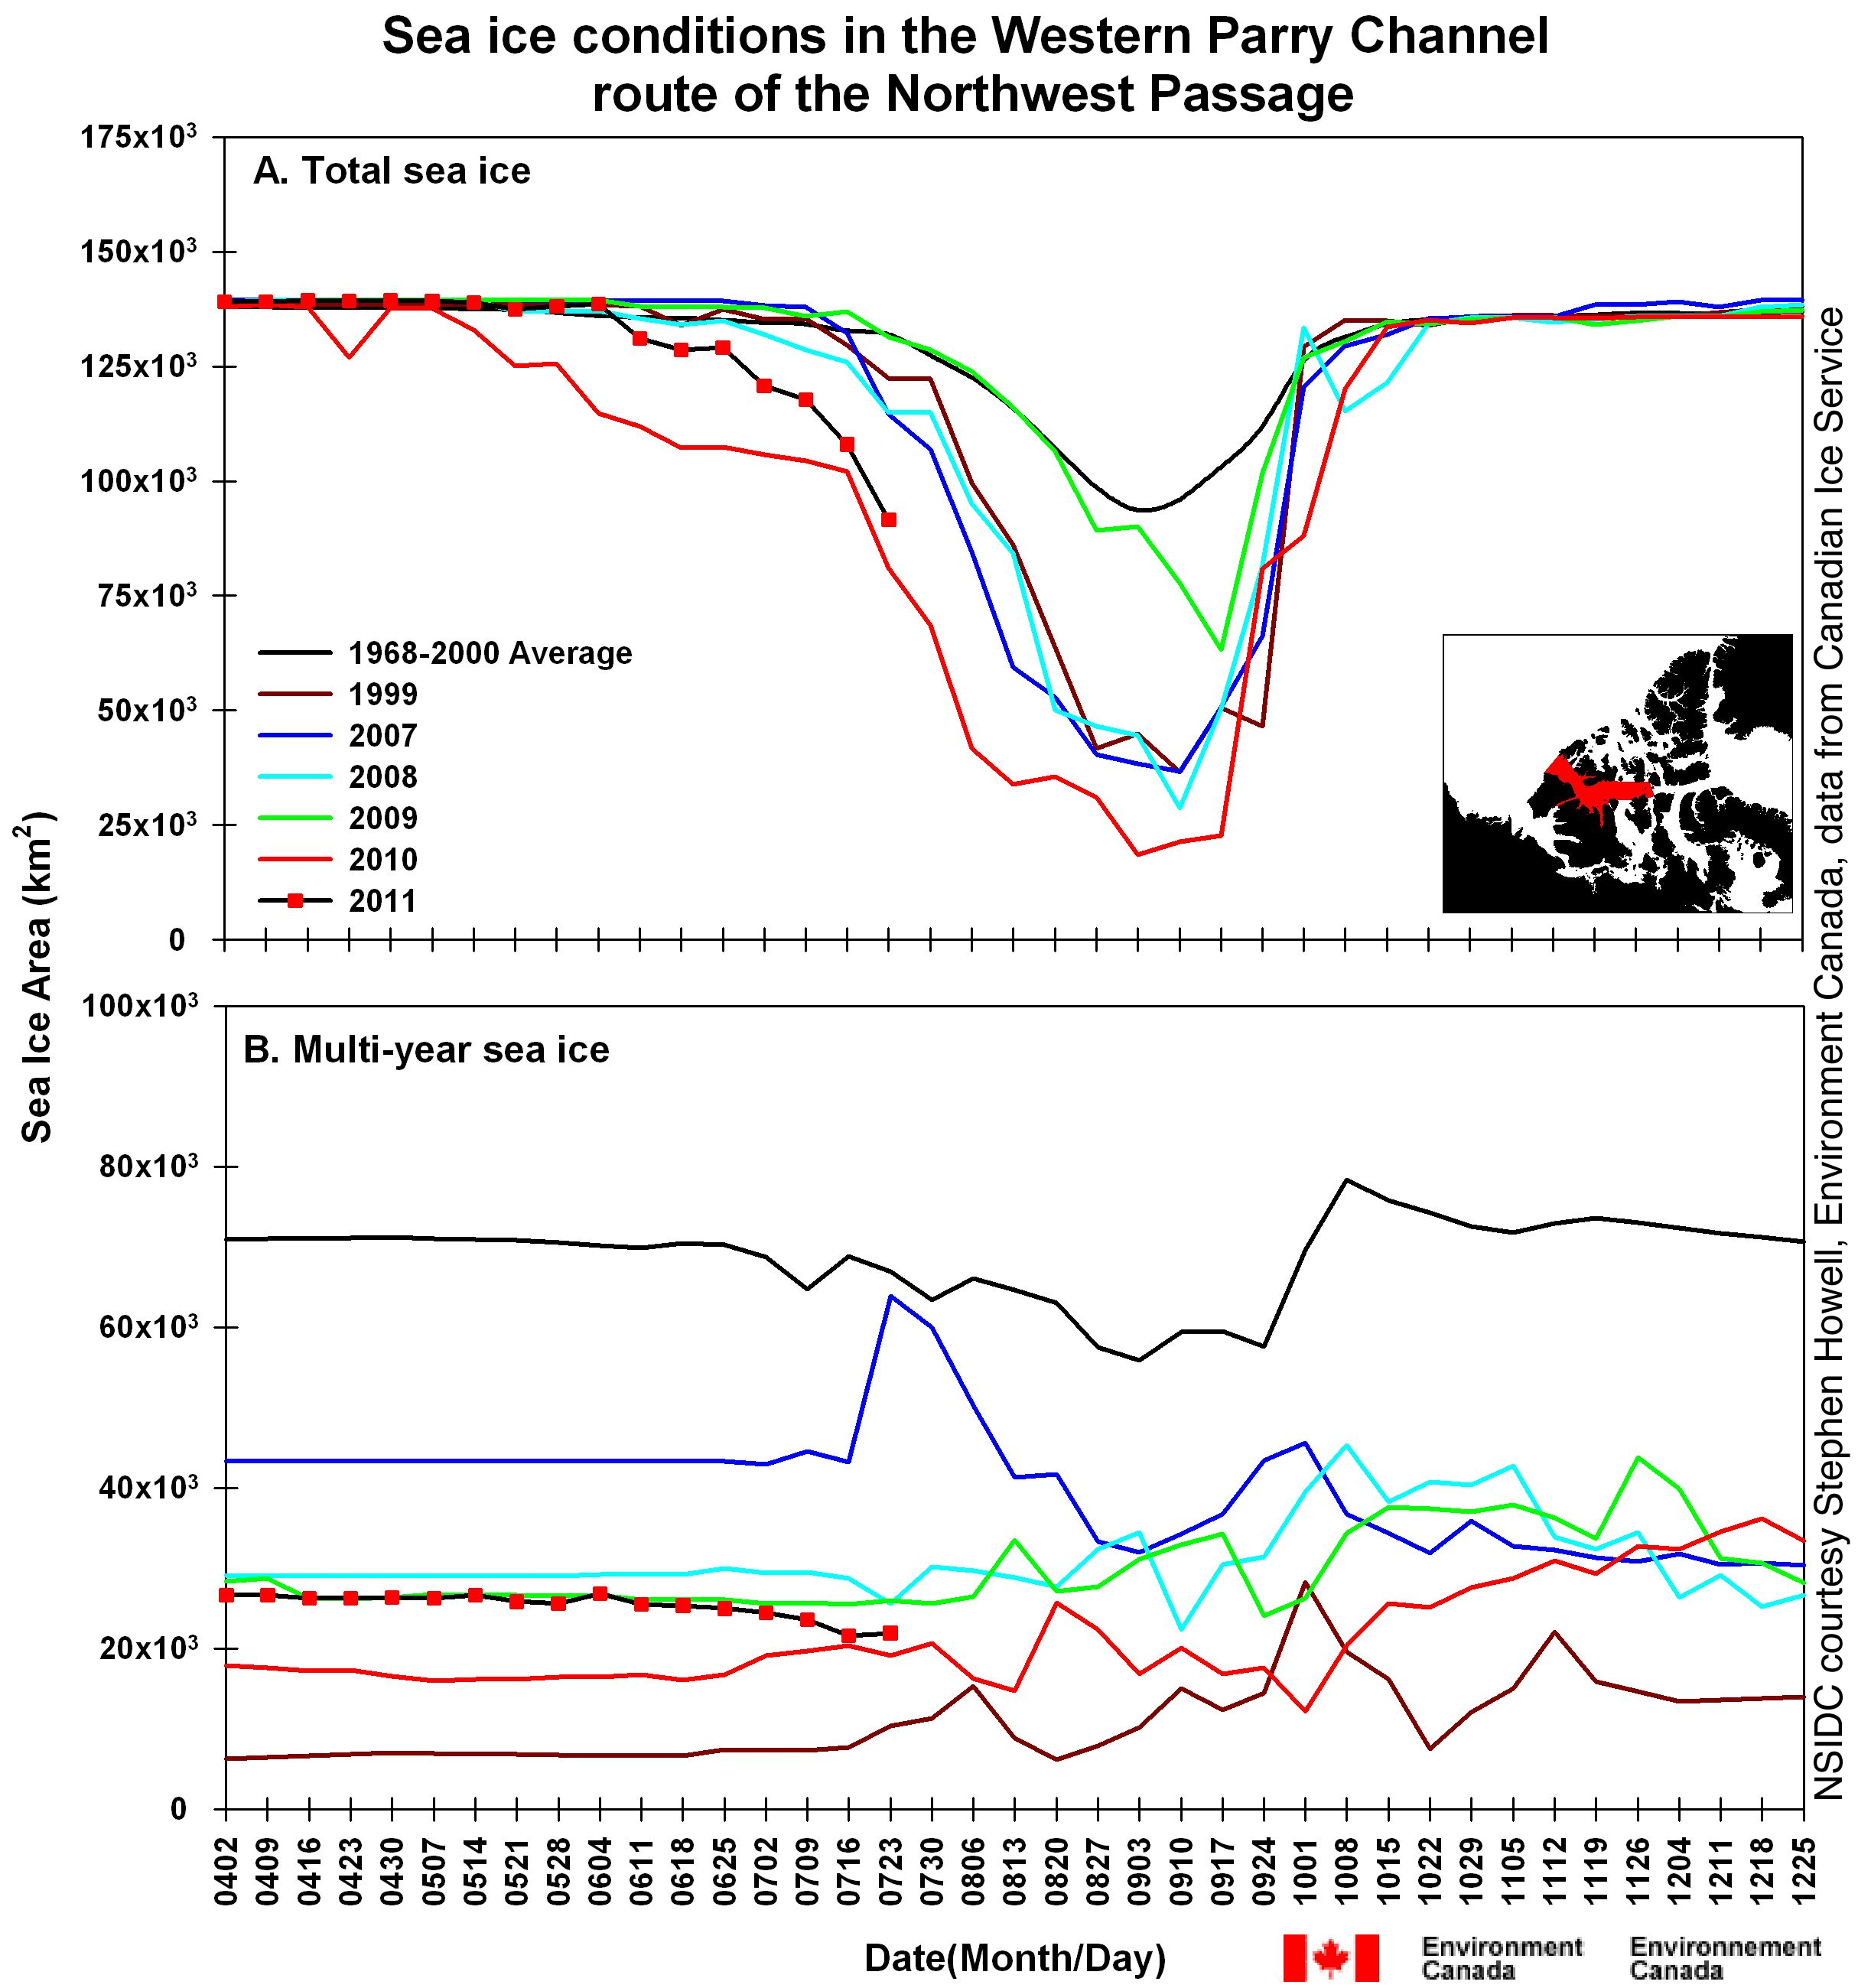
The southern route of the Northwest Passage now appears to be free of sea ice according to imagery from the University of Bremen and the NSIDC Multisensor Analyzed Sea Ice Extent (MASIE) analyses. However, U.S. National Ice Center analyses indicate that there may be up to 20% ice concentration remaining in some parts of the route.
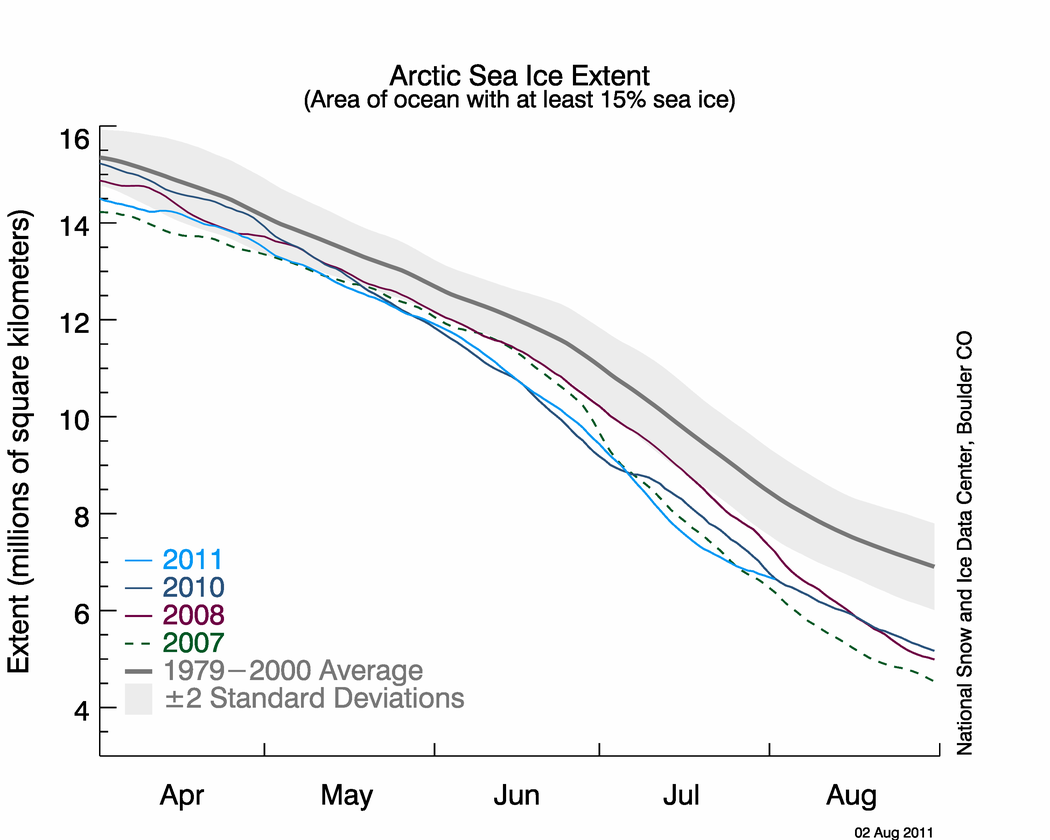
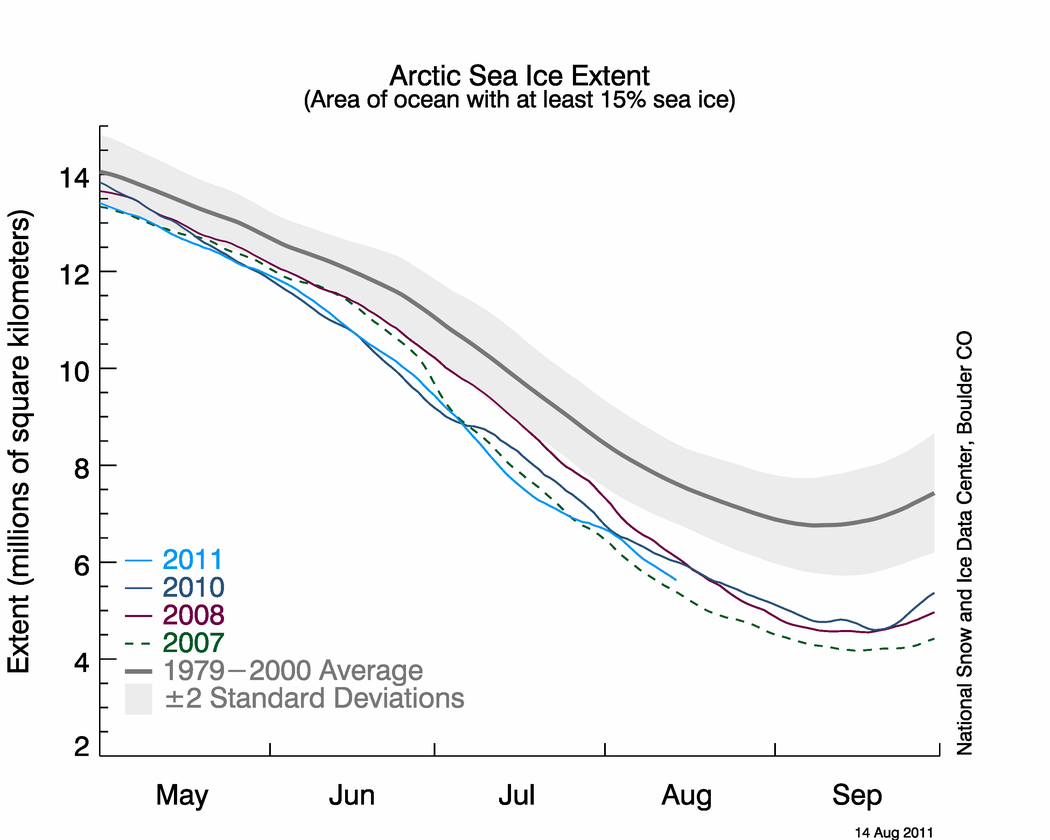 Figure 2. The graph above shows daily Arctic sea ice extent as of August 14, 2011, along with daily ice extents for previous low-ice-extent years. Light blue indicates 2011, dashed green shows 2007, dark blue shows 2010, purple shows 2008, and dark gray shows the 1979 to 2000 average. The gray area around the average line shows the two standard deviation range of the data. Sea Ice Index data.—Credit: National Snow and Ice Data Center
High-resolution image
Conditions in context
Arctic sea ice loss slowed down in late July through early August; then over the past week, the rate of ice loss sped up. At present there is more ice than at the same time in 2007, which saw the record minimum September extent.
Data from the Advanced Microwave Scanning Radiometer – Earth Observing System (AMSR-E) sensor, processed by the University of Bremen, show ice tracking near 2007 levels. The AMSR-E instrument can detect small but widespread areas of open water within the ice pack in the Beaufort and East Siberian seas, because of its resolution (6.25 kilometers or 3.88 miles). Normally, NSIDC uses data from the Defense Meteorological Satellite Program (DMSP) F17 Special Sensor Microwave Imager/Sounder (SSMIS). F17 provides a longer time series of data, but at a 25-kilometer (15.5-mile) resolution.
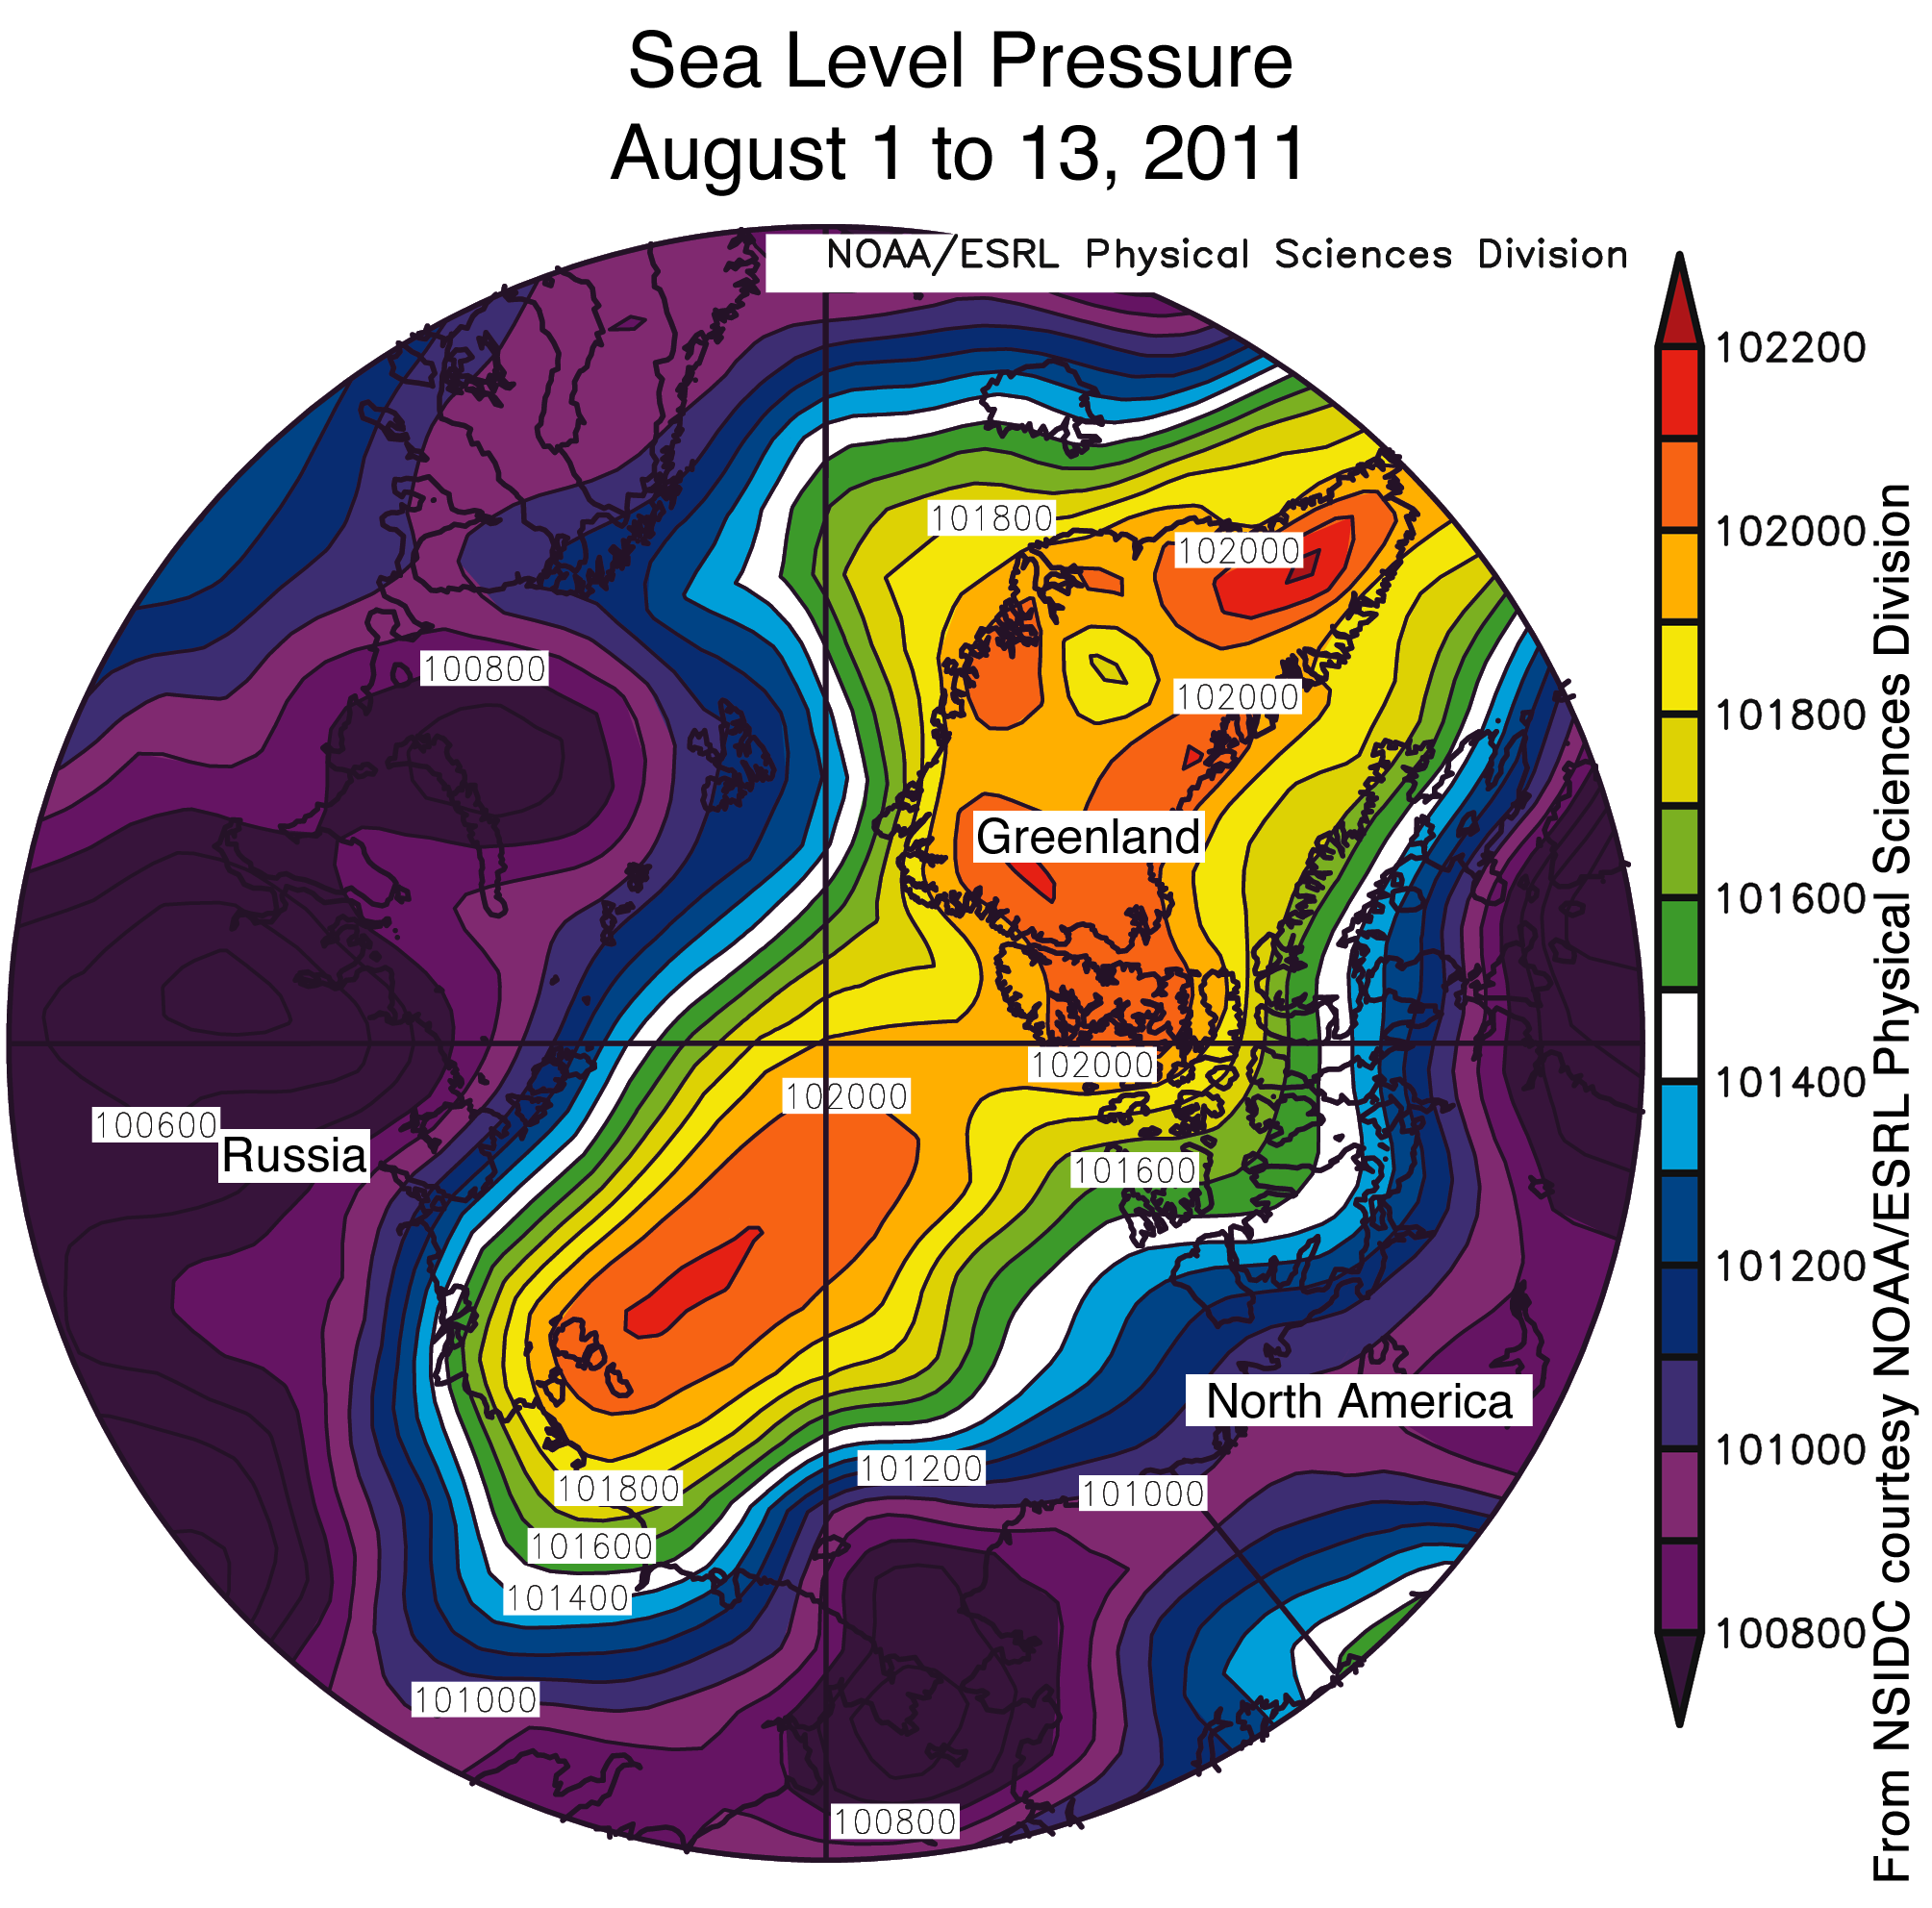 Figure 3. The map of sea level pressure for the first half of August shows high pressure over Greenland and the central Arctic, surrounded by low-pressure areas. This weather pattern has contributed to a speed-up in ice loss so far in August.—Credit: NSIDC courtesy NOAA/ESRL Physical Sciences Division
High-resolution image
A change in the weather
During early summer, a high-pressure cell persisted over the northern Beaufort Sea, promoting ice loss. This weather pattern broke down toward the end of July, slowing ice loss but spreading out the ice pack, making it thinner on average. The weather has now changed again, bringing another high-pressure pattern. Winds associated with this pressure pattern generally bring warm temperatures, and tend to push the ice together and reduce overall extent. In the Kara Sea, the combination of a high-pressure cell with low pressure to the west has resulted in strong northward ice movement, pushing the ice pack away from the coast and reducing ice extent. The same weather pattern is also increasing the movement of ice out of Fram Strait, between Greenland and Spitsbergen.
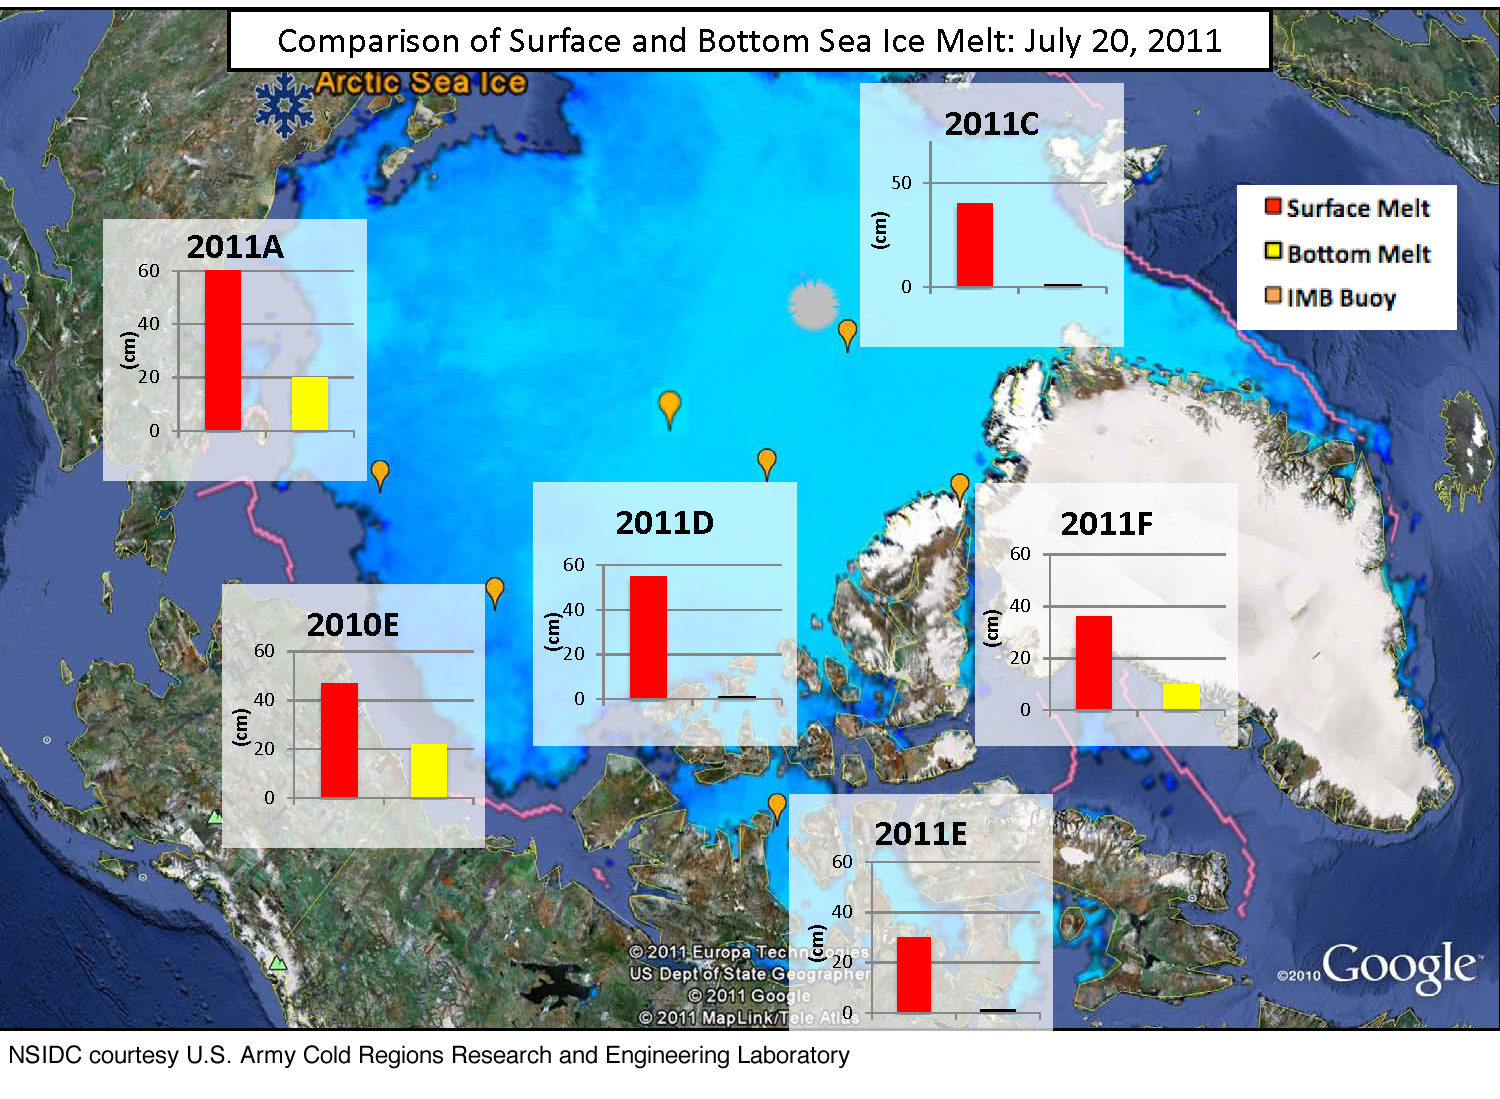 Figure 4. This map shows surface melt (in red) and bottom melt (in yellow) of the sea ice cover at ice mass balance buoy (IMB) sites on July 20, 2011. Surface melt at IMB sites located in the vicinity of the ice edge are consistent with past years. IMB sites located closer to the North Pole are melting more on the surface than on the underside. Data provided by D. Perovich and J. Richter-Menge.—Credit: NSIDC courtesy US Army Cold Regions Research and Engineering Laboratory
High-resolution image
Summer melt and sea ice thickness
Data indicate that the Arctic ice cover continues to thin. Sea ice thickness is also an indicator of the health of the ice cover; thick ice is resistant to melt. Specialized buoys managed by the U.S. Army Cold Regions Research and Engineering Laboratory help supplement limited satellite measurements of sea ice thickness. The buoys provide accurate data at specific locations, and can tell us whether thickness changes are due to surface melt, melt at the bottom of the ice floe, or ice growth. These buoys are deployed on thick multiyear ice, which provide long-lasting, stable platforms.
Data from six of these buoys through July 20 show that this year, the ice surface is melting faster than the underside of the ice. As the sun starts to sink on the horizon, surface melt will slow. However, ocean waters warmed during the summer will continue to melt the ice from below, reducing ice thickness and extent into September.
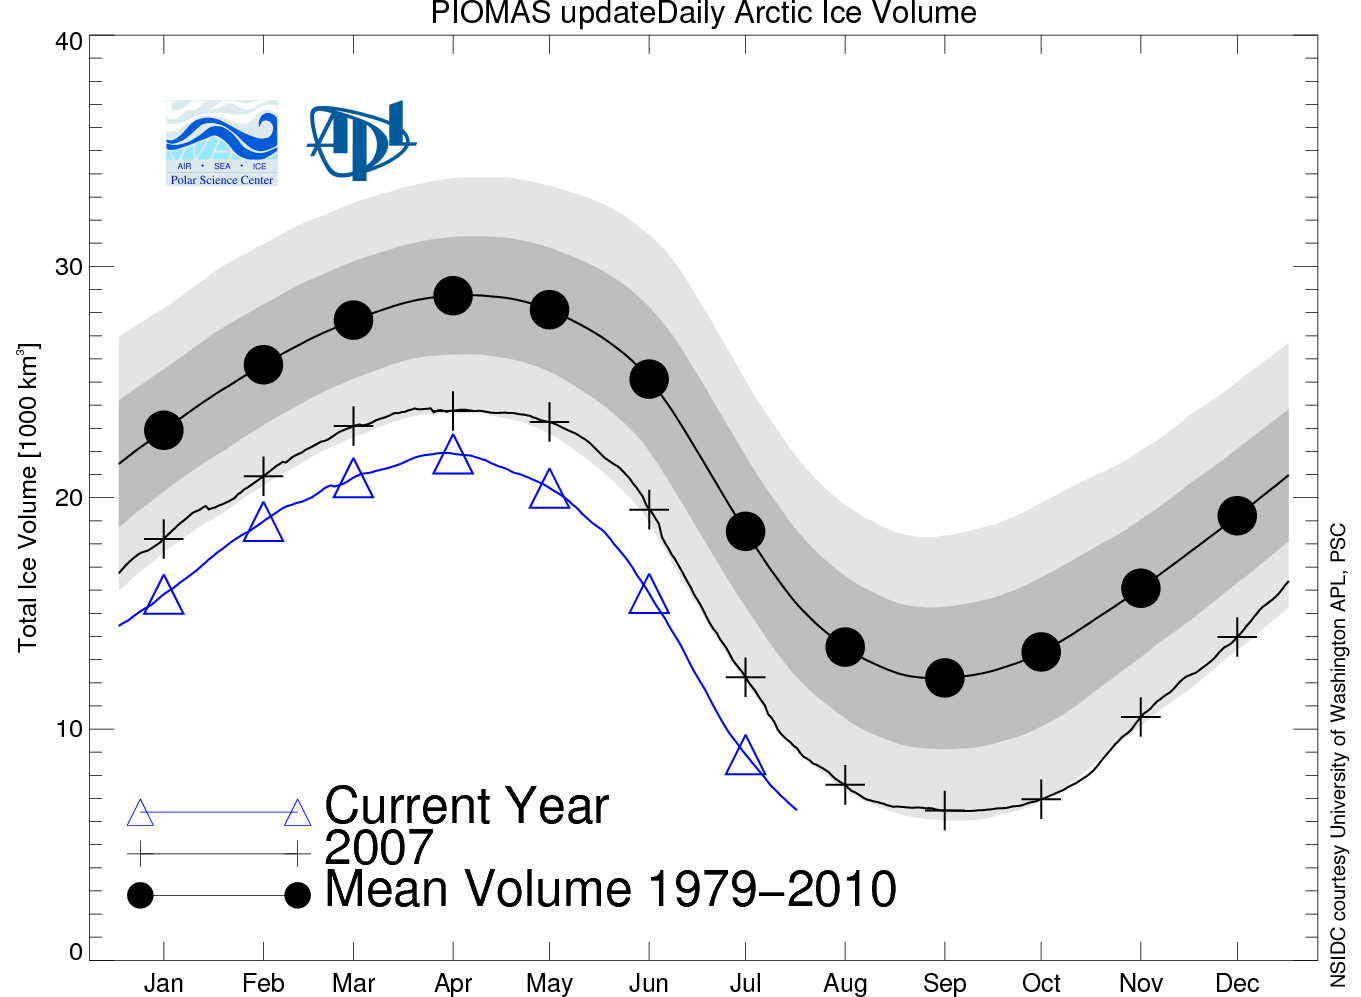 Figure 5. This graph shows total Arctic sea ice volume averaged by month. The 1979 to 2010 average is marked by black circles, 2007 is represented by black crosses, and the current year is shown with blue triangles. The dark gray and light gray areas represent the 1 and 2 standard deviation range of the data. The data were estimated by the University of Washington Polar Science Center PIOMAS model. —Credit: NSIDC courtesy Unviersity of Washington APL/PSC
High-resolution image
Ice volume
Combining ice thickness with sea ice area gives the total sea ice volume. At present, researchers cannot measure volume directly, so they estimate the volume with computer models. The University of Washington’s Pan-Arctic Ice Ocean Modeling and Assimilation System (PIOMAS) model combines data on sea ice concentration with models of ocean and atmospheric conditions to estimate total ice volume. Sea ice volume normally changes with the seasons, but monthly estimates through July 2011 show that the volume for each month has tracked well below the 1979 to 2010 average, and below the volume for 2007, which saw the record low ice extent. PIOMAS projects that this year’s minimum volume in September will very likely finish below 2007 and could even reach a record low volume.
References
Perovich, D.K., J.A. Richter-Menge, B. Elder, K. Claffey, and C. Polashenski. 2009. Observing and understanding climate change: Monitoring the mass balance, motion, and thickness of Arctic sea ice. http://IMB.crrel.usace.army.mil.
Schweiger, A., R. Lindsay, J. Zhang, M. Steele, H. Stern. 2011. Uncertainty in modeled Arctic sea ice volume, Journal of Geophysical Research. doi:10.1029/2011JC007084. In press.
Zhang, J.L. and D.A. Rothrock. 2003. Modeling global sea ice with a thickness and enthalpy distribution model in generalized curvilinear coordinates, Monthly Weather Review, 131, 845-861.
For previous analyses, please see the drop-down menu under Archives in the right navigation at the top of this page.