Arctic sea ice now second-lowest on record

Update 9:15 am MT August 27: See below.

Sea ice extent has fallen below the 2005 minimum, previously the second-lowest extent recorded since the dawn of the satellite era. Will 2008 also break the standing record low, set in 2007? We will know in the next several weeks, when the melt season comes to a close. The bottom line, however, is that the strong negative trend in summertime ice extent characterizing the past decade continues.

Map of sea ice from space, showing sea ice, continents, ocean
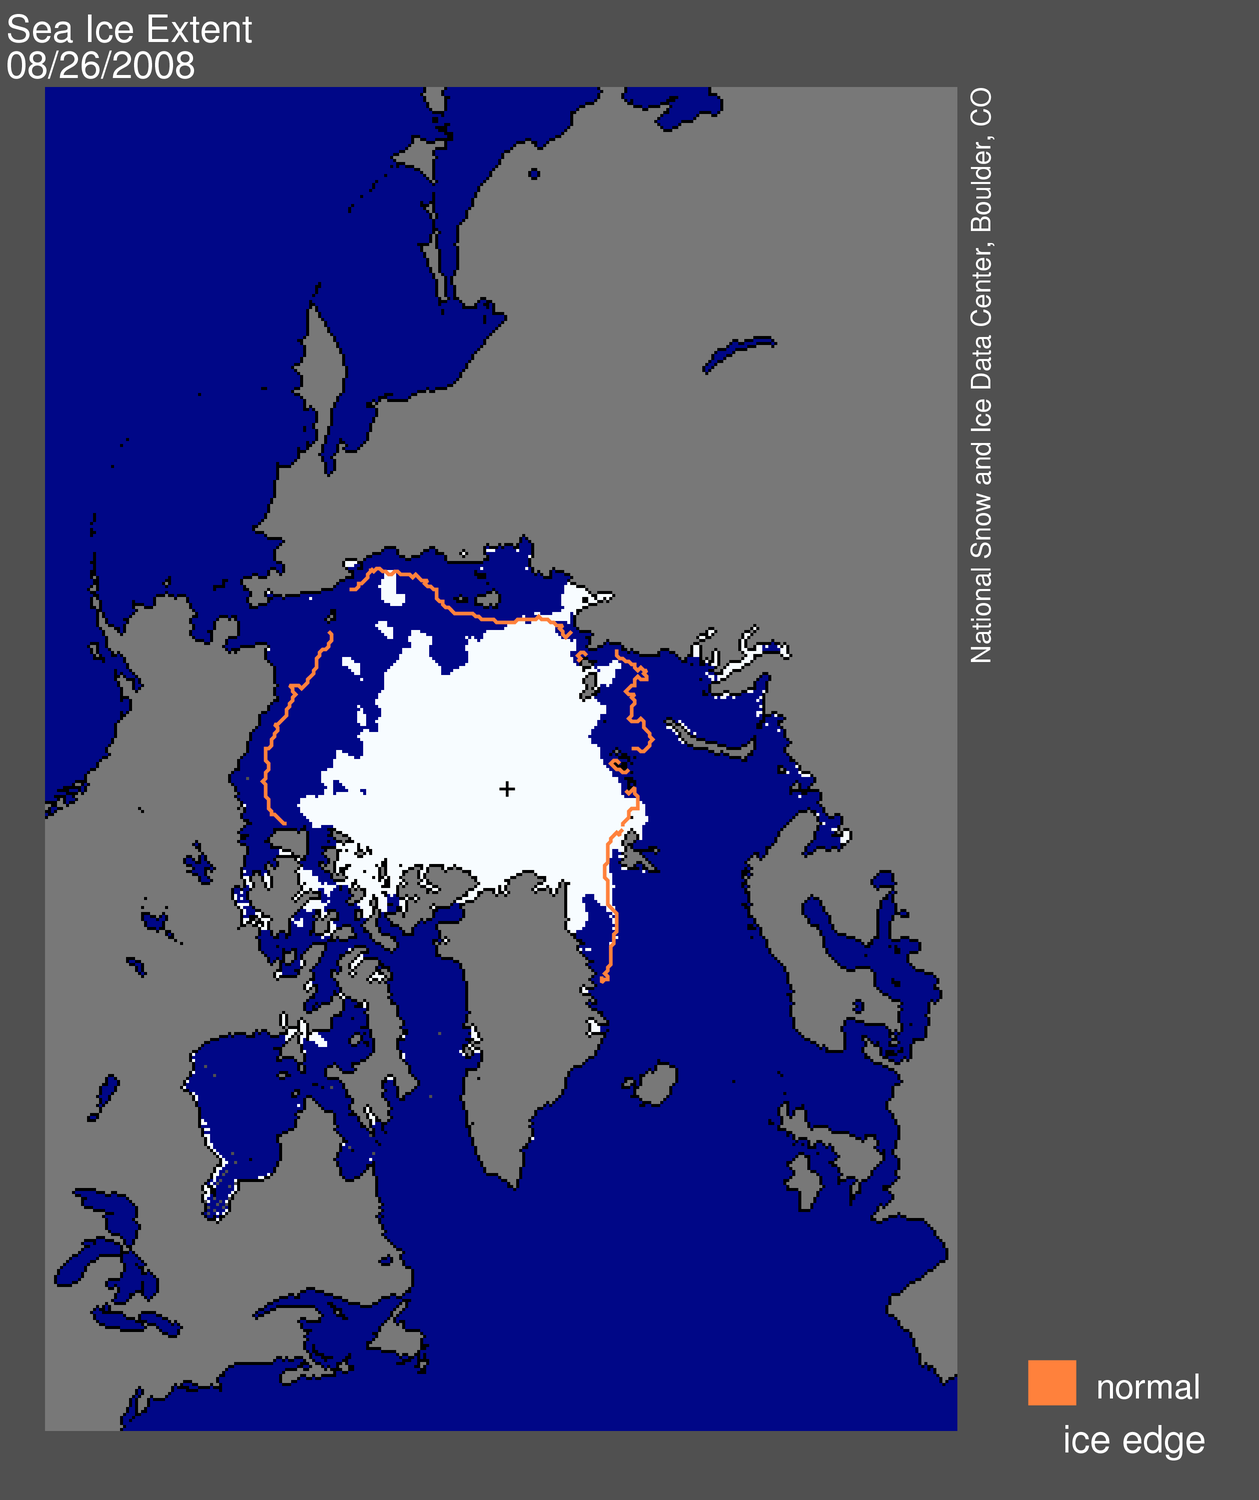
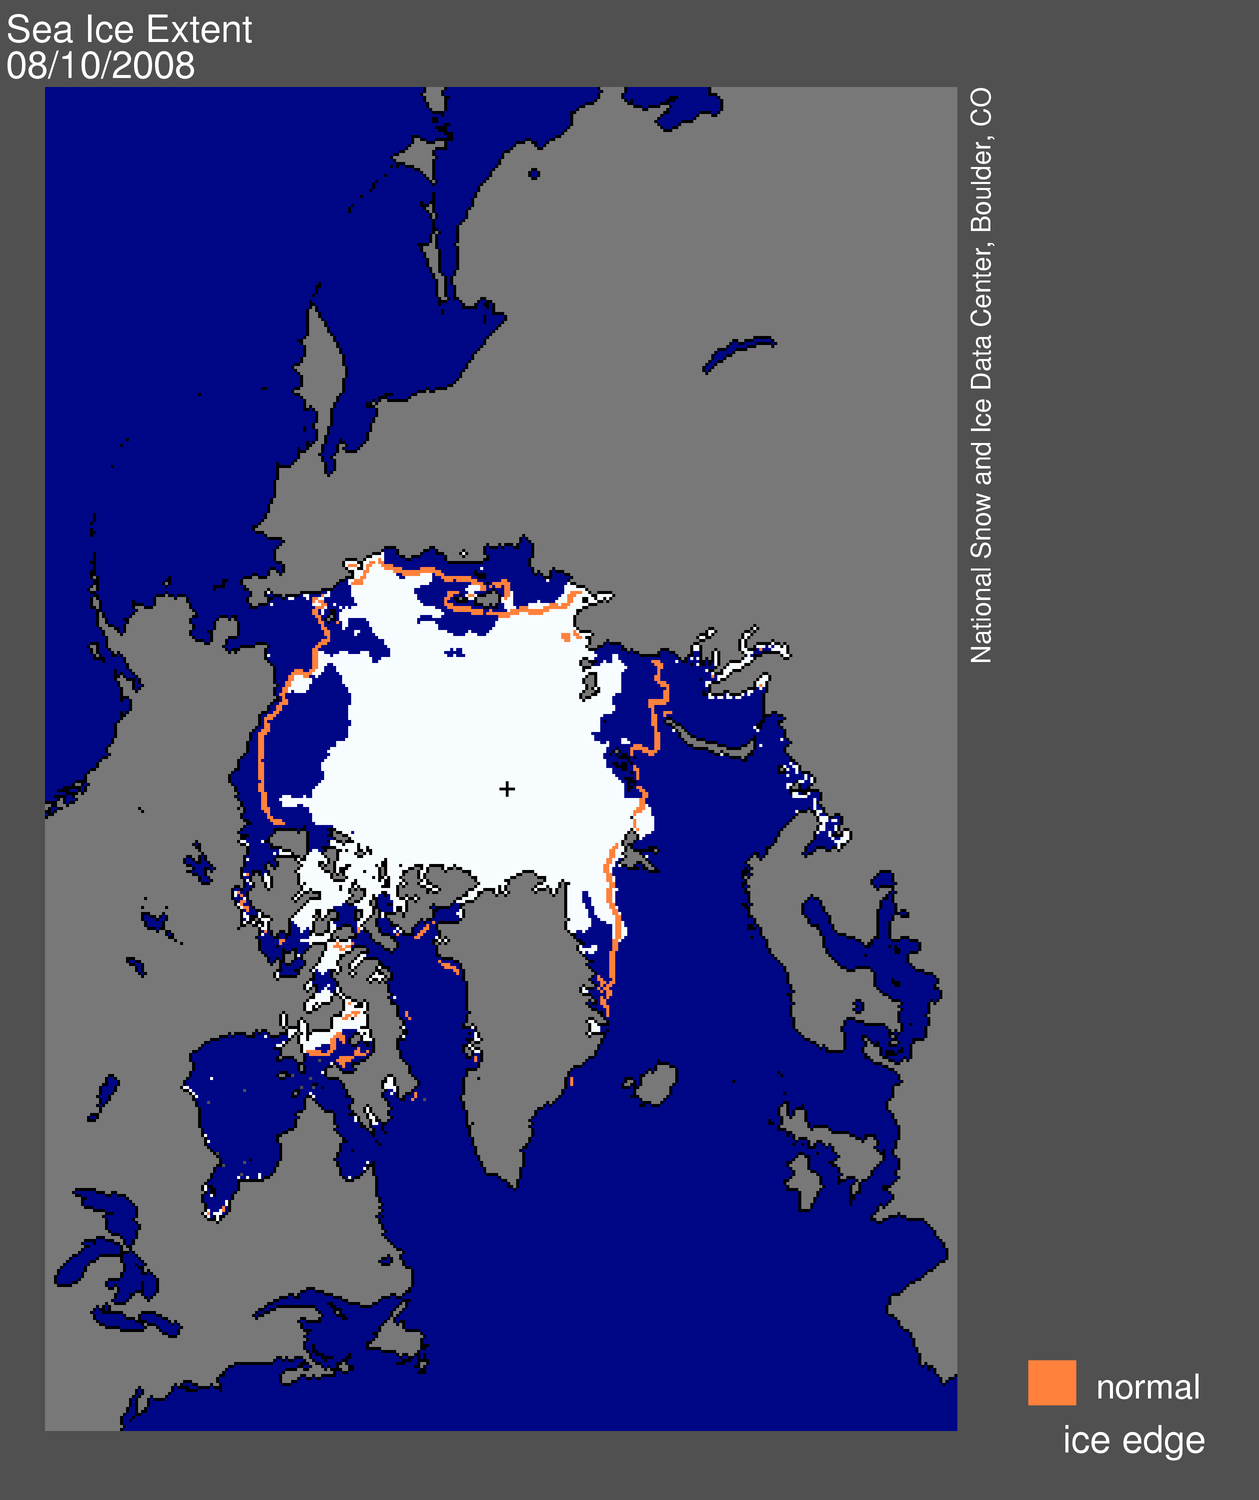
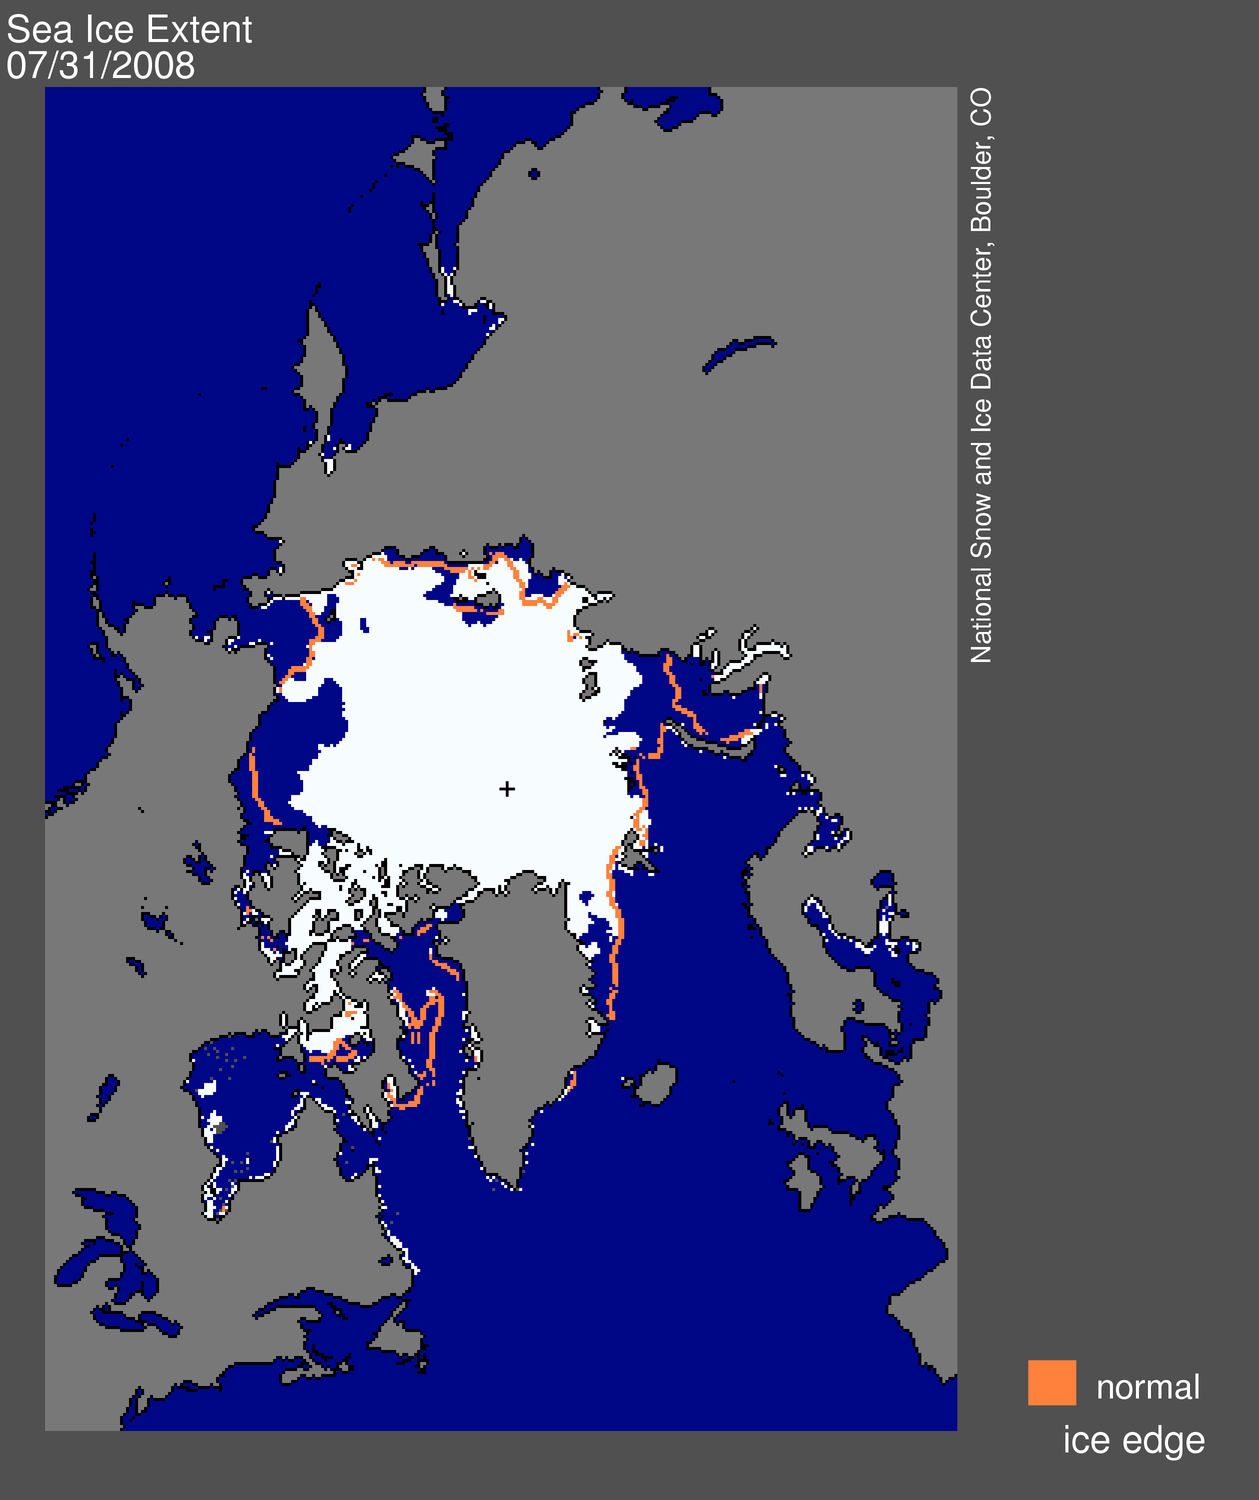
Figure 1. Daily Arctic sea ice extent for August 26, 2008, fell below the 2005 minimum, which was 5.32 million square kilometers (2.05 million square miles). The orange line shows the 1979 to 2000 average extent for that day. The black cross indicates the geographic North Pole. Sea Ice Index data. About the data.
—Credit: National Snow and Ice Data Center
High-resolution image

Overview of conditions

With several weeks left in the melt season, sea ice extent dipped below the 2005 minimum to stand as the second-lowest in the satellite record. The 2005 minimum, at 5.32 million square kilometers (2.05 million square miles), held the record-low minimum until last year.

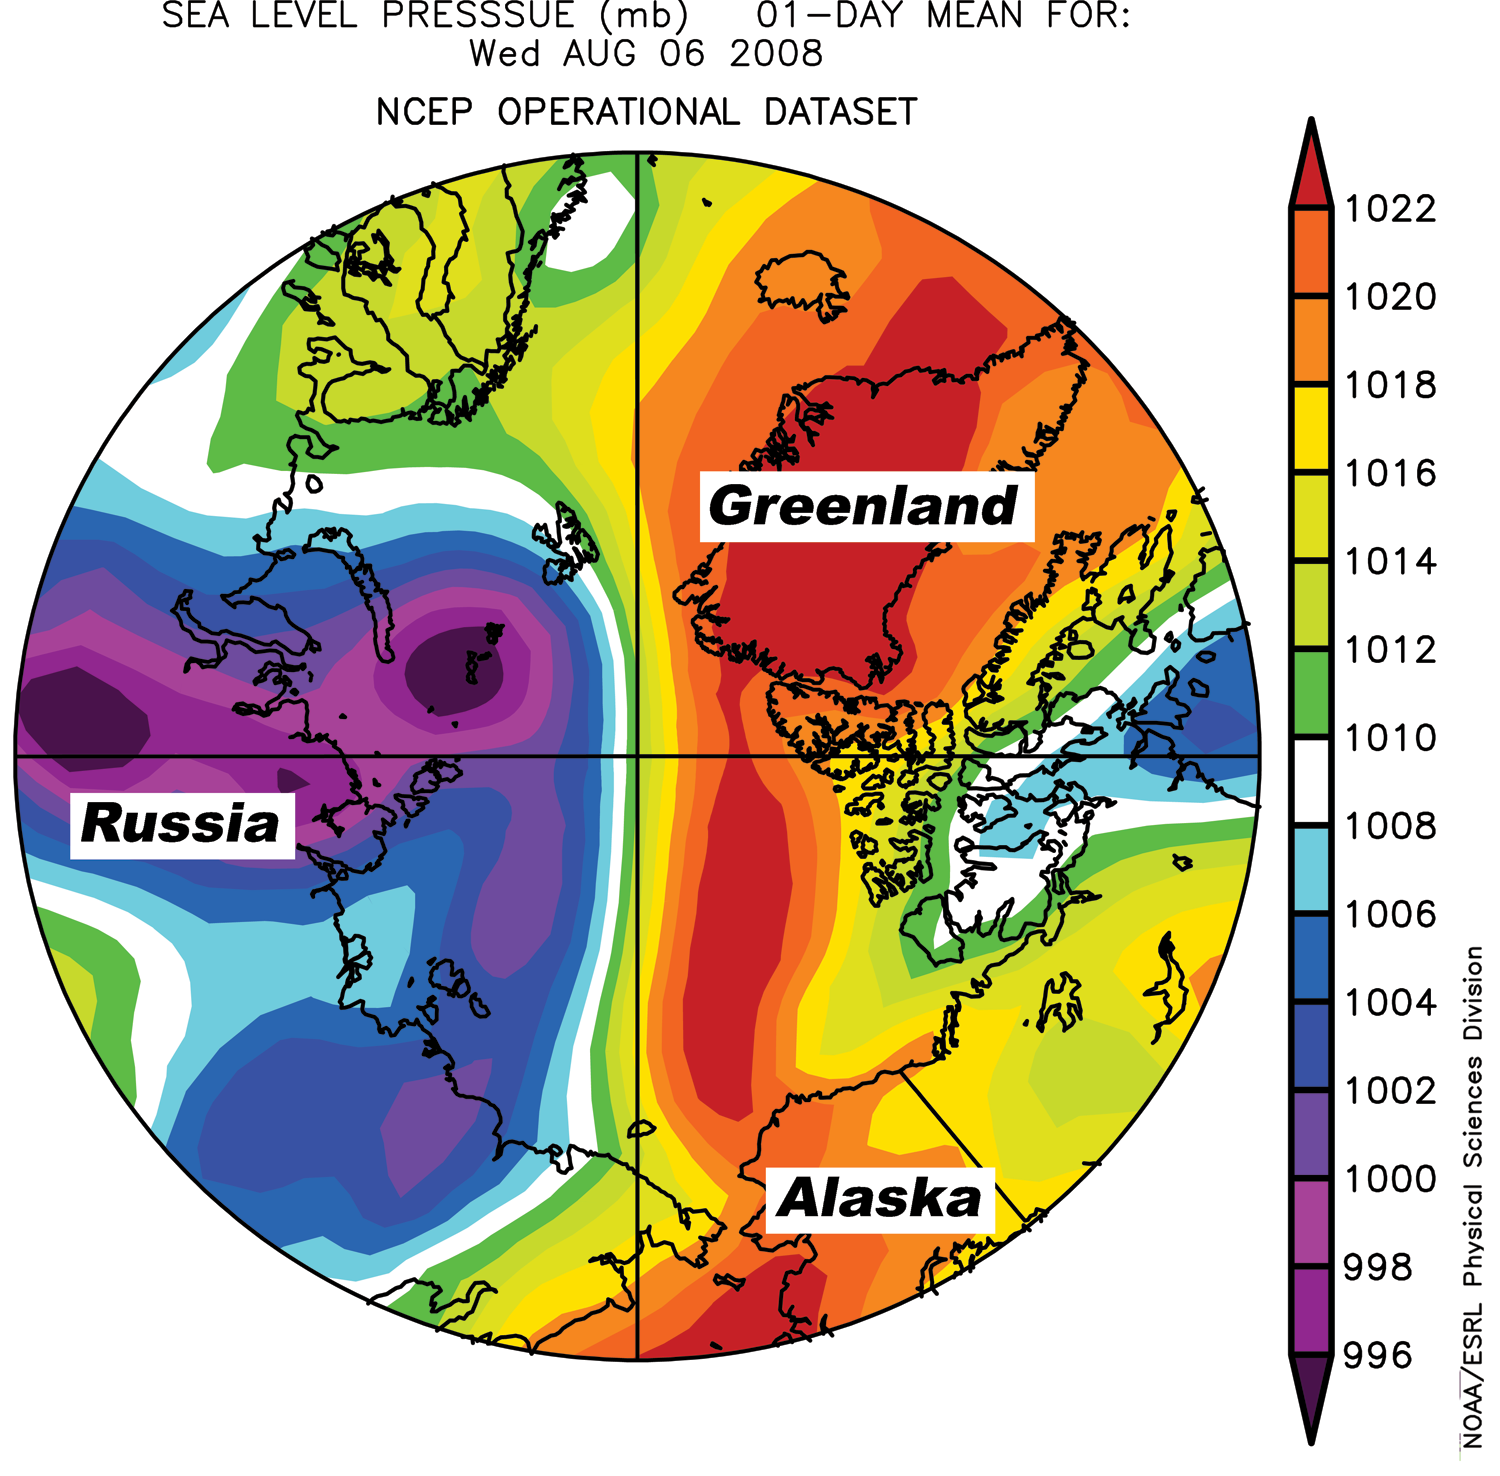
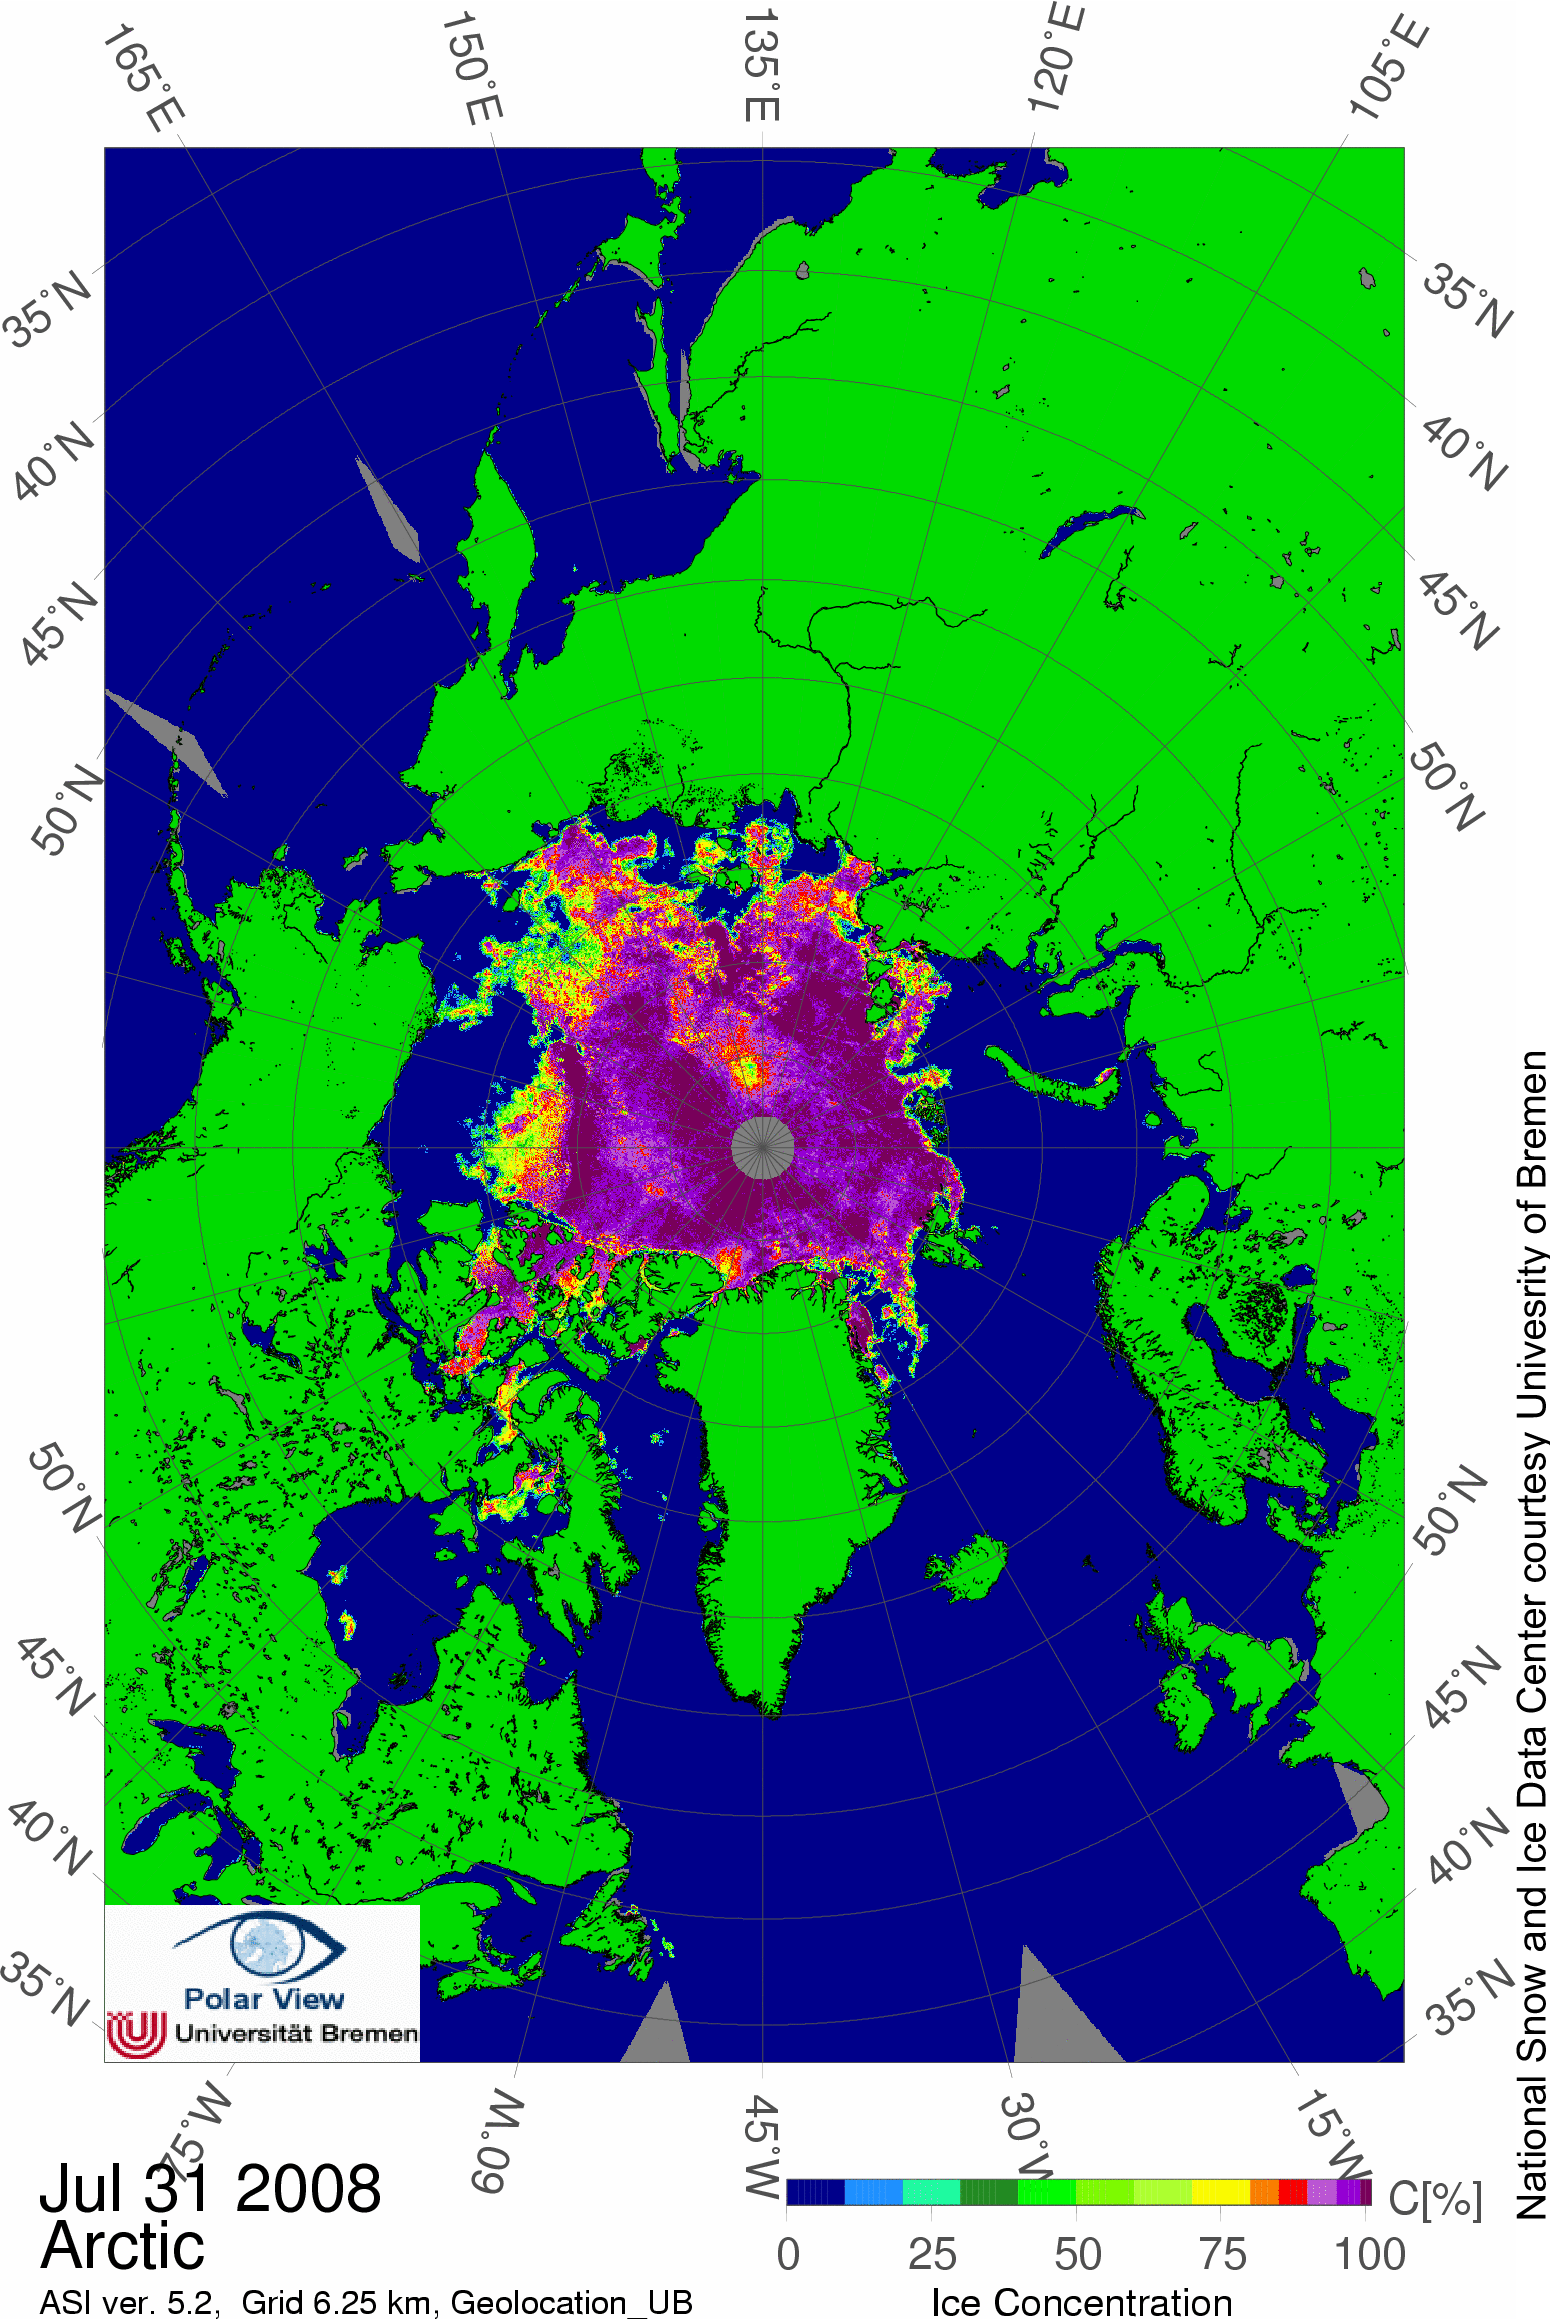
Recent ice retreat primarily reflects melt in the Chukchi Sea off the Alaskan coast and the East Siberian Seas off the coast of eastern Russia.

Update 9:15 am MT August 27:

Arctic sea ice extent on August 26 was 5.26 million square kilometers (2.03 million square miles), a decline of 2.06million square kilometers (795,000 square miles) since the beginning of the month. Extent is now within 430,000 square kilometers (166,000 square miles) of last year’s value on the same date and is 1.97 million square kilometers (760,000 square miles) below the 1979 to 2000 average.

Graph with months on x axis and extent on y axis
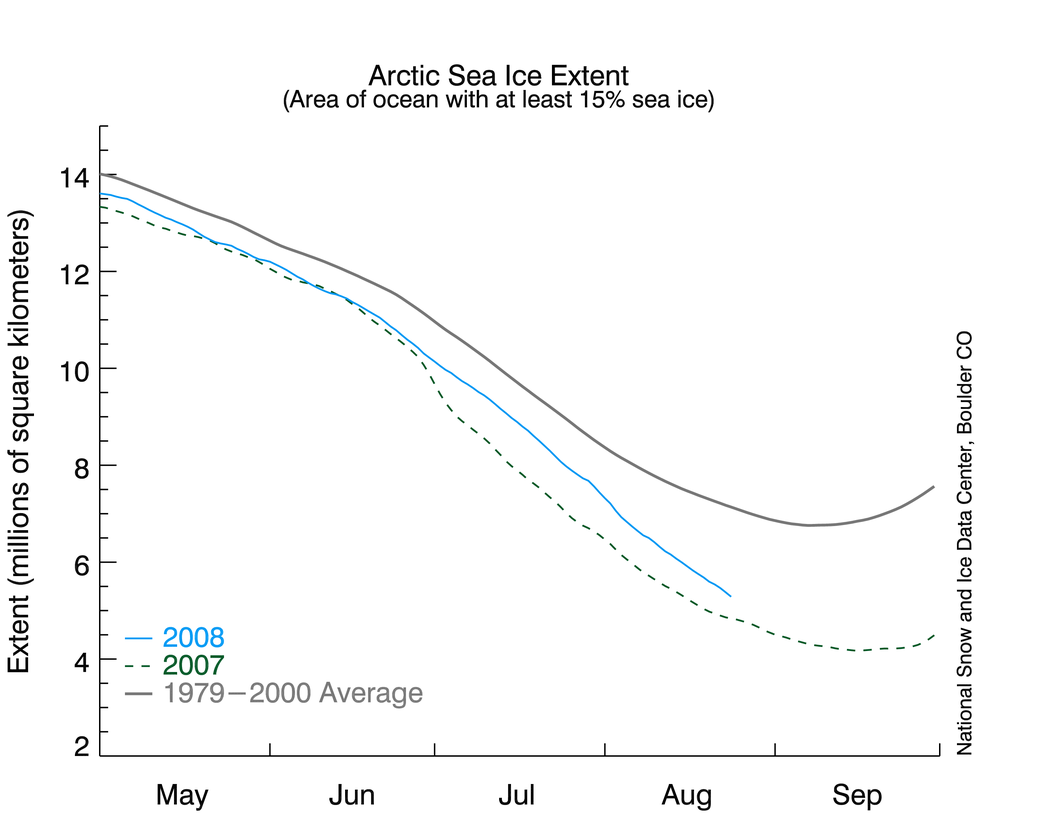
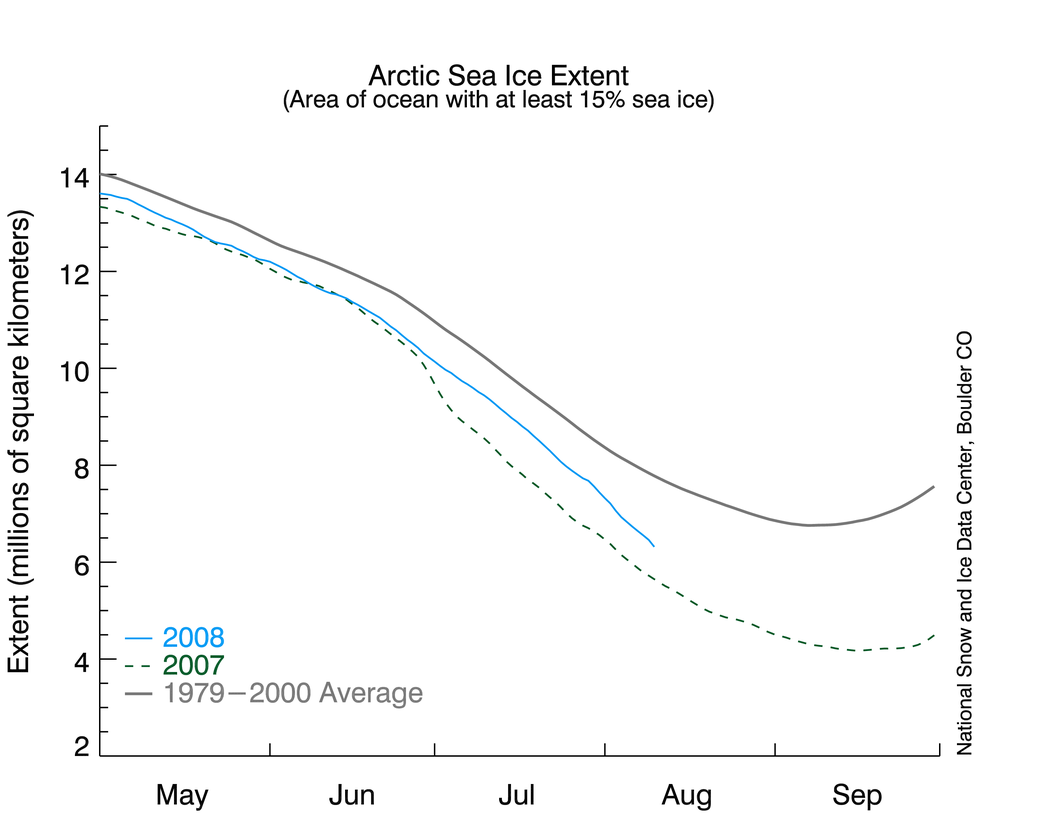
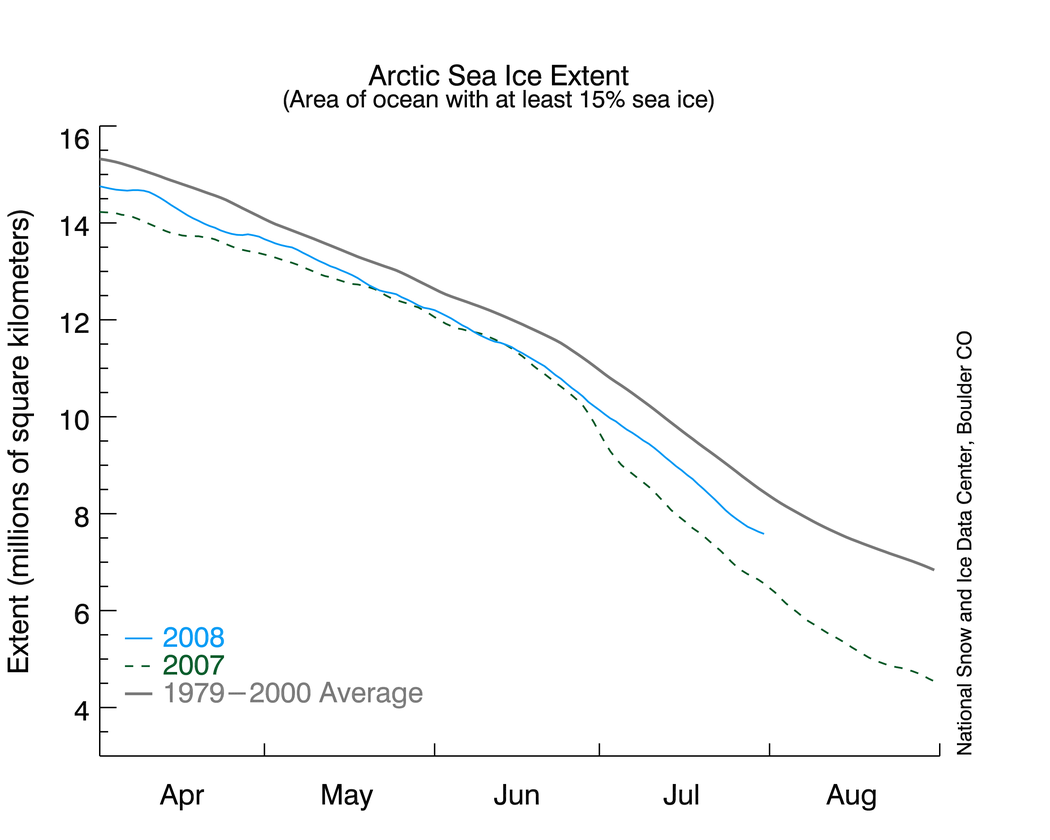
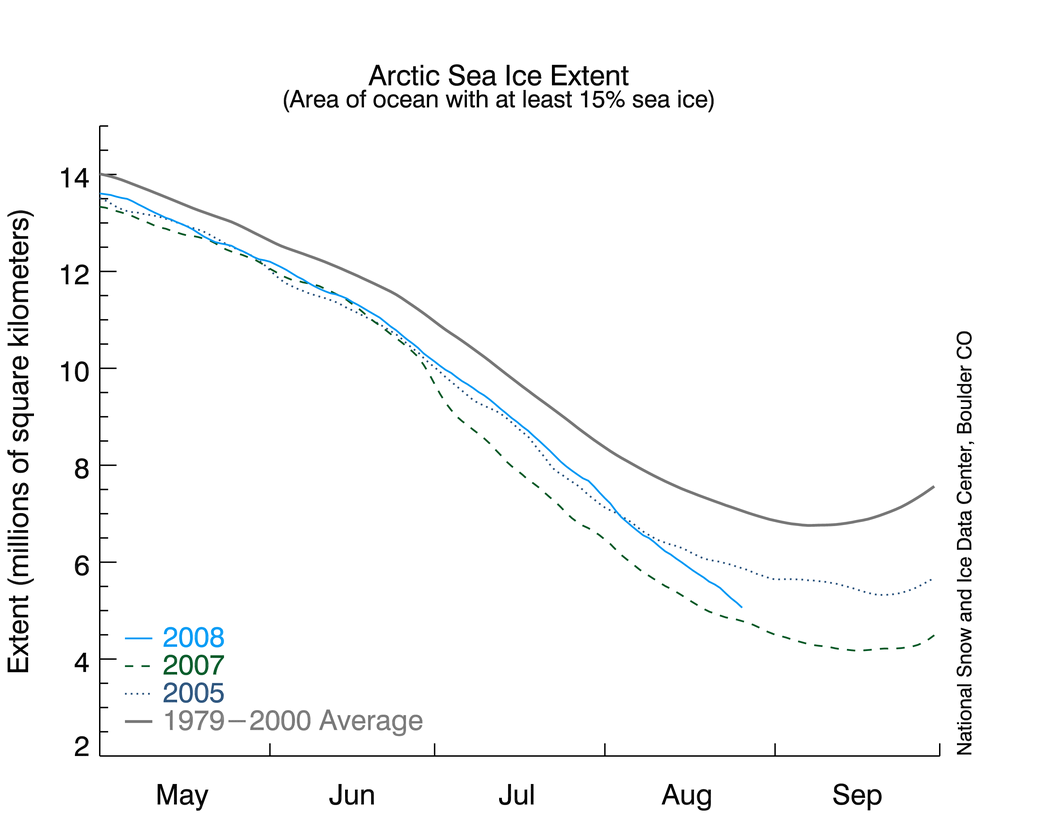
Figure 2. The graph above shows daily sea ice extent.The solid light blue line indicates 2008; the dark blue dotted line indicates 2005; the dashed green line shows extent for 2007; the gray line indicates average extent from 1979 to 2000. Sea Ice Index data.
—Credit: National Snow and Ice Data Center
High-resolution image

Conditions in context

Through the beginning of the melt season in May until early August, daily ice extent for 2008 closely tracked the values for 2005.

In early August of 2005, the decline began to slow; in August of 2008, the decline has remained steadily downward at a brisk pace. The 2005 minimum of 5.32 million square kilometers (2.05 million square miles) occurred on September 21.


For previous analysis, please see the drop-down menu under Archives in the right navigation at the top of this page.

Arctic shortcuts open up; decline pace steady

Sea ice extent is declining at a fairly brisk and steady pace. Surface melt has mostly ended, but the decline will continue for two to three more weeks because of melt from the bottom and sides of the ice. Amundsen’s Northwest Passage is now navigable; the wider, deeper Northwest Passage through Parry Channel may also open in a matter of days. The Northern Sea Route along the Eurasian coast is clear.

Map of sea ice from space, showing sea ice, continents, ocean
Figure 1. Daily Arctic sea ice extent for August 24, 2008, was 5.47 million square kilometers (2.11 million square miles). The orange line shows the 1979 to 2000 average extent for that day. The black cross indicates the geographic North Pole. Sea Ice Index data. About the data.

—Credit: National Snow and Ice Data Center
High-resolution image


Overview of conditions

Arctic sea ice extent on August 24 was 5.47 million square kilometers (2.11 million square miles), a decline of 1.85 million square kilometers (714,000 square miles) since the beginning of the month. Extent is now within 580,000 square kilometers (220,000 square miles) of last year’s value on the same date and is 1.84 million square kilometers (710,000 square miles) below the 1979 to 2000 average.

Graph with months on x axis and extent on y axis
Figure 2. Daily sea ice extent; the blue line indicates 2008; the gray line indicates extent from 1979 to 2000; the dotted green line shows extent for 2007. Sea Ice Index data.
—Credit: National Snow and Ice Data Center
High-resolution image


Conditions in context

Since our August 11 update, sea ice extent has declined at a fairly steady yet brisk pace. Since August 8, atmospheric circulation has settled into a pattern with high pressure covering most of the Beaufort, Chukchi, and East Siberian Seas. Recent ice losses have been most pronounced along the northern edge of eastern Siberia, which is consistent with generally southerly winds and above-average temperatures in this region.

Based on NASA Advanced Microwave Scanning Radiometer—Earth Observing System (AMSR-E) satellite images from the University of Bremen the wider, deeper Northwest Passage through the Parry Channel is almost open. The United States National Ice Center confirms that Amundsen’s Northwest Passage is navigable. The AMSR-E data furthermore indicate that the Northern Sea Route (also called the Northeast Passage) is open.

Last August, the Amundsen and Parry Channel routes both opened, but the Northern Sea Route remained blocked.

Animation provides a closer look at the melt

NSIDC has released new animations for Google Earth showing daily sea ice concentrations and extent in the Arctic. Click on the still image in Figure 3 to view a Quick Time animation of daily sea ice concentration over the past 90 days. Note the recent strong losses of ice north of Siberia.

Users who wish to manipulate the animation and access the daily updated animation may now download them from the NSIDC Virtual Globes page. Daily sea ice extent updates are automatically loaded into Google Earth so users always have the most recent files; 30-, 60-, and 90-day versions are available. To download the Google Earth files, learn more about Google Earth, or to find out how to read the time-slider tutorial, see http://nsidc.org/data/virtual_globes/.

Sea ice from space overlaid with information concerning ice thickness
Figure 4. Ice thickness measurements for summer 2008 indicate melt at the ice surface (red) versus the underside (yellow). This image shows changes in ice thickness at buoy locations (white circles), overlaid on the NSIDC sea ice concentration field for August 20. The numbers above each bar plot indicate total ice thickness at the beginning of the melt season compared to August 20.

—Credit: From National Snow and Ice Data Center courtesy D. Perovich, CRREL
High-resolution image


Changing ice thickness

As discussed in a number of previous postings (July 17, April 7), sea ice thickness is a key measure of the health of the sea ice. While the NASA ICESat sensor can give an overall picture of ice thickness over the Arctic Ocean, the most accurate way to measure ice thickness is by taking point measurements on the ground. Don Perovich, Jackie Richter-Menge, Bruce Elder, and Chris Polashenski at the United States Army Cold Regions Research and Engineering Laboratory track the evolution of sea ice thickness year round using autonomous buoys. The buoys are deployed as part of the North Pole Environmental Observatory, the Beaufort Gyre Observatory, and the DAMOCLES project. The buoy data have indicated increased amounts of melt on the underside of the ice cover in recent years; bottom melt last year was particularly extreme.

The pattern for 2008 has been more mixed. The ice at some buoy locations has thinned by more than a meter through the melt season because of strong melt both on the surface and the underside of the ice. Other locations show strong thinning caused by surface melt, while only modest thinning is apparent in others. Differences in surface melt from location to location reflect factors such as air temperature, the ice albedo, and cloud conditions. The wide range in bottom melt points to variations in the amount of ocean heat absorbed. In recent days, the buoys have indicated sub-freezing temperatures with surface melt coming to an end; however, bottom melt will continue for at least two to three more weeks and the ice extent decline, while slowing, will also continue.

For previous analysis, please see the drop-down menu under Archives in the right navigation at the top of this page.

Sea ice decline accelerates, Amundsen’s Northwest Passage opens

The pace of sea ice loss sharply quickened in the past ten days, triggered by a series of strong storms that broke up thin ice in the Beaufort and Chukchi Seas. Amundsen’s historic Northwest Passage is opening up; the wider and deeper route through Parry Channel is currently still clogged with ice.

Note: Analysis updates, unless otherwise noted, now show a single-day extent value for Figure 1, as opposed to the standard monthly average. While monthly average extent images are more accurate in understanding long-term changes, the daily images are helpful in monitoring sea ice conditions in near-real time.

Map of sea ice from space, showing sea ice, continents, ocean

Figure 1. Daily Arctic sea ice extent for August 10, 2008, was 6.54 million square kilometers (2.52 million square miles). The orange line shows the 1979 to 2000 average extent for that day. The black cross indicates the geographic North Pole. Sea Ice Index data. About the data.
—Credit: National Snow and Ice Data Center
High-resolution image


Overview of conditions

Arctic sea ice extent on August 10 was 6.54 million square kilometers (2.52 million square miles), a decline of 1 million square kilometers (390,000 square miles) since the beginning of the month. Extent is now within 780,000 square kilometers (300,000 square miles) of last year’s value on the same date and is 1.50 million square kilometers (580,000 square miles) below the 1979 to 2000 average.

Graph with months on x axis and extent on y axis

Figure 2. Daily sea ice extent; the blue line indicates 2008; the gray line indicates extent from 1979 to 2000; the dotted green line shows extent for 2007. Sea Ice Index data.
—Credit: National Snow and Ice Data Center
High-resolution Image

Conditions in context

Ice extent has begun to decline sharply. The decline rate surged to -113,000 square kilometers per day on August 7 and as of August 10 was -103,000 square kilometers per day. This compares to the long-term average decline of -76,000 square kilometers per day for this time of year. Normally, the peak decline rate is in early July.

Many of the areas now seeing a rapid retreat saw an early melt onset (see July 2, 2008); this helped set the stage for rapid retreat (July 17 and April 7). However, the more fundamental issue is that these regions started the melt season covered with thin first-year ice, which is especially vulnerable to melting out completely. Thin ice is also vulnerable to breakup by winds; the last ten days have seen a windy, stormy pattern that has accelerated the ice loss.

Satellite view of Arctic shwoing color bandsFigure 3. Sea-level pressure for August 8, 2008, shows a weather pattern favoring ice melt. Areas of high pressure are shown in yellow and red; areas of low pressure are shown in blue and purple.
—Credit: From National Snow and Ice Data Center courtesy Climate Diagnostic Center
High-resolution image


Storms trigger increased melt

A series of storms north of Alaska and Siberia in late July and early August have helped break up the thin ice and have brought warm southerly winds into the region.

Subsequently, a pattern has developed with high pressure over the Beaufort Sea and low pressure over the Laptev and East Siberian Seas (Figure 3). In accord with Buys Ballot’s Law, this pattern has brought southerly winds to the region, enhancing melt, breaking up ice, and pushing the ice edge northward.

view of North Passage area from space
Figure 4. Passive-microwave satellite data shows ice concentration on August 10, 2008, over the Northwest Passage region. The yellow line indicates Amundsen’s historic route through the passage. NASA AMSR-E data.

—Credit: From National Snow and Ice Data Center courtesy University of Bremen
High-resolution image


Opening of Amundsen’s Northwest Passage

The Northwest Passage that Roald Amundsen navigated with great difficulty starting in 1903 is opening for the second year in a row, as shown in the AMSR-E sea ice product from the University of Bremen (Figure 4).

The most recent operational analysis from the Canadian Ice Service and the U.S. National Ice Center on August 8 showed a small section of Amundsen’s historic path still blocked by a 50-kilometer (31-mile) stretch of sea ice, although that should melt within the next few days.

Amundsen’s route requires sailing through treacherous narrow and shallow channels, making it impractical for deep-draft commercial ships. The more important northern route, through the wide and deep Parry Channel, is still ice-clogged. The northern route opened in mid-August last year; it may still open up before the end of this year’s melt season.

For previous analysis, please see the drop-down menu under Archives in the right navigation at the top of this page.


Race between waning sunlight and thin ice

The Arctic sea ice is now at the peak of the melt season. Although ice extent is below average, it seems less likely that extent will approach last year’s record low.

The pace of summer decline is slower than last year’s record-shattering rate, and peak sunlight has passed with the summer solstice.  However, at least six weeks of melt are left in the season and much of the remaining ice is thin and vulnerable to rapid loss. A race has developed between the waning sunlight and the weakened ice.

Note: Analysis updates, unless otherwise noted, now show a single-day extent value for Figure 1, as opposed to the standard monthly average. While monthly average extent images are more accurate in understanding long-term changes, the daily images are helpful in monitoring sea ice conditions in near-real time.

Map of sea ice from space, showing sea ice, continents, ocean
Figure 1. Daily Arctic sea ice extent for July 31, 2008 was 7.71 million square kilometers (3.98 million square miles). The orange line shows the 1979-2000 average extent for that day. The black cross indicates the geographic North Pole. Sea Ice Index data. About the data

—Credit: National Snow and Ice Data Center
High-resolution image

Overview of conditions

Arctic sea ice extent on July 31 stood at 7.71 million square kilometers (2.98 million square miles). While extent was below the 1979 to 2000 average of 8.88 million square kilometers (3.43 million square miles), it was 0.89 million square kilometers (0.34 million square miles) above the value for July 31, 2007. As is normal for this time of year, melt is occurring throughout the Arctic, even at the North Pole.


Graph with months on x axis and extent on y axis
Figure 2. Daily sea ice extent; the blue line indicates 2008; the gray line indicates extent from 1979 to 2000; the dotted green line shows extent for 2007. Sea Ice Index data.
—Credit: National Snow and Ice Data Center
High-resolution Image

Conditions in context

Sea ice extent continues to decline, but we have not yet seen last July’s period of accelerated decline. Part of the explanation is that temperatures were cooler in the last two weeks of July, especially north of Alaska.

Because we are past the summer solstice, the amount of potential solar energy reaching the surface is waning. The rate of decline should soon start to slow, reducing the likelihood of breaking last year’s record sea ice minimum.

graph showing projections of 2008 sea ice minimum
Figure 3. Using average long-term decline rates is one way to project sea ice extent at the end of the 2008 season. The bottom dashed line shows decline rate one standard deviation faster than normal, the middle dashed line shows decline at average rates, and the top dashed line shows decline rate one standard deviation slower.
—Credit: National Snow and Ice Data Center
High-resolution image

Slower decline than 2007

To estimate the range of possibilities, we have used average long-term daily decline rates to project ice extent during the rest of the season (dashed blue lines). The bottom dashed line shows decline rate one standard deviation faster than normal, the middle dashed line shows decline at average rates, and the top dashed line shows decline rate one standard deviation slower.

If the Arctic experiences a normal decline rate, the minimum extent will be between the second-lowest extent, which occurred in 2005, and the third-lowest extent, which occurred in 2002. Even at a rate one standard deviation faster than normal, the extent will not fall below last year’s minimum—so it appears unlikely that we will set a new record low.

View of Arctic from above
Figure 4. Passive-microwave satellite data shows ice concentration on July 31, 2008. Widespread areas of low concentration ice exist, shown in yellows. NASA AMSR-E data.
—Credit:From National Snow and Ice Data Center courtesy University of Bremen
High-resolution image


But a more vulnerable ice cover

Nevertheless, it is perhaps too soon to make a definitive pronouncement concerning this year’s probable extent at the summer minimum.  The Arctic sea ice is in a condition we have not seen since satellites began taking measurements. As discussed in our April analysis, thin first-year ice dominated the Arctic early in the melt season. Thin ice is much more vulnerable to melting completely during the summer; it seems likely that we will see a faster-than-normal rate of decline through the rest of the summer.

Building on our July 17 analysis, the fragility of the current ice conditions is evident in the sea ice concentration fields produced at the University of Bremen using NASA Advanced Microwave Sounding Radiometer (AMSR) data. Widespread areas of reduced ice concentration exist, particularly in the Beaufort Sea. Even north of 85 degrees latitude, pockets of much-reduced ice cover appear. The passive microwave data used in Figure 4 tends to underestimate ice concentration during summer because melt water on the surface of the ice can be mistaken for open water. Nevertheless, such low concentrations indicate strong melt and a broken, thin ice cover that is potentially vulnerable to rapid melt.

View of Arctic from above showing ice age
Figure 5.Visible-band satellite imagery confirms the low-concentration ice cover seen in Figure 4. This view places NASA MODIS Aqua data in a perspective generated in Google Earth, simulating a view from far above Earth.

—Credit: From National Snow and Ice Data Center courtesy NASA
High-resolution image

Visible imagery confirms weak ice cover

Visible-band imagery from the NASA Moderate Resolution Imaging Spectroradiometer (MODIS) sensor shows a more detailed picture of the ice than AMSR-E. Looking east into the Northwest Passage on July 28, the image confirms the low ice concentrations revealed in the AMSR-E data.

So, will we break last year’s record low minimum extent? Will the North Pole become ice-free? Probably not this year. However, the ice is in a vulnerable state and there are six weeks of melting left, so a lot can still happen.

And perhaps the most important point as we continue to watch this season’s evolving ice cover is that, whether or not Arctic sea ice sets a new record low, this year continues the pattern of well-below-average ice extent seen in recent years.

For previous analysis, please see the drop-down menu under Archives in the right navigation at the top of this page.