July is the warmest month in the Arctic and hence also the month of peak sea ice loss. As of the middle of July 2024, extent is declining at an above average pace. Sea is mostly gone in Hudson Bay, and there has been extensive retreat in the Barents and Laptev Seas. Satellite data reveal a small area of unusually dense sea ice formed last winter near Wrangel Island.
Overview of conditions
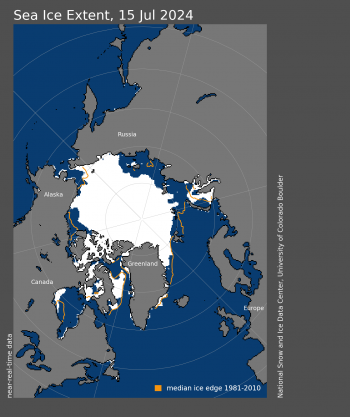
Figure 1a. Arctic sea ice extent for July 15, 2024, was 8.16 million square kilometers (3.15 million square miles). The orange line shows the 1981 to 2010 average extent for that day. Sea Ice Index data. About the data
Credit: National Snow and Ice Data Center
High-resolution image
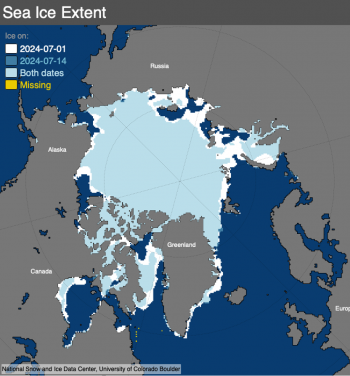
Figure 1b. This map compares Arctic sea ice extents between July 1, 2024 and July 14, 2024 using the NSIDC comparison tool.
Credit: National Snow and Ice Data Center
High-resolution image
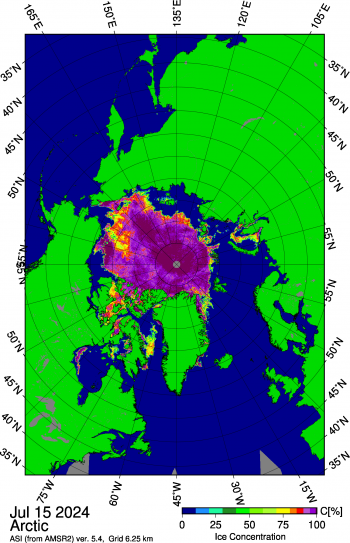
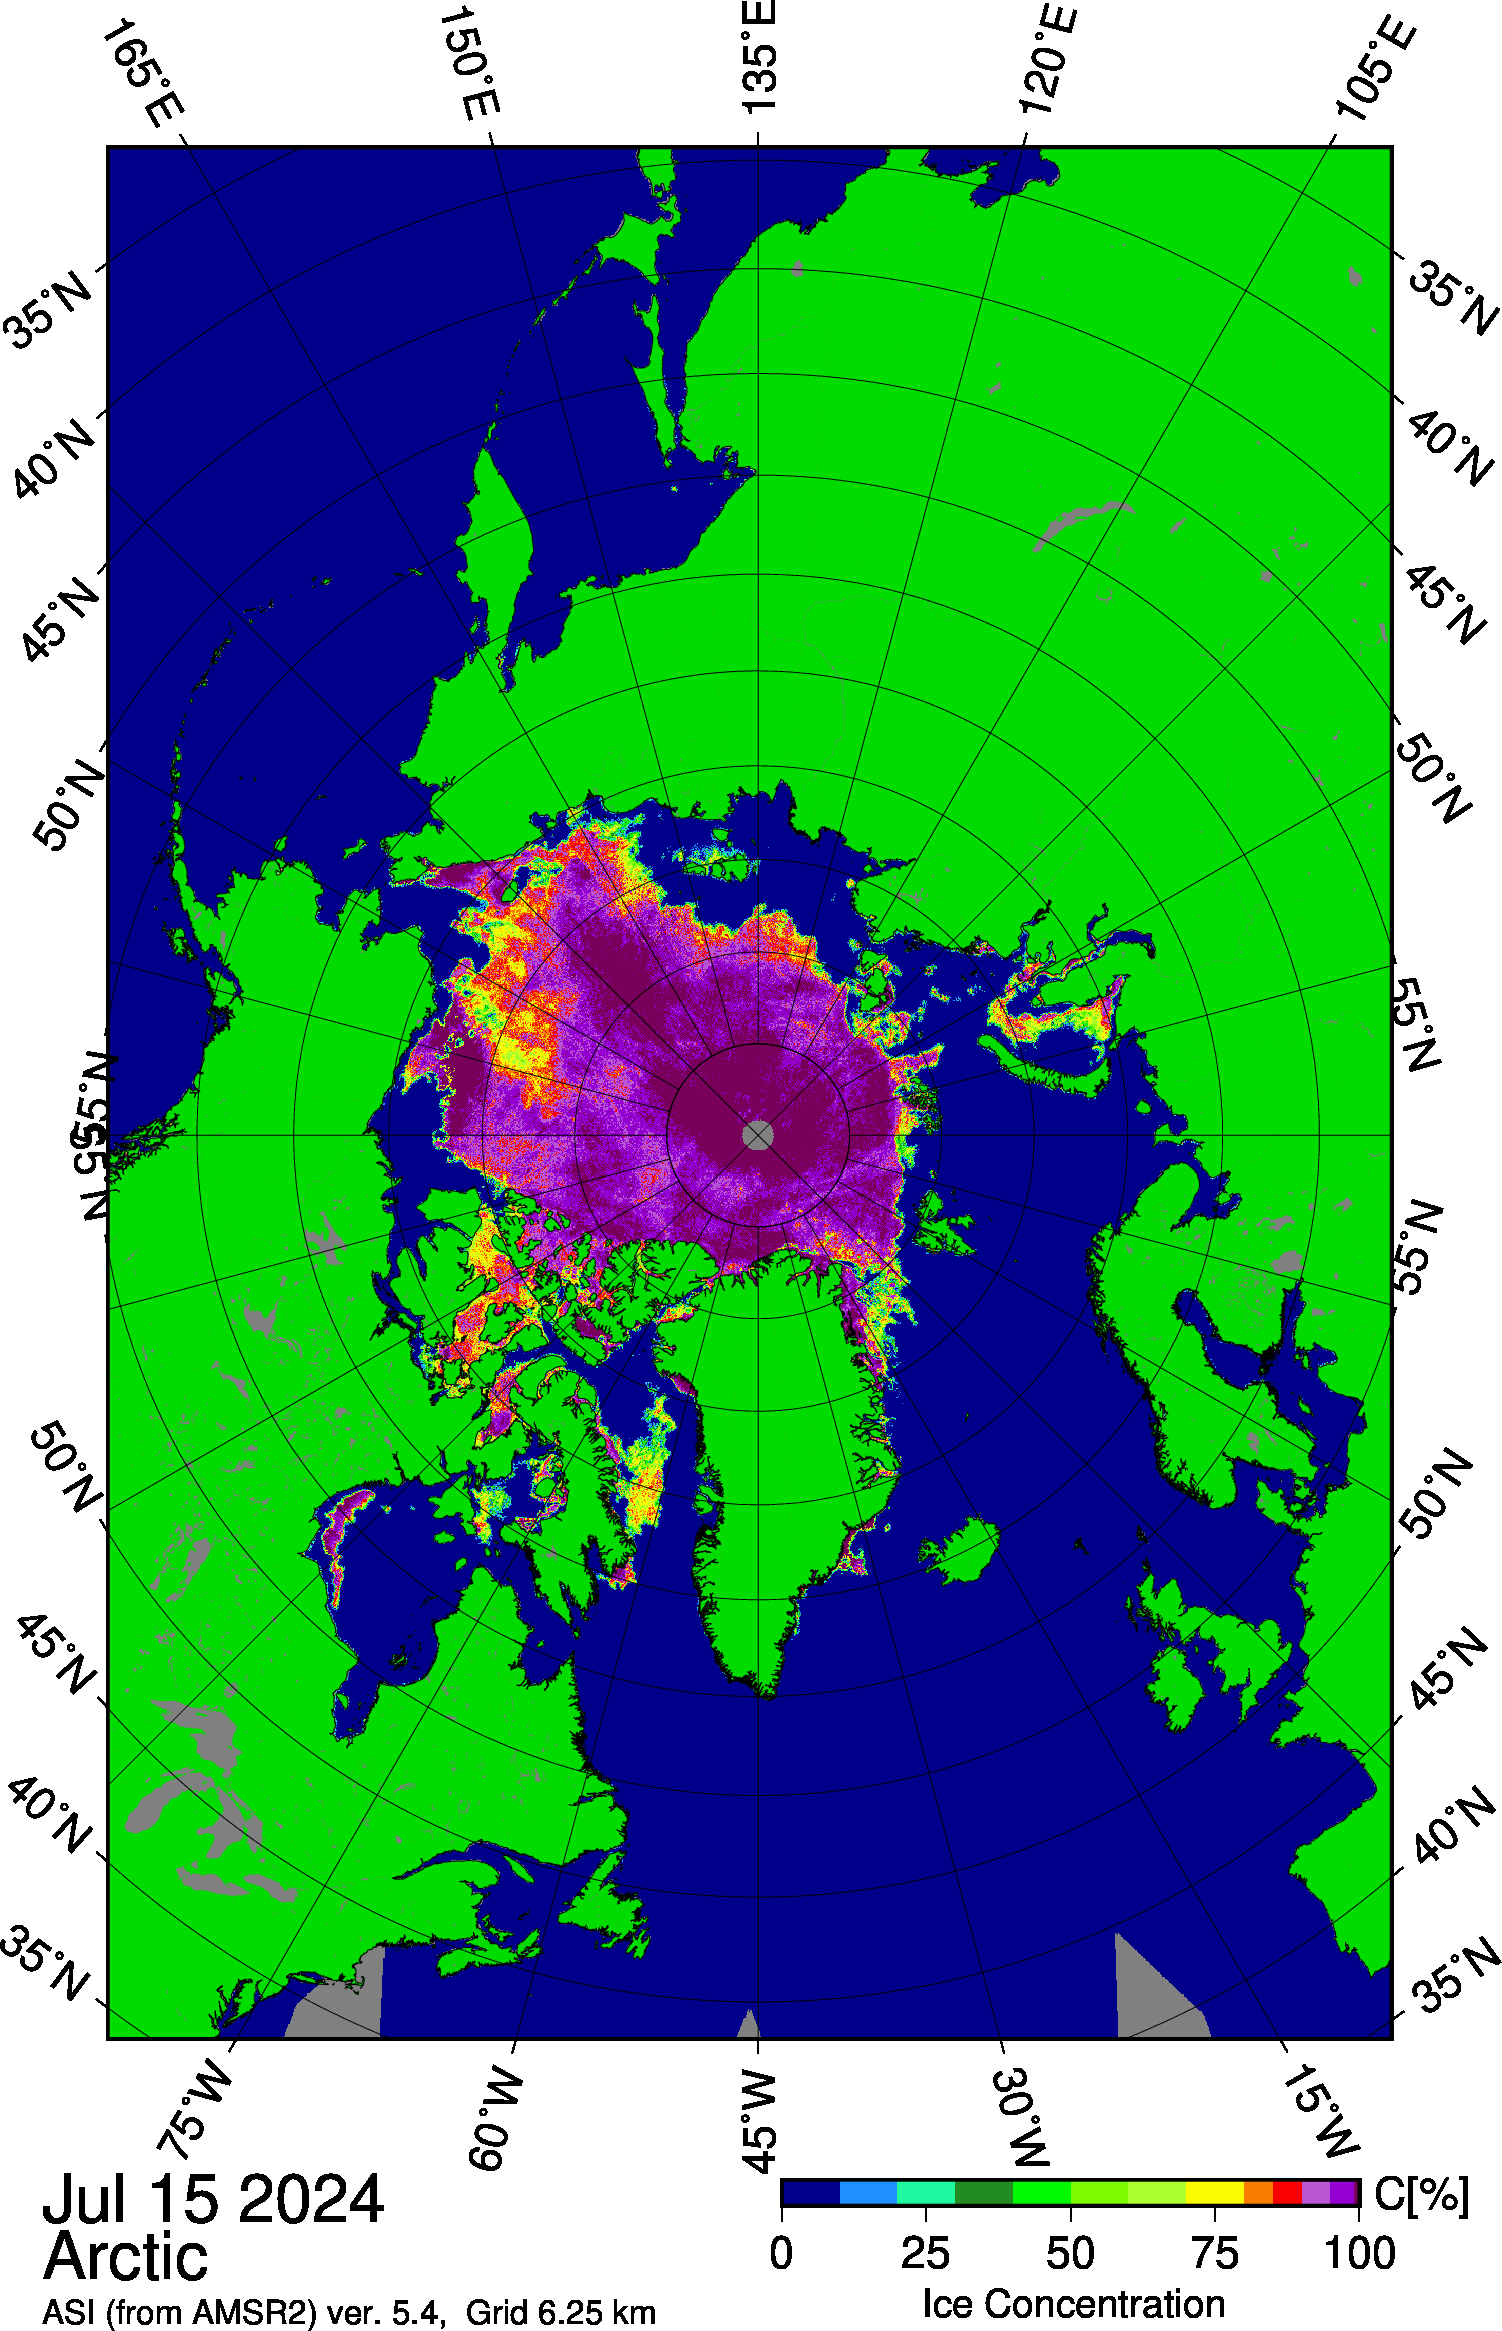
Figure 1c. This image from the Japan Aerospace Exploration Agency (JAXA) Advanced Microwave Scanning Radiometer 2 (AMSR2) shows sea ice concentration in the Arctic Ocean on July 15, 2024, highlighting areas of low concentration ice north of Alaska and in the East Siberian Sea, interspersed with areas of more compact ice, especially south and east of Wrangel Island.
Credit: Japan Aerospace Exploration Agency, courtesy University of Bremen
High-resolution image
On July 15, 2024, halfway through the month, sea ice extent stood at 8.16 million square kilometers (3.15 million square miles), ranking seventh lowest in the satellite passive microwave record for that date. The rate of ice loss from July 1 to July 15 of 121,000 square kilometers (47,000 square miles) per day was above the average value of 89,000 square kilometers (34,000 square miles) per day. As assessed using the NSIDC sea ice spatial comparison tool, ice losses over the past two weeks have been most notable along the Eurasian coast, particularly over the northern Barents and Laptev Seas (Figure 1b). Some ice still remains in western Hudson Bay. Data from the Advanced Microwave Scanning Radiometer 2 (AMSR-2) instrument aboard the Japan Aerospace Exploration Agency (JAXA) Global Change Observation Mission-Water (GCOM-W) satellite shows areas of low concentration ice north of Alaska and in the East Siberian Sea, interspersed with areas of more compact ice, especially south and east of Wrangel Island (Figure 1c). Ice over the central Arctic Ocean remains compact.
Conditions in context
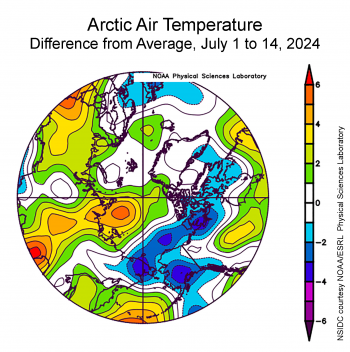
Figure 2a. This plot shows the departure from the 1991 to 2020 average air temperature in the Arctic at the 925 hPa level, in degrees Celsius, from July 1 to 14, 2024. Yellows and reds indicate above average temperatures; blues and purples indicate below average temperatures.
Credit: NSIDC courtesy NOAA Earth System Research Laboratory Physical Sciences Laboratory
High-resolution image

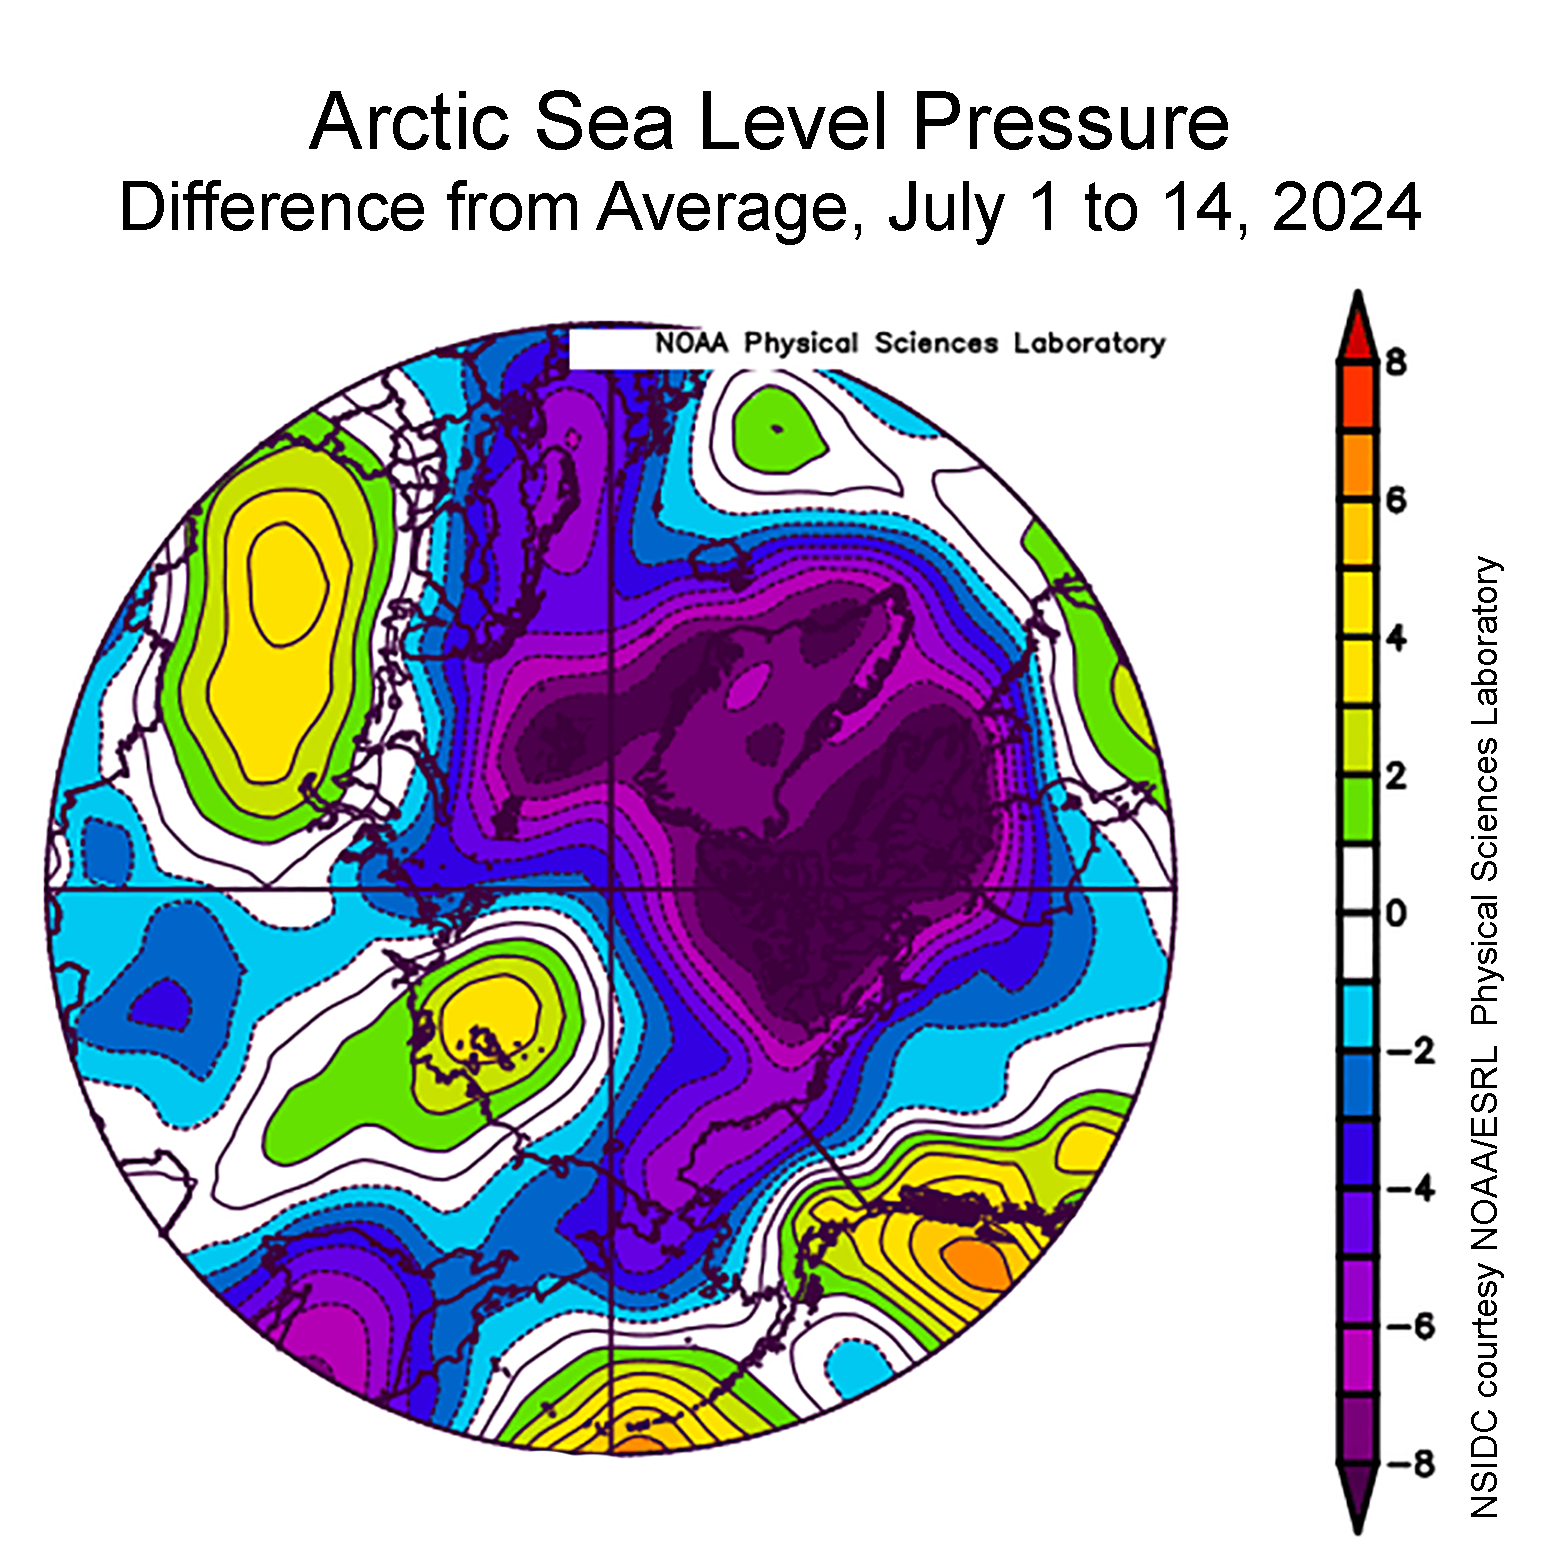
Figure 2b. This plot shows the departure from the 1991 to 2020 average sea level pressure in the Arctic in millibars from July 1 to 14, 2024. Yellows and reds indicate above average air pressures; blues and purples indicate below average air pressures.
Credit: NSIDC courtesy NOAA Earth System Research Laboratory Physical Sciences Laboratory
High-resolution image
Air temperature at the 925 hPa level (about 2,500 feet above the surface) averaged over the first two weeks of July was 2 to 6 degrees Celsius (4 to 11 degrees Fahrenheit) above average over the Laptev Sea, where substantial sea ice losses have been observed so far in the month (Figure 2a). Temperatures were also 2 to 4 degrees Celsius (4 to 7 degrees Fahrenheit) below average extending from the East Siberian Sea, across the Beaufort Sea, and in the western Canadian Arctic Archipelago. In contrast to June 2024, which was characterized by a strong Beaufort High, the sea level pattern for the first two weeks of July 2024 features below average pressure covering much of the Arctic Ocean, with a small area of above-average pressures centered over the Laptev Sea (Figure 2b).
Sea surface temperature update
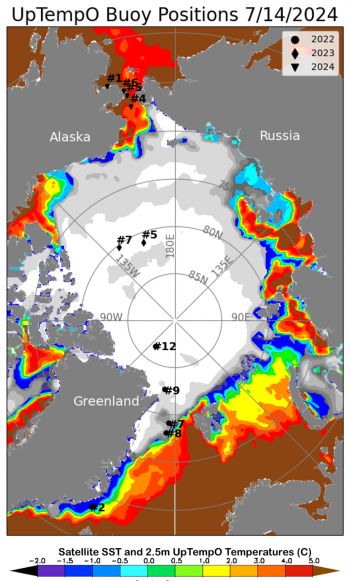
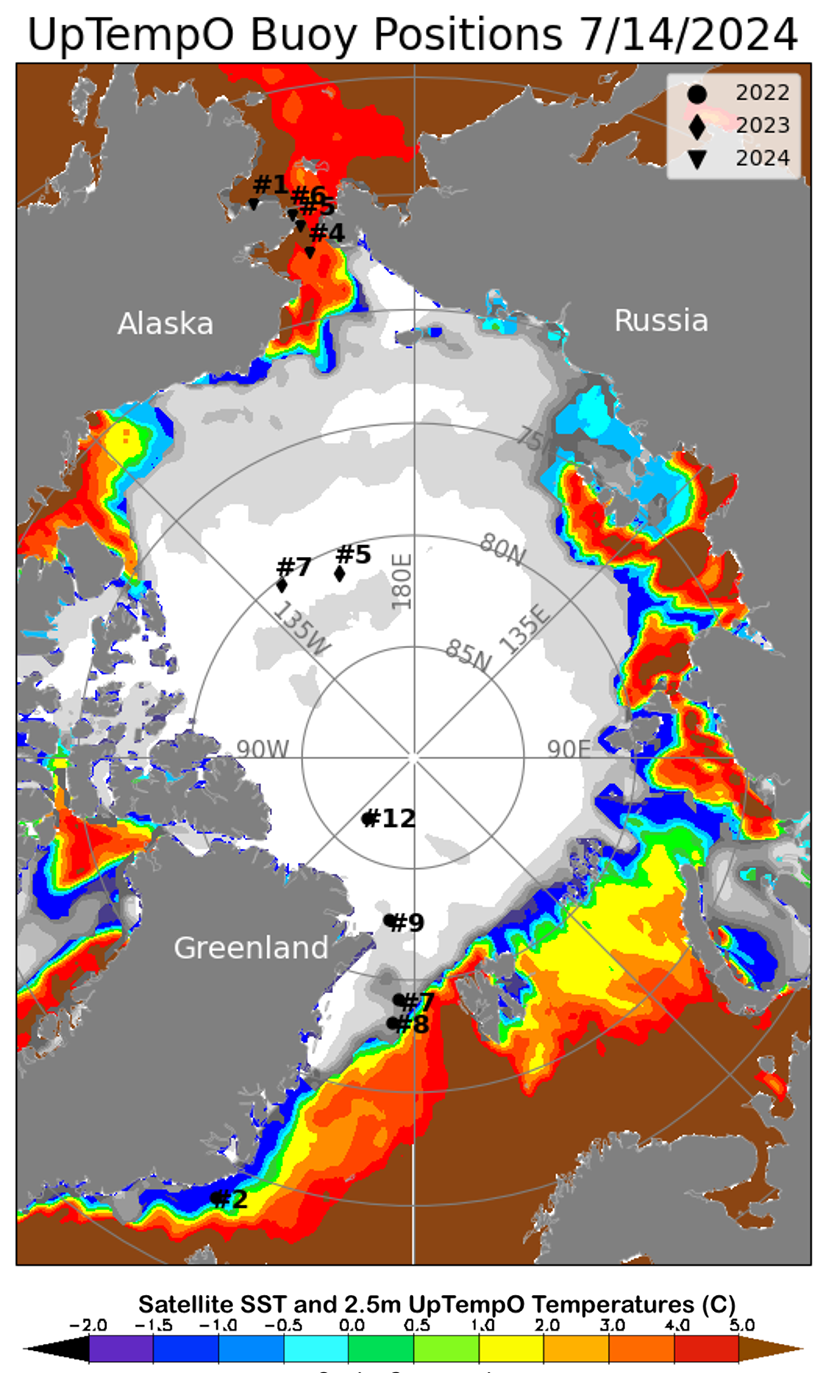
Figure 3. This map of the Arctic shows sea surface temperatures (SST) on July 14, 2024. SST data are from the National Ocean and Atmospheric Administration (NOAA). Circles indicate buoy data points with SST or sea ice concentration.
Credit: Upper layer Temperature of the Polar Oceans (UpTempO), University of Washington
High-resolution image
Colleagues at the University of Washington Polar Science Center maintain maps of sea surface temperature over the Arctic region. Fairly high sea surface temperatures of 3 to 5 degrees Celsius (37 to 41 degrees Fahrenheit) prevail along parts of the Siberian coast where the sea ice retreated earlier this season. Fairly warm waters are also creeping into the eastern Chukchi Sea.
Wrangel-ing ice into a corral
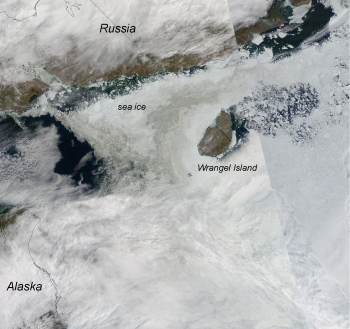
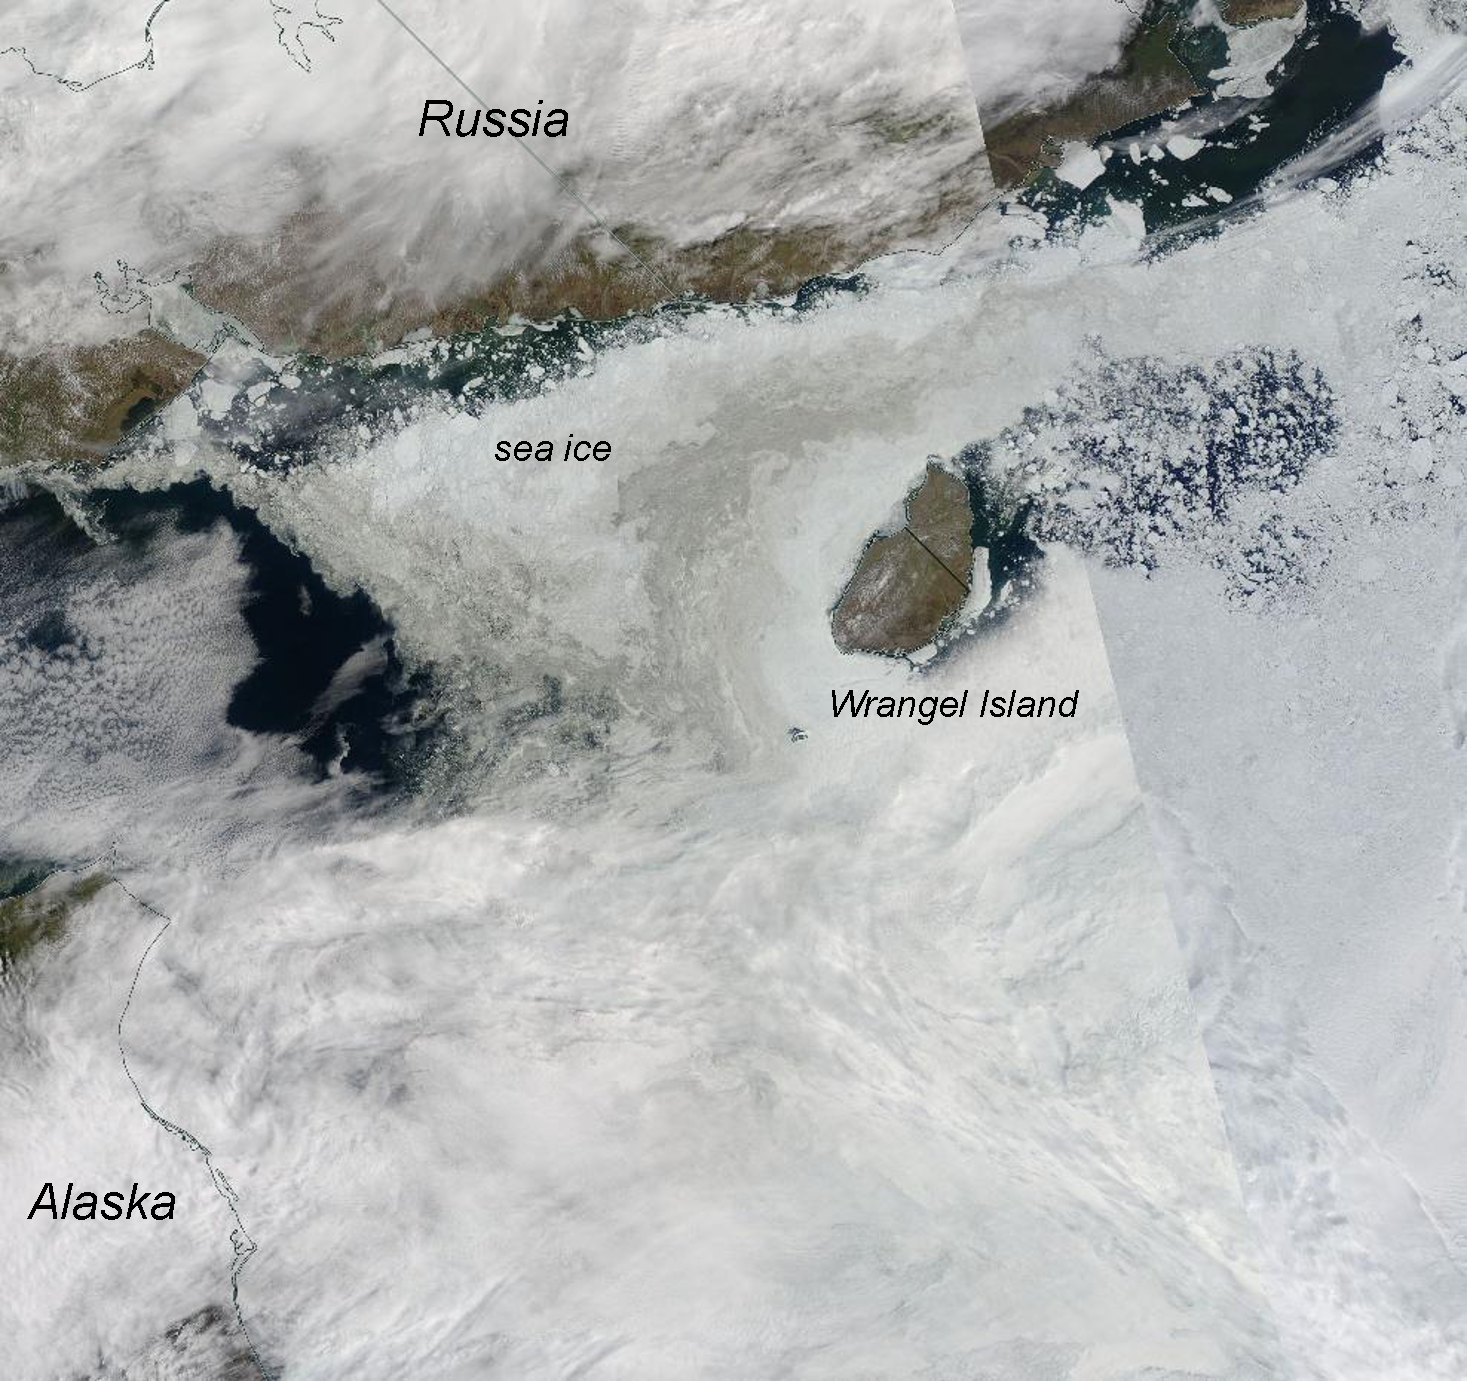
Figure 4a. This true color composite image from the NASA Moderate Resolution Imaging Spectroradiometer (MODIS) shows the compact sea ice between Wrangel Island and Russia on July 7, 2024.
Credit: NASA Worldview
High-resolution image

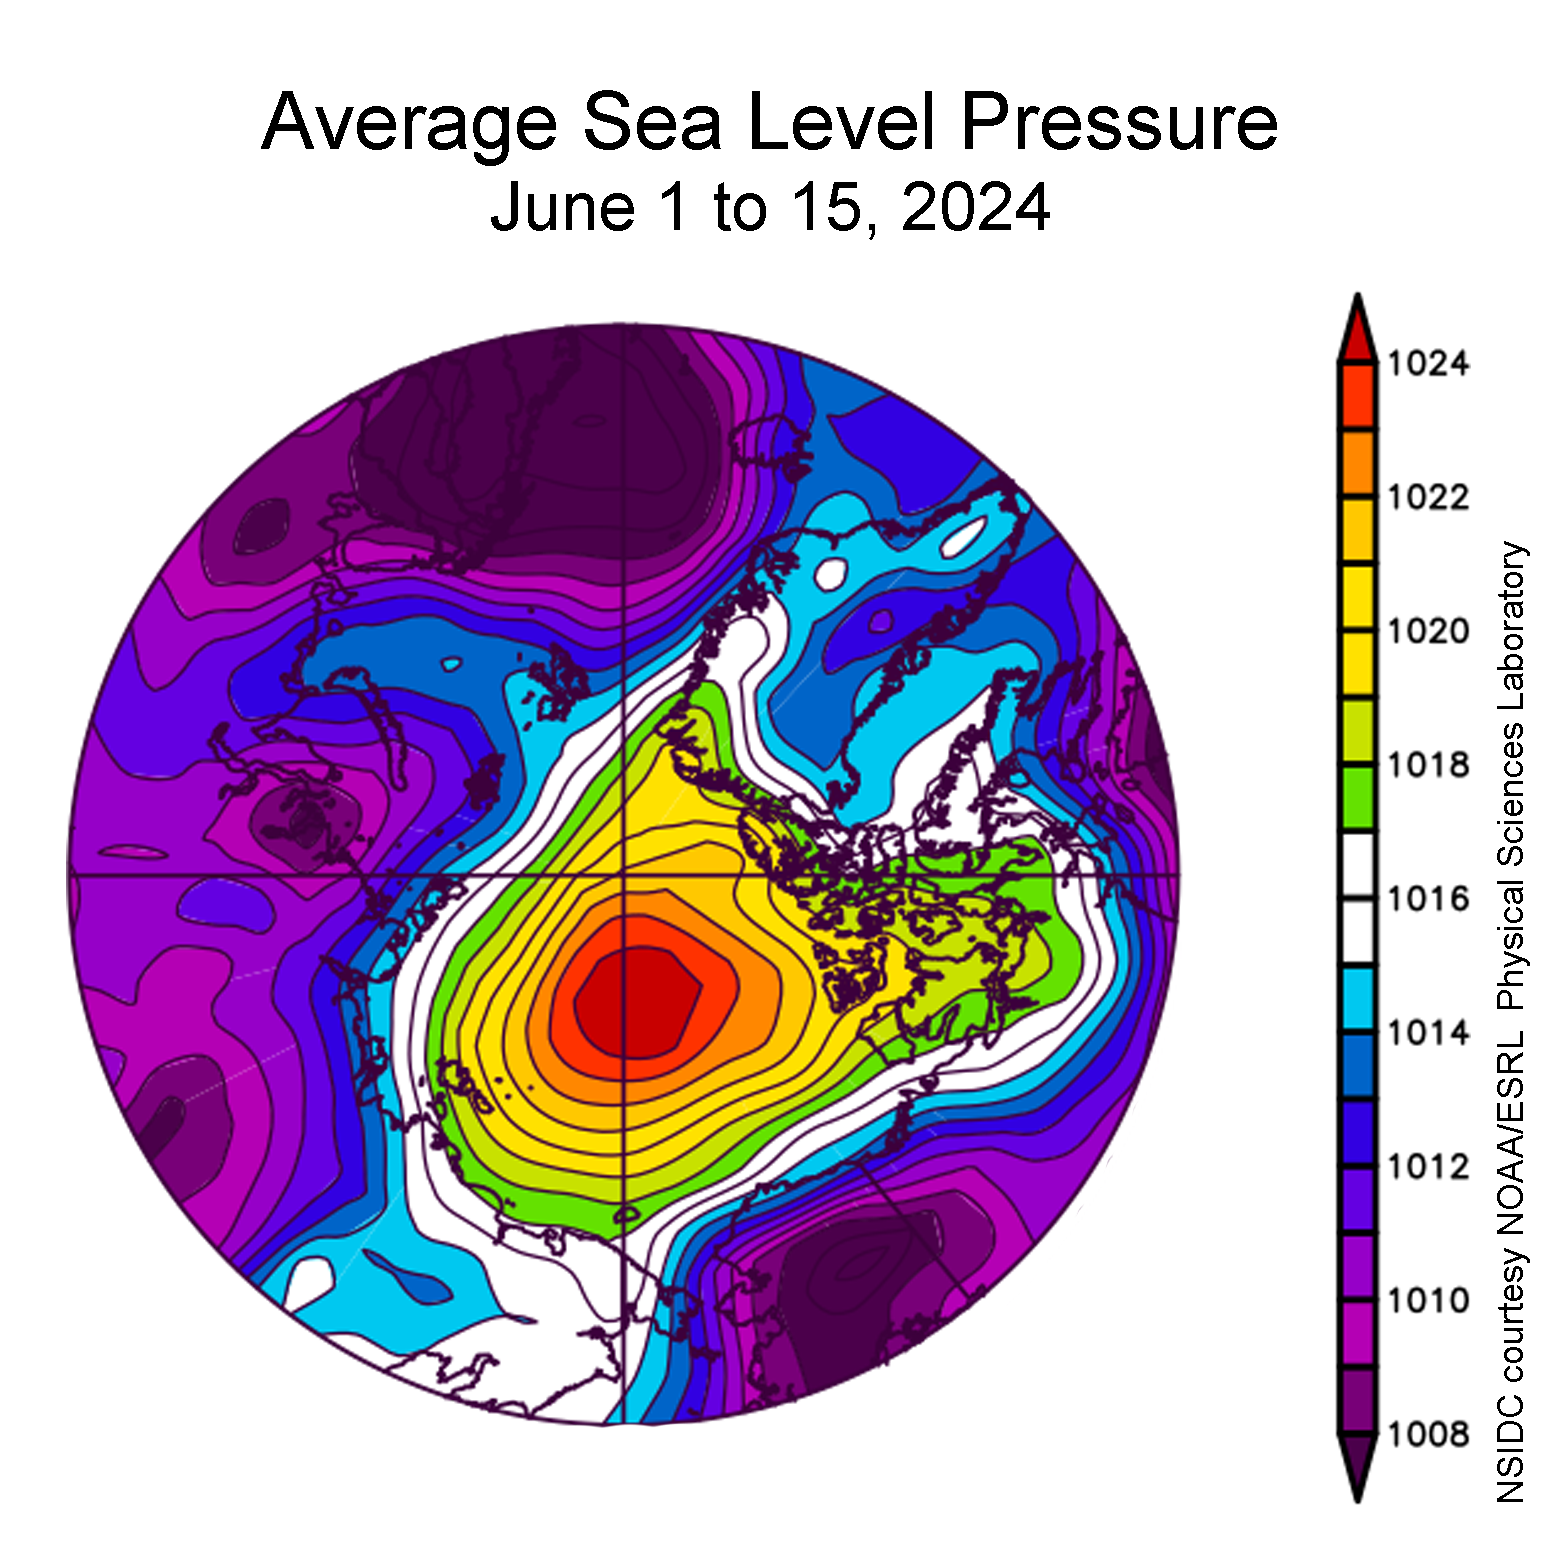
Figure 4b. This plot shows average sea level pressure in the Arctic in millibars from June 1 to 15, 2024. Yellows and reds indicate high air pressure; blues and purples indicate low pressure.
Credit: NSIDC courtesy NOAA Earth System Research Laboratory Physical Sciences Laboratory
High-resolution image
Winds from the east-southeast in spring have tightly packed sea ice between Wrangel Island and mainland Siberia. Sea ice concentrations in this wedge-shaped area in the Advanced Microwave Scanning Radiometer 2 (AMSR-2) mapping is higher than the other regions along the Siberian coast (Figure 1c). The area on the downwind side of open water can be seen both in the AMSR-2 mapping and in an image from the Moderate Resolution Imaging Spectroradiometer (MODIS) on the Terra satellite from July 7 (Figure 4a). Looking back at the sea level pressure field from earlier in the season, June 1 to June 15, points to winds that would compact sea ice into this region between the island and the mainland (Figure 4b).
Ice concentrations in this area appear to be nearly 100 percent. This sea ice also appears to be especially thick, 1.5 meters (4.9 feet) above average, as depicted in the June fields from the Pan-Arctic Ice Ocean Modeling and Assimilation System (PIOMAS).