March 2024 snow summary
- Snow covered area was 118 percent of average for March, ranking tenth in the 24-year-satellite record.
- Snow cover days are below average because of a widespread slow start to the snow season.
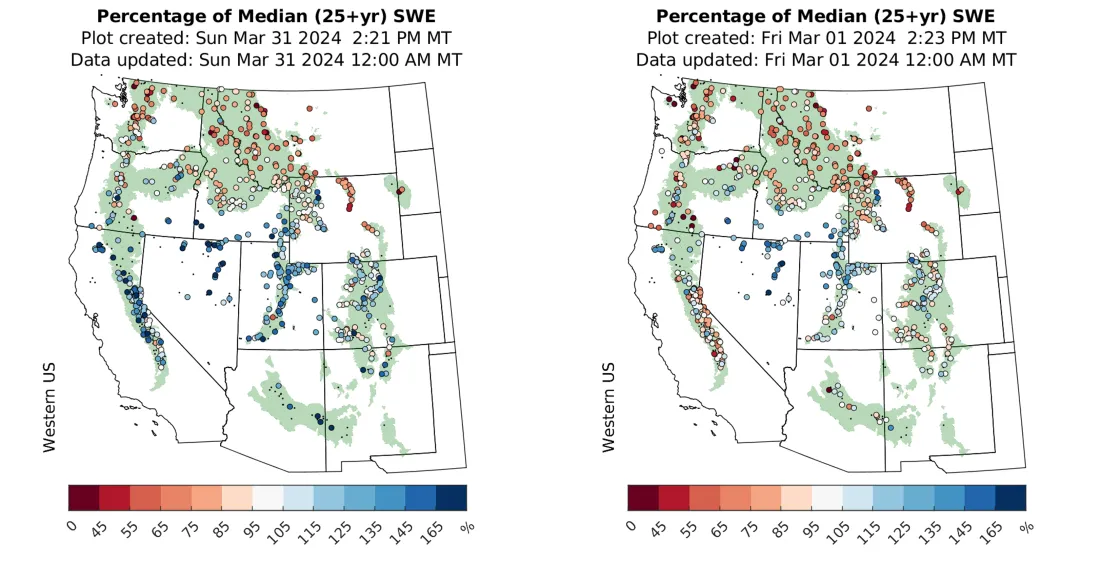
- Forty-eight percent of snow water equivalent (SWE) stations across the western United States reported average or above-average conditions at the end of March, compared to only 33 percent of stations at the beginning of the month.
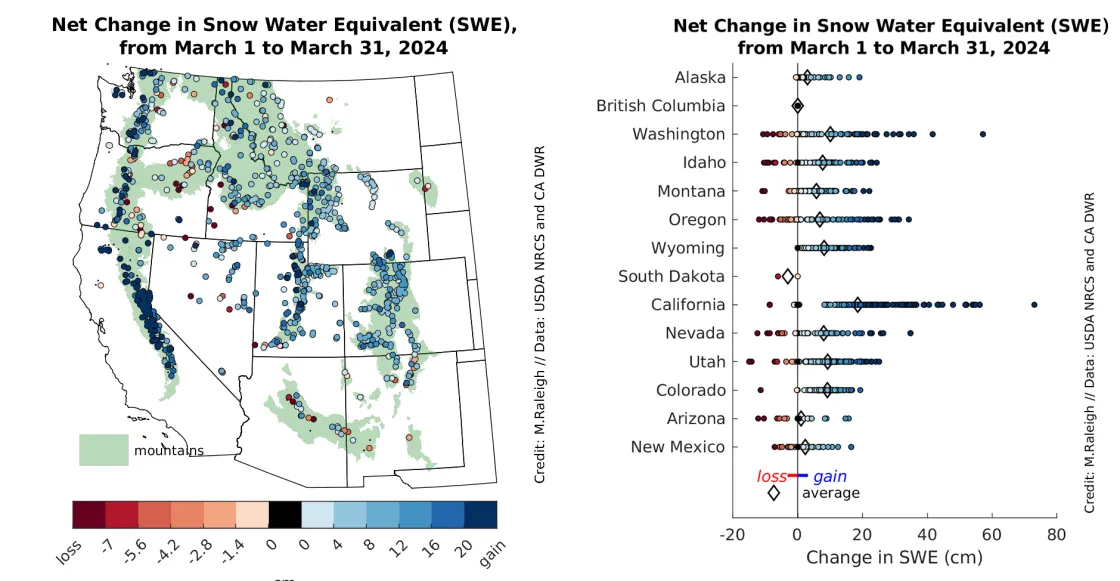
- Average SWE station gains were greater than losses for all states in our analysis area.
- SWE patterns show a distinct north to south gradient, with many northern stations reporting below-average conditions and many southern stations reporting above-average conditions.
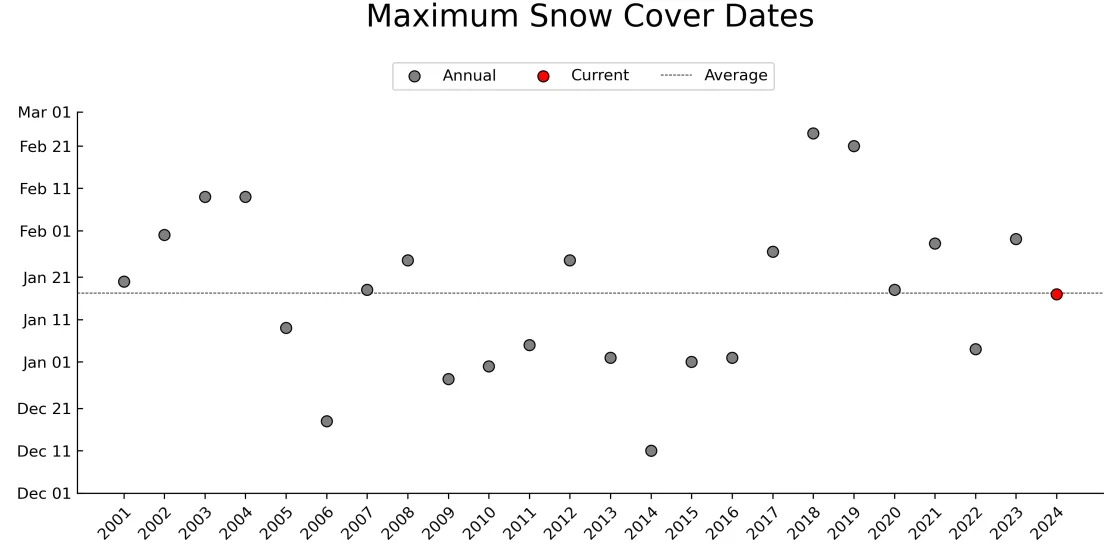
- While maximum snow-covered area occurred on January 17 for the western United States, maximum SWE is expected sometime in April for most stations.
Launching Snow Today 2024
The Snow Today team is pleased to release its updated and streamlined website with data for the 2024 water year. The interactive Daily Snow Viewer that was added last year now includes the ability to ingest a wider range of satellites and sensors. The updates also offer flexibility to display data from different sources to estimate snow surface properties like snow cover extent, snow albedo, and snow darkening from impurities like dust or soot. The Daily Snow Viewer has provided contextual analyses using the satellite record of states or Hydrological Unit Code (HUC2) basin in the western United States since 2020. The Daily Snow Viewer now provides analyses to 87 HUC4 basins, an analysis at an even smaller scale.
This year, Snow Today will continue to use daily surface reflectance data from the Moderate Resolution Imaging Spectroradiometer (MODIS) to observe Earth's surface when the atmosphere is cloud free. The team is exploring the use of surface reflectance from the Visible Infrared Imaging Radiometer Suite (VIIRS) for continuity with the MODIS snow surface properties. The National Oceanic and Atmospheric Administration (NOAA) series of VIIRS satellites will provide data continuity through nearly 2040 with a series of five different satellites.
Over the last four years, Snow Today has used data derived from the Spatially and Temporally Complete (STC) MODSCAG and MODDRFS algorithms, which may continue beyond 2024. However, data for the 2024 water year comes from the SPIREeS algorithm as the default dataset. This is the first time that the SPIReS model has been run in near real-time, so the team is continuously monitoring the data for any issues. As of the writing of this article, variables include snow cover and snow cover duration. Snow albedo and snow radiative forcing variables may be added later to the Daily Snow Viewer, as well as additional regions.
Overview of conditions
Snow-covered area in March 2024 across the western United States was 18 percent above average (Table 1). March 2024 snow-covered area was considerably less than the record-setting season last year. This year’s 608,000 square kilometers (235,000 square miles)—equivalent to the size of Texas—ranks as the tenth highest March assessed over the 24-year-satellite record. There is nearly 2.5 times more snow cover than 2015, the lowest year on record.
Table 1. March 2024 Snow Cover in the Western United States (relative to the 24-year-satellite record, using the SPIReS model)
Snow-Covered Area | Square Kilometers | Square Miles | Rank |
|---|---|---|---|
March 2024 | 608,000 | 235,000 | 10 |
2001 to 2023, Average | 515,000 | 199,000 | -- |
2023, Highest | 1,144,000 | 442,000 | 1 |
2015, Lowest | 248,000 | 96,000 | 24 |
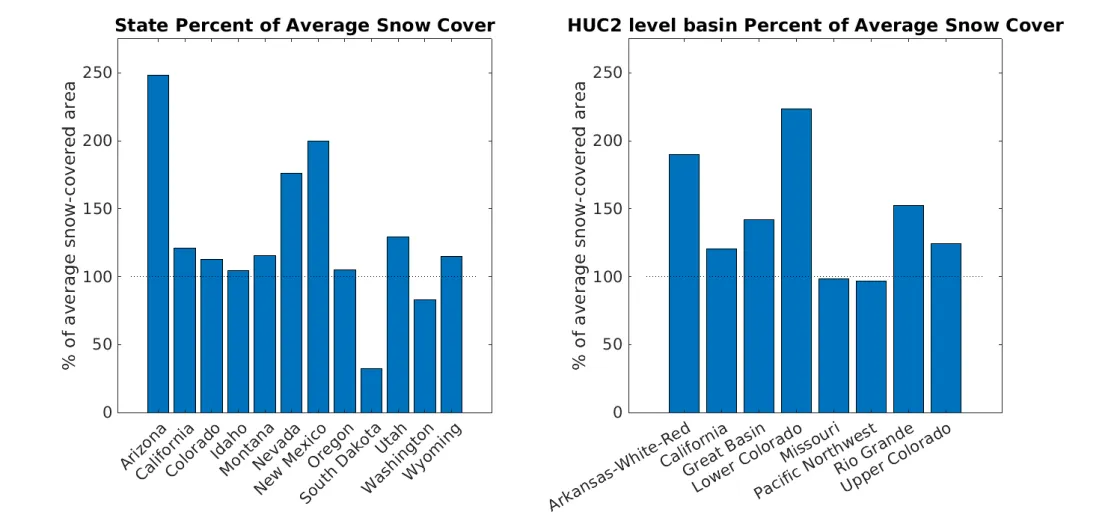
Above average snow-covered area was measured in most states and large river basins during March 2024 (Figure 1). Southern states and basins with the highest relative snow cover included Arizona at 255 percent of average. New Mexico was 202 percent of average snow cover. The Lower Colorado River basin had 230 percent and the Arkansas-White-Red River basin had 193 percent of average snow cover. Meanwhile, drier conditions persisted in some regions of the Northern Great Plains, with snow cover in South Dakota only 37 percent of average. Washington was the only other state where below-average snow cover was detected at 87 percent of average, but snow cover in the larger Pacific Northwest basin was average.
Conditions in context: Snow cover
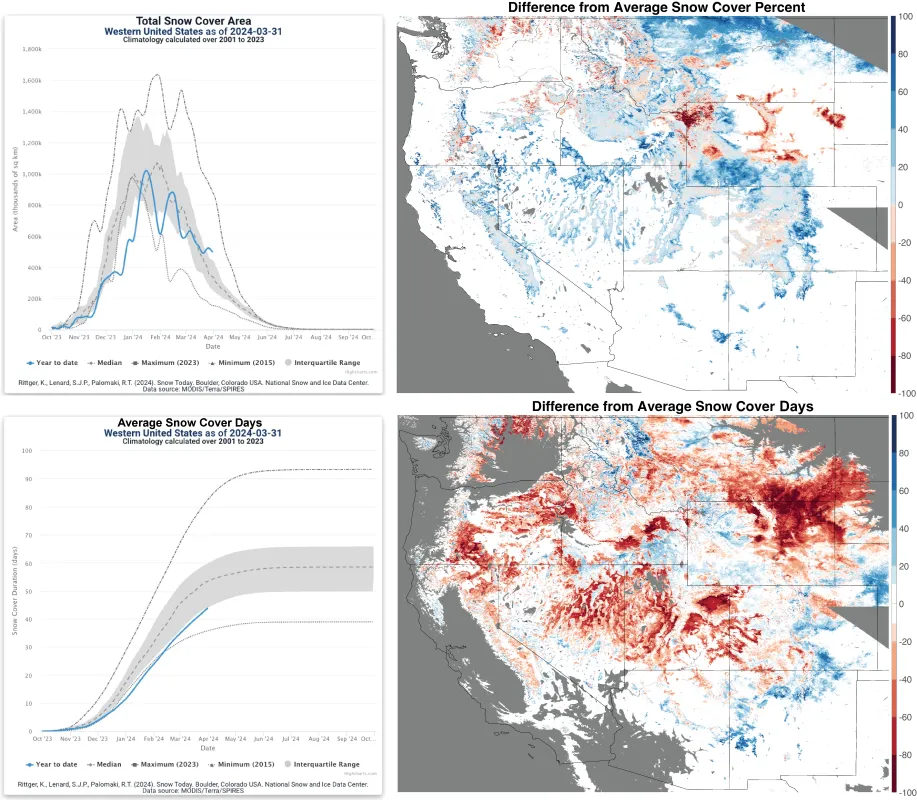
After reaching the maximum snow-covered area for the year, snow cover plummeted to its minimum in the 24-year-satellite record on February 1 (Figure 2, upper left). Storms raised snow cover to above average in February, followed by another rapid melt. However, a few isolated and small storms in late February extended snow cover to average through early March. In late March, winter storms drove the snow-covered area to above average through the end of the month.
Many regions across the western United States had above average snow-cover in March 2024. Notable states include California, Nevada, Arizona, New Mexico, and Utah. Below average snow cover occurred in the Yellowstone region across Idaho, Montana, and Wyoming. Other below average locations included northeast Wyoming's Bighorn Range, the Granite Mountains, and the Black Hills extending into South Dakota (Figure 2, upper right). Smaller pockets of below- and above-average snow cover occurred in Colorado, Washington, Oregon, and northern Idaho.
This year's late start to snowfall resulted in the number of snow cover days from October 1 to March 31 averaged over the western United States to fall below the twenty-fifth percentile (Figure 2, lower left).
Differences from average snow cover days in March of 2024 were largely negative with vast regions of Wyoming, Montana, South Dakota, Utah, eastern Nevada, California, and Oregon showing 100 fewer snow cover days than the 24-year average (Figure 2, lower right). These large deficits are the result of the late start to the snow season, which impacted much of the western United States. However, pockets of above-average snow cover lingered in western Montana, in Colorado near Colorado Springs and the Front range, Nebraska, and widely across New Mexico. In contrast to the regions with low snow cover duration, snow cover in these areas has increased at an average pace indicating the presence of typical storm patterns early in the season.
Conditions in context: Snow water equivalent (SWE)
At the beginning of March 2024, only 33 percent of stations across the western United States reported above-average snow water equivalent (SWE). Relatively high levels of SWE were generally concentrated in the Great Basin region in Nevada, the Wasatch and Uinta ranges in Utah, and some areas in the Colorado Rockies. By the end of the month, 48 percent of stations across the region reported above-average SWE. Significant SWE gains were recorded across the Sierra Nevada range in California, where 38 stations (33 percent of all California stations) moved from below-average to above-average SWE between March 1 and 31. An atmospheric river bolstered the Sierra snowpack considerably at the beginning of the month, which brought up to 10 feet of snow to some areas. These storms also brought moisture directly inland reaching Nevada, Utah, and Colorado.
Although northern states were less affected by big March storms, there was generally more SWE gain than loss in Washington, Oregon, Idaho, Montana, and Wyoming. Here, only 21 percent of stations reported above-average conditions at the beginning of the month, compared to 32 percent of stations by the end of the month. As of March 31, 231 stations across these five states report below-average SWE, with 91 stations reporting less than 70 percent of average SWE. Some mountain ranges, including the Sawtooths and Pioneers in Idaho, reported near-average SWE while others, including the Washington Cascades and most ranges across western Montana, were much drier than average for this time.
Although many locations in the northern part of the study domain reported below-average SWE at the end of the month, most stations across the western United States recorded SWE increased between March 1 and 31 (Figure 4). Particularly notable was the 73 centimeters (29 inches) of SWE gain at the Lower Lassen Peak station in the northern Sierra Nevada range. With an assumed snow density of 100 kilograms per cubic meter, this represents over 20 feet of snowfall in March. SWE losses were recorded at only a few stations, including several low elevation stations within New Mexico, Arizona, and southern Utah, and in Oregon’s Blue Mountains.
Timing of maximum snow-covered area and SWE
Snow-covered area across the western United States reached a maximum on January 17, 2024, spot on with the average over the data record (Figure 5). This date of maximum was 13 days earlier than the date of the record breaking maximum last year, 2023. The last time snow cover reached a maximum near January 17 was in 2020, the fifteenth driest year in the snow cover record. While an early maximum can indicate a relatively dry snow year, ultimately snow volume depends on storms that occur between the snow cover maximum and the typical SWE maximum.
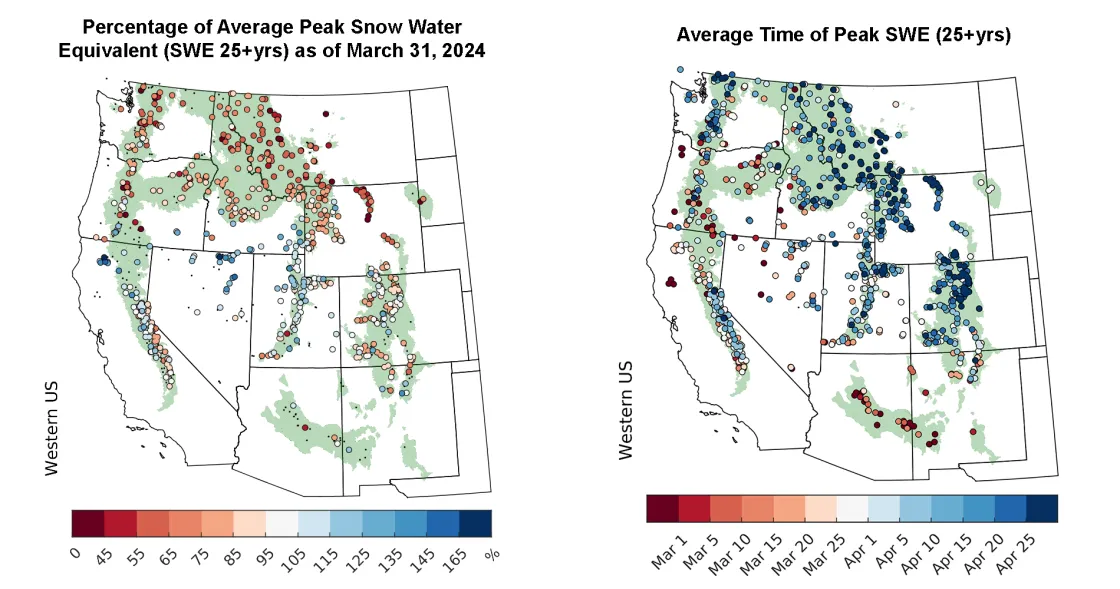
Many SWE stations in the northern tier of states reported below-average snowpacks at the end of March (Figure 3). At this time of year, hydrologists and water managers begin to generate their first water supply forecasts for the upcoming summer, using April 1 SWE values as an estimate of the total water available in the snowpack. However, peak SWE can vary considerably from April 1 across different parts of the western United States. The historical average peak SWE and its timing (Figure 6) provides additional context for current SWE conditions shown in Figure 3. Although many northern stations reported below average SWE on March 31 (Figure 6, left), most of these stations historically reach peak SWE after April 1 (Figure 6, right). In some regions like western Montana and Wyoming, peak SWE typically occurs at the end of April or later. Hence, these stations may continue to accumulate SWE; the number and intensity of storms in April will be the determining factor. By contrast, stations in some regions like the Uinta and northern Wasatch ranges in Utah reported March 31 SWE already above the average peak SWE value. This is good news for local water supplies in these regions.
