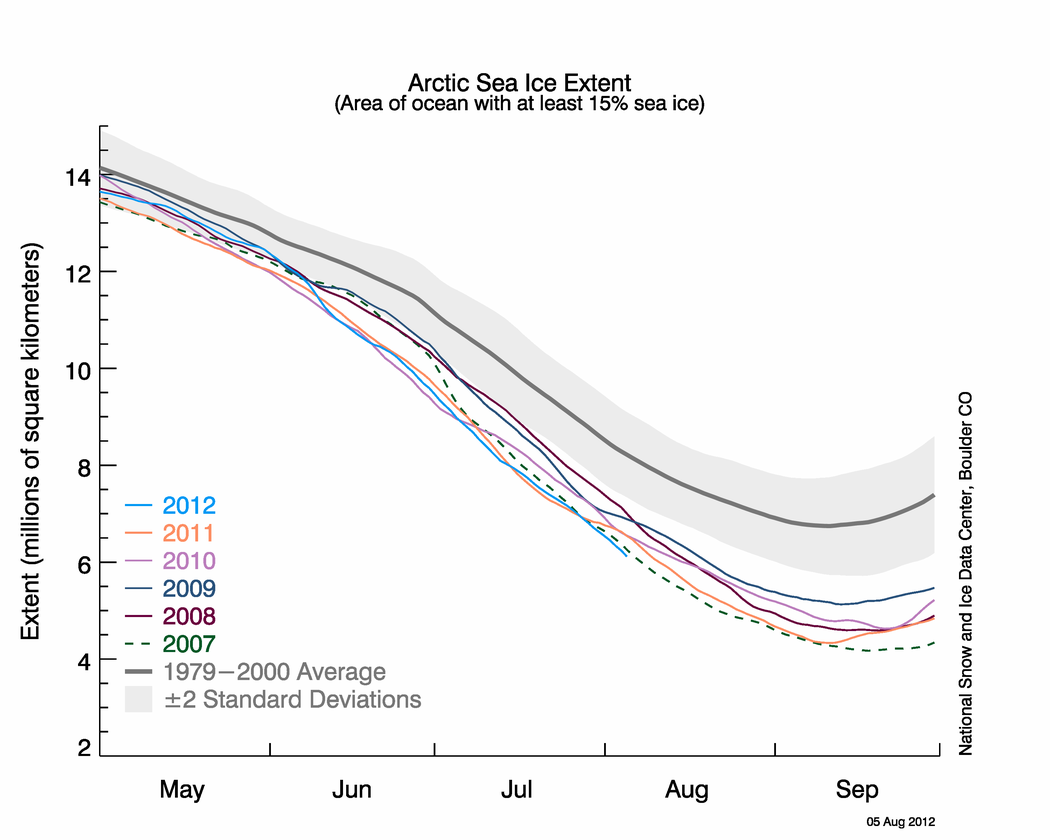
Figure 2. The graph above shows Arctic sea ice extent as of August 2, 2012, along with daily ice extent data for the 2011 and for 2007, the record low year. 2012 is shown in blue, 2011 in orange, and 2007 in green. The gray area around the average line shows the two standard deviation range of the data. {a href=http://nsidc.org/data/seaice_index}Sea Ice Index{/a} data.||Credit: National Snow and Ice Data Center|{a href=http://nsidc.org/arcticseaicenews/?attachment_id=2105}High-resolution image{/a}|

