By Laura Naranjo
In 1999, NASA launched one of its Earth-observing workhorses, the Moderate Resolution Imaging Spectroradiometer (MODIS) instrument, aboard the Terra satellite. A second MODIS instrument followed in 2002 on the NASA Aqua satellite. Together, the two MODIS instruments revealed stunning vistas of the planet, imaging Earth’s entire surface anew every one to two days. MODIS data gave researchers insight into everything from aerosols in the atmosphere to zooplankton in the seas.
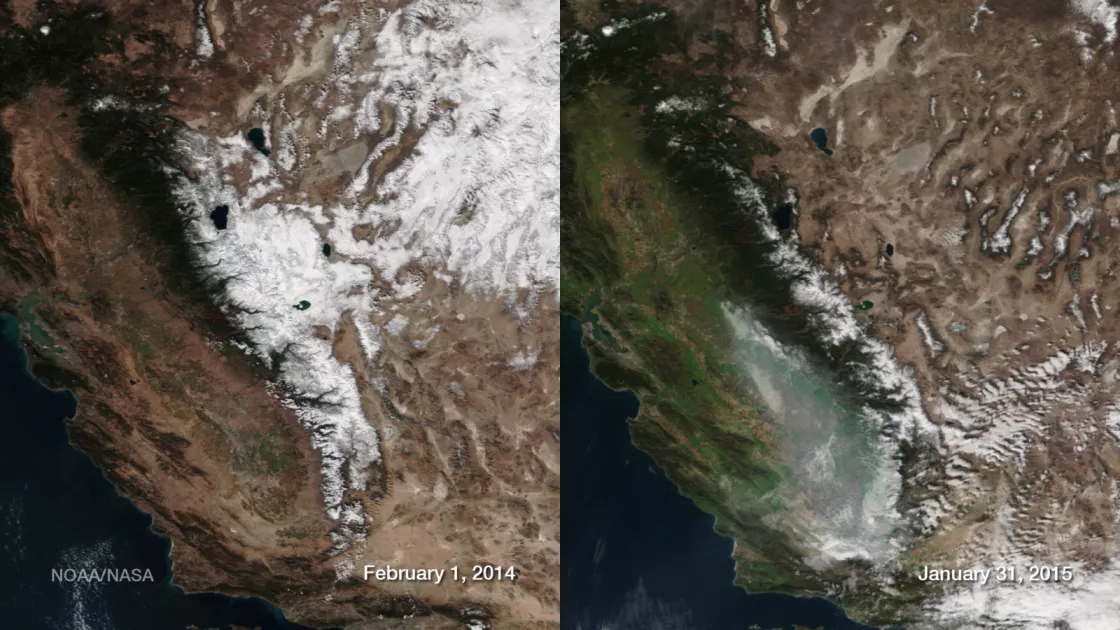
The new instruments proved a boon for cryospheric sciences as well, and the NSIDC Distributed Active Archive Center (DAAC) currently distributes twenty MODIS data sets that track snow cover and sea ice extent, which builds on a variety of cryospheric satellite records in NSIDC DAAC holdings that date back to 1978. Researchers now use MODIS data to map snow cover, track glaciers, and monitor calving icebergs—often in near-real time.
Introducing VIIRS
Although the designed life span for each MODIS instrument was six years, both continue to beam down data and are expected to last beyond 2020. Still, to guarantee a continuing time series, NASA joined with the National Oceanic and Atmospheric Administration (NOAA) to deliver data from the Suomi National Polar-orbiting Partnership (NPP) spacecraft. Launched in 2011, NPP carries the replacement for MODIS: the Visible Infrared Imaging Radiometer Suite (VIIRS).
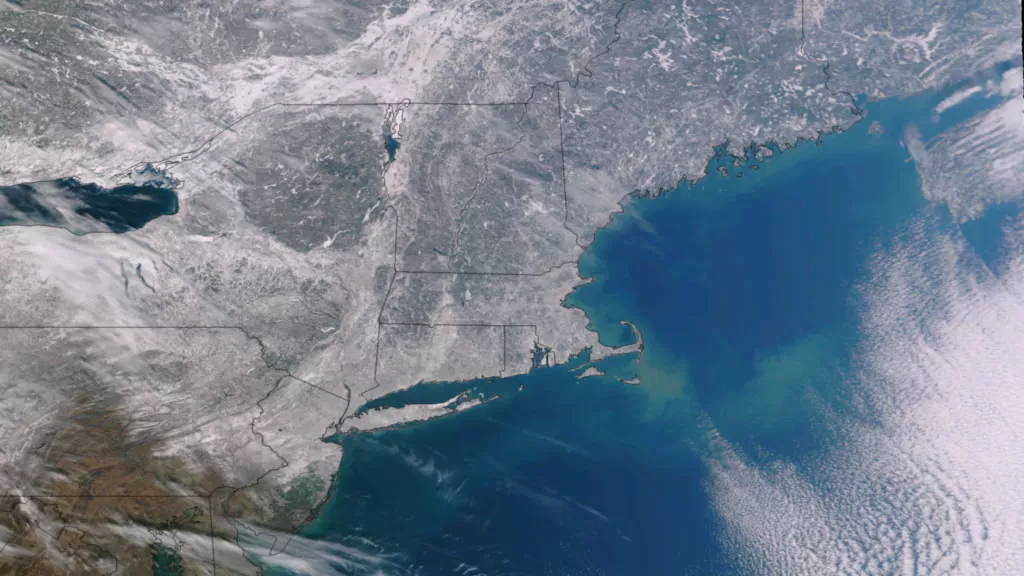
VIIRS observes the same phenomena that MODIS tracks, acquiring visible and infrared imagery and radiometric measurements of Earth’s atmosphere, land, and oceans. VIIRS not only lengthens the MODIS time series, it improves resolution. The VIIRS mission observes sea ice at 750 meter resolution, compared with 1 kilometer for MODIS, and observes snow cover at 375 meters, compared with 500 meters for MODIS. NSIDC currently distributes two cryospheric VIIRS products alongside the MODIS products. As more VIIRS data are validated and processed, the NSIDC DAAC will archive and distribute a range of VIIRS products that echo the current strategy applied to MODIS.
Extending the mission
To ensure continuity, VIIRS snow cover and sea ice algorithms are compatible with the most recently processed MODIS data, Collection 6. VIIRS product names also replicate MODIS data set names. For instance, MODIS gridded snow cover data from the instruments on Terra and Aqua are labeled MOD10A1 and MYD10A1, respectively; the snow cover product from VIIRS on Suomi NPP will be labeled VNP10A1. Using the same algorithms facilitates an uninterrupted climate data record that builds on the MODIS time series, and duplicating product and file naming conventions simplifies the transition for researchers using data from both MODIS and VIIRS missions.
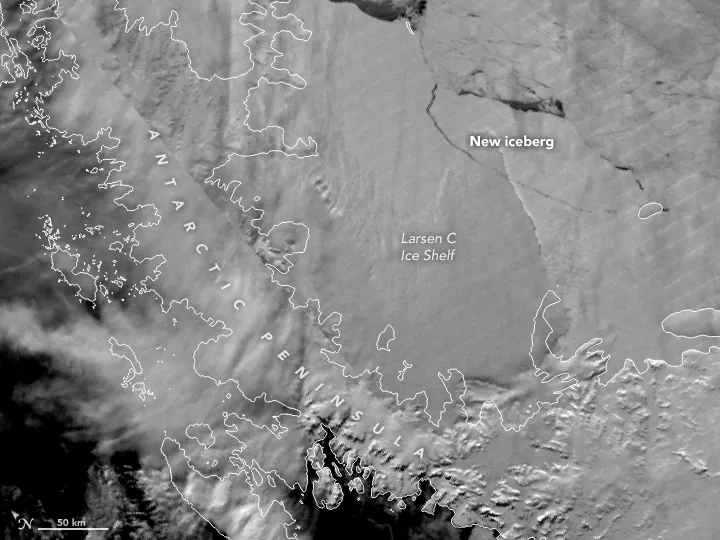
Developing a longer record allow researchers to track change, particularly in Earth’s cryosphere. Components of the cryosphere exist at all of Earth’s latitudes, ranging from tropical glaciers to icy polar reaches, and millions of people are affected by what happens to snow cover, sea ice, ice sheets, and glaciers. Because the cryosphere is one of the leading indicators of climate change, the global coverage and cost-free availability of both MODIS and VIIRS data are invaluable for the research community. In fact, MODIS offered researchers an unprecedented glimpse into how quickly change can occur, capturing stunning images of Antarctica’s Larsen B Ice Shelf as it shattered apart in 2002. More recently, MODIS and VIIRS images helped researchers spot the massive Antarctic iceberg A-68 breaking off of the Larsen C Ice Shelf.
The missions provide more detail than ever about Earth and help expand our scientific understanding of various snow and ice processes. The NSIDC DAAC will continue to archive and distribute cryospheric MODIS and VIIRS products throughout the life span of the missions, ensuring availability to the research community and the public.
For more information
VIIRS Data at the NSIDC Distributed Active Archive Center (DAAC)
MODIS Data at the NSIDC Distributed Active Archive Center (DAAC)
References
Key, J. R., R. Mahoney, Y. Liu, P. Romanov, M. Tschudi, I. Appel, J. Maslanik, D. Baldwin, X. Wang, and P. Meade. 2013. Snow and ice products from Suomi NPP VIIRS. Journal of Geophysical Research: Atmospheres 118: 12,816-12,830. doi:10.1002/2013JD020459.
Riggs, G. A., D. K. Hall, and M. O. Román. 2017. Overview of NASA’s MODIS and VIIRS snow-cover Earth System Data Records. Earth System Science Data Discussions. doi:10.5194/essd-2017-25.


