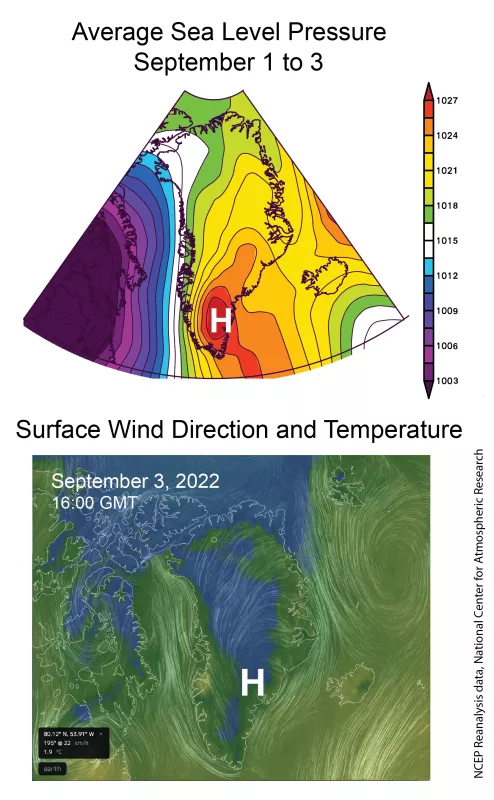
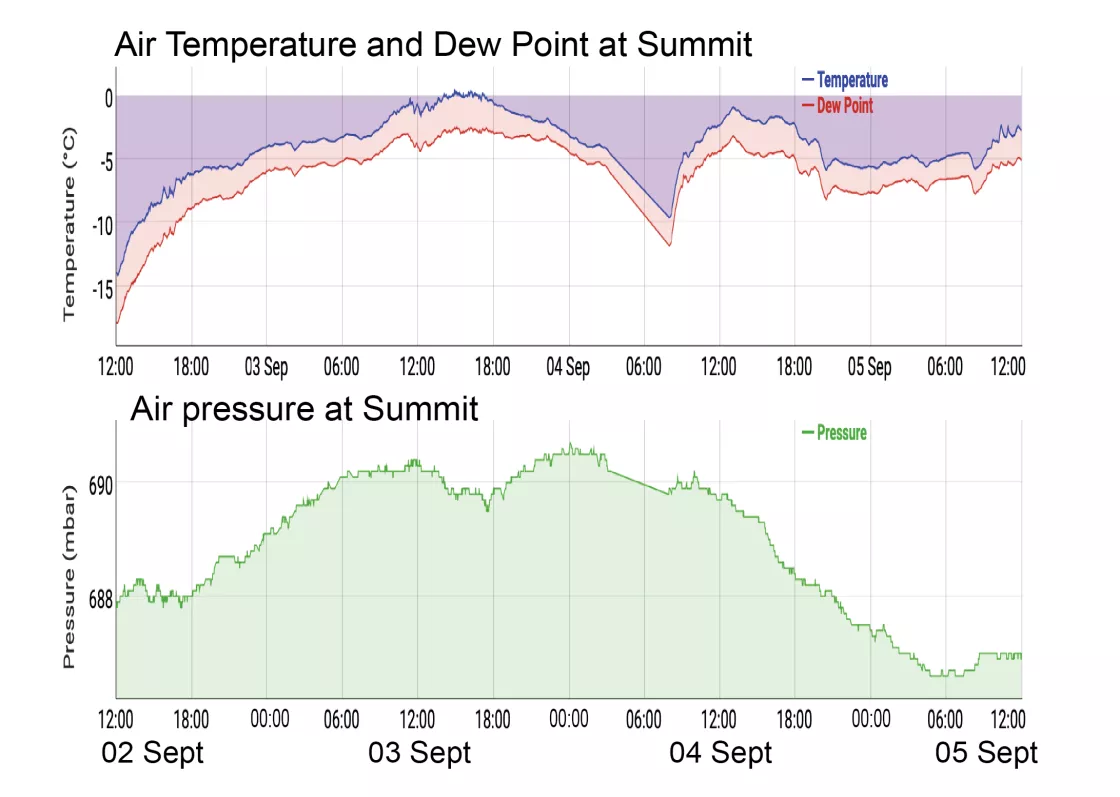
As most of the western United States baked under a prolonged, record-setting heatwave at the beginning of September, Greenland also underwent a very unusual late-season melt event. Summit Station in Greenland, at an elevation of more than 3,200 meters (10,500 feet), surpassed the melting point for the first time on record in September on the afternoon of September 3. A strong high air pressure region parked at the southeastern edge of Greenland and drew warmer air northward along the western coast of Greenland and Baffin Bay beginning on September 2, leading to the melt event.
Overview of conditions
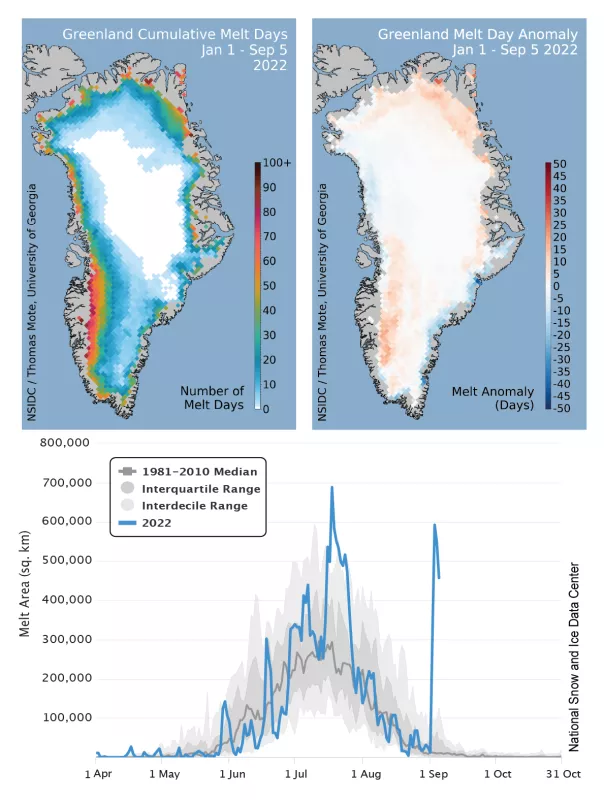
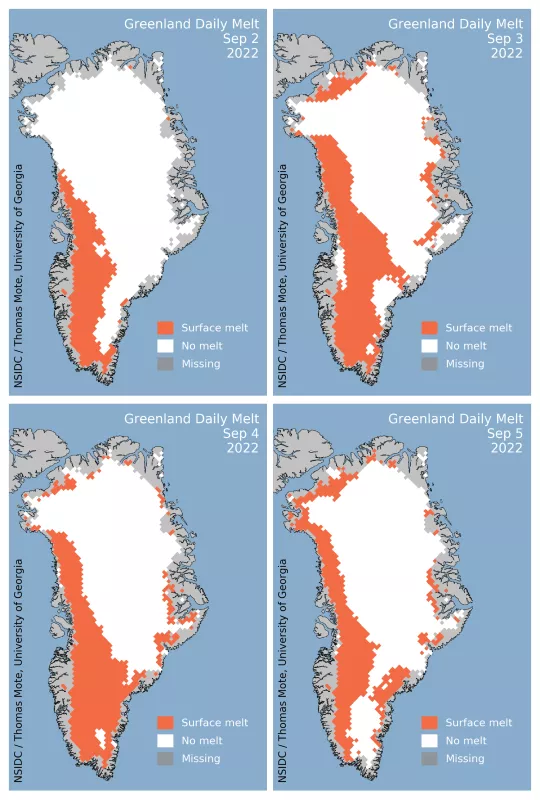
Unprecedented in the 44 years of continuous satellite monitoring, a late season heat wave and melt event occurred in Greenland from September 2 to 5. At the peak on September 3, more than one-third (36 percent) of the ice sheet, or around 600,000 square kilometers (232,000 square miles) had surface melting (Figure 1a). The only comparable event so late in the season was in 2003, in late August (in terms of melt area) when temperatures at Summit reached only -2.5 degrees Celsius (27.5 degrees Fahrenheit). The melt event began along the southwestern coast on September 2, and moved rapidly inland and northward on September 3, accompanied by heavy rainfall that enhanced melt at lower elevations, and enhanced snowfall at higher elevations (Figure 1b). To date this year, Greenland has had a near-average melt year overall, with the total melt-day area ranking twentieth in the 44-year record (Figure 1a). Melting is slightly above average in both northeastern and south-central Greenland, and slightly below average along the southeast coast and northwest.
Conditions in context
Warm air moved rapidly northward from the central North Atlantic Ocean. A strong and relatively slow-moving high-pressure region and an atmospheric river—a relatively narrow band of high-moisture air—brought a considerable volume of snow and rain in the early days of the event (Figure 2a). This pulse of warm air then flowed eastward over the top of the ice sheet and descended onto the eastern edge, extending melting to the northern and eastern coast on September 4 and 5. Temperatures at Summit Station were low in the early morning hours of September 2, but rose rapidly during that day. Increasing air pressure, which often accompanies melt events at Summit, began on September 3 and continued high through much of September 4. On September 3, several hours of above-freezing temperatures were recorded, reaching a peak of 0.4 degrees Celsius (32.7 degrees Fahrenheit) around 15:00 Greenwich Mean Time (GMT) on the third (Figure 2b). High temperatures on September 4 were slightly above -2 degrees Celsius (28.4 degrees Fahrenheit) and similarly warm conditions continued across the island until September 6.
The big runoff
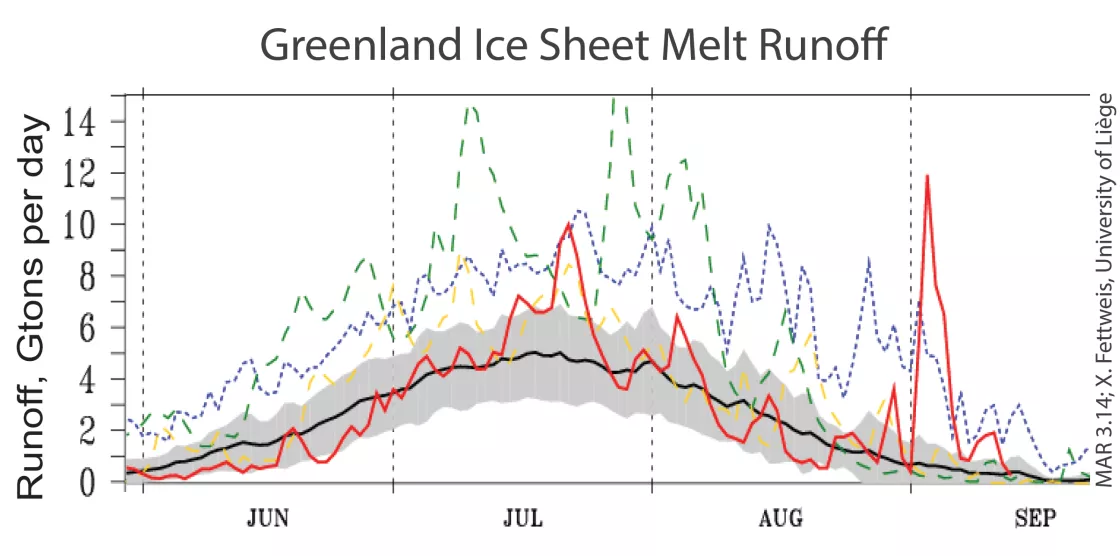
Meltwater runoff, or the amount of surface water entering the ocean, from the Greenland Ice Sheet began increasing on September 2 at 5.6 billion tons per day, and peaked at just under 12 billion tons per day on the September 3. Data are from the Regional Atmosphere Model (MAR), which is a reanalysis model that uses Global Forecast System data from the National Centers for Environmental Prediction (NCEP). On September 4 and 5, runoff continued at 7.7 and 6.6 billion tons, respectively. The runoff total for September 3 was the highest of this melting season and is one of the 10 highest runoff days since 1950. However, this was moderated partially by heavy rainfall and snowfall on September 2 and 3, totaling 15.6 billion tons of input. Such an intense melt and runoff event at this time of the year is exceptional as the energy coming from solar radiation is already very low at the beginning of September. Most of the record high runoff events have occurred in July, such as in 2012 and 2019. This event has been followed by colder conditions, which caused refreezing of the melt at the top of the snowpack. This will lead to widespread formation of ice lenses within the snowpack. These shallow and impermeable ice lenses will reduce the capacity of the snowpack to retain meltwater next summer, tending instead to promote more widespread runoff and less local refreezing (MacFerrin et al., 2021).
Being there
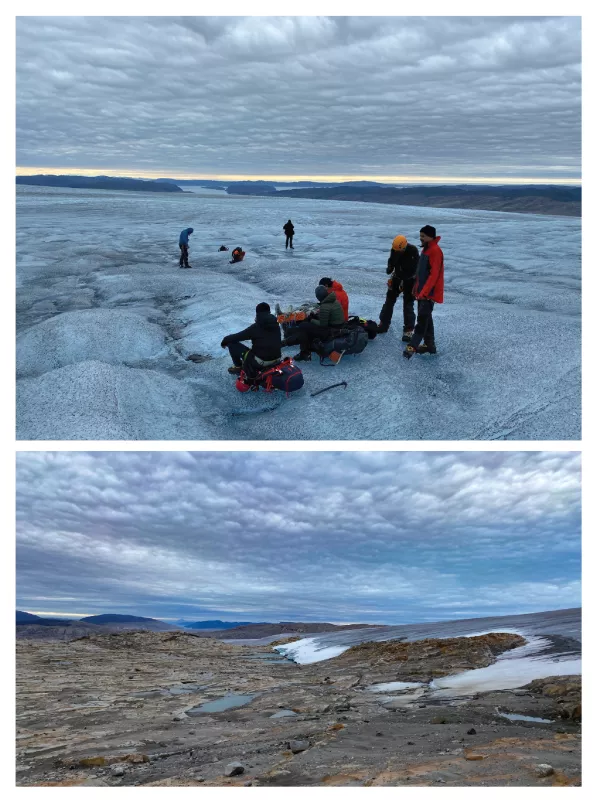
A group of researchers camped near the ice edge in southern Greenland when the melt event began on September 2. The group observed intermittent rain, warm winds, and unusual wave-like clouds indicative of unstable conditions.
References
MacFerrin, M., H. Machguth, D. v. As et al. 2019. Rapid expansion of Greenland’s low-permeability ice slabs. Nature 573, 403–407. doi:10.1038/s41586-019-1550-3
