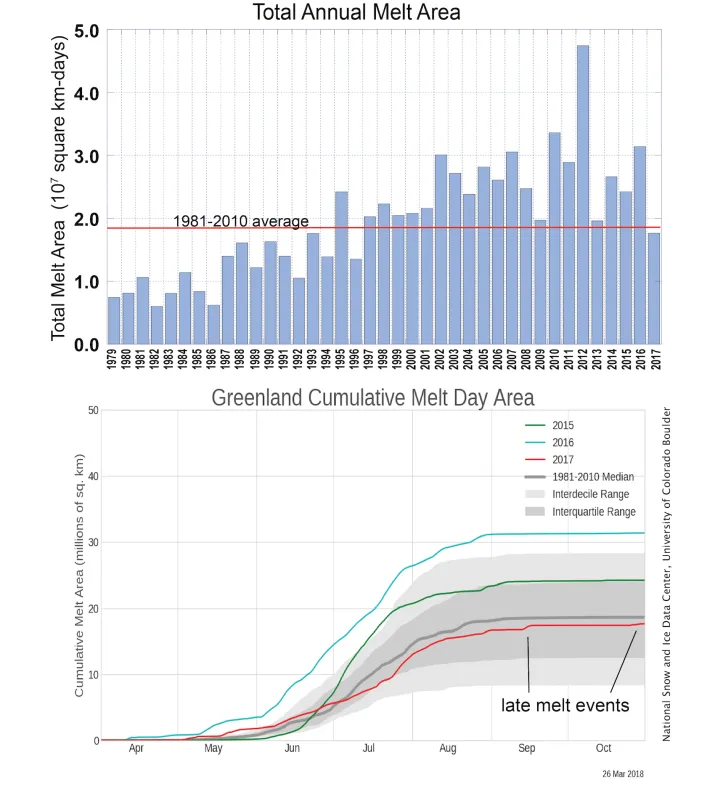
In 2017, the cumulative daily melt area for the Greenland Ice Sheet was the smallest since 1996, yet still higher than any year between 1979 and 1994 (1995 was a high melt season). The 2017 melt season was also notable for its late melt events, one of them occurring on October 29 to 31, tied for the latest for any year in the satellite record. We have re-started daily monitoring for 2018 and will be providing periodic discussions as conditions warrant. Early melting in 2018 has been confined to a few points along the eastern coast.
Overview of conditions
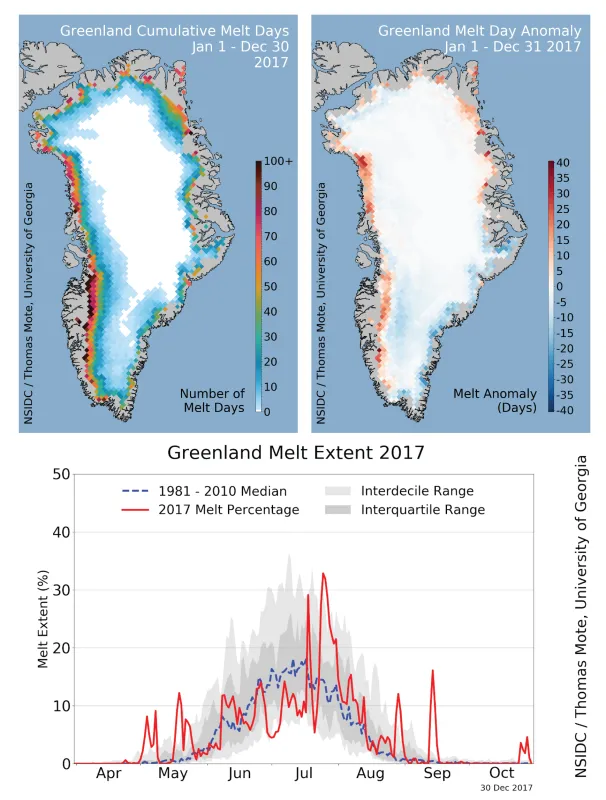
The 2017 melt season was less intense than recent years, and was below average melt in the 1981 to 2010 reference period. Surface melting was particularly low in southeastern Greenland. In general, melting was limited to low elevations (below 1500 meters or 4900 feet) along the western and northeastern coastlines. Fewer melt days than average occurred along the Davis Strait and the interior melt pond region along the central western coast. As discussed below, the melt year ended with two significant late melt events in southeastern Greenland. The final 2017 melt event occurred at the end of October, covering the southeastern coast. Overall, the 2017 melt season was the lowest since 1996. Although it began and ended with a few large melt events, the middle of the melt season through mid-July was below average—only briefly picking up intensity late in July through mid-August.
Conditions in context
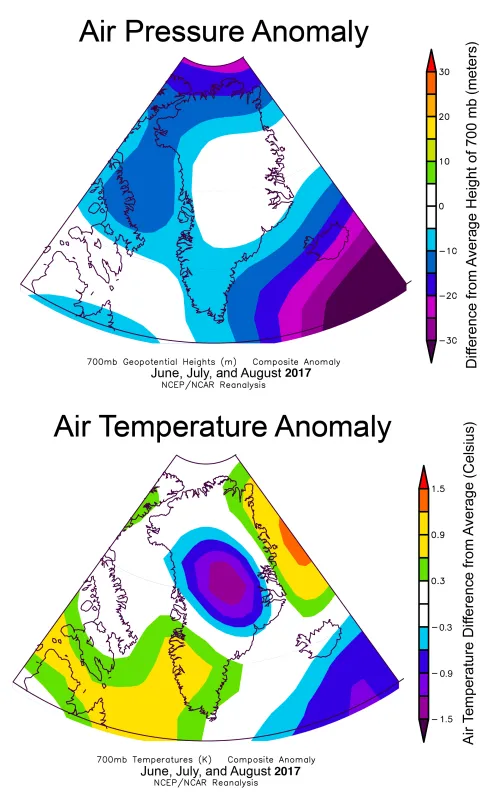
Lower-than average atmospheric pressure southeast and north of Greenland was present during the height of the summer melt season. Near the summit in central Greenland, the average air temperature for the summer melt season was more than 1 degree Celsius below the 1981 to 2010 average. Temperatures were about 1 degree Celsius (2 degrees Fahrenheit) above average along the southwestern tip and northeastern coastline.
The late late show
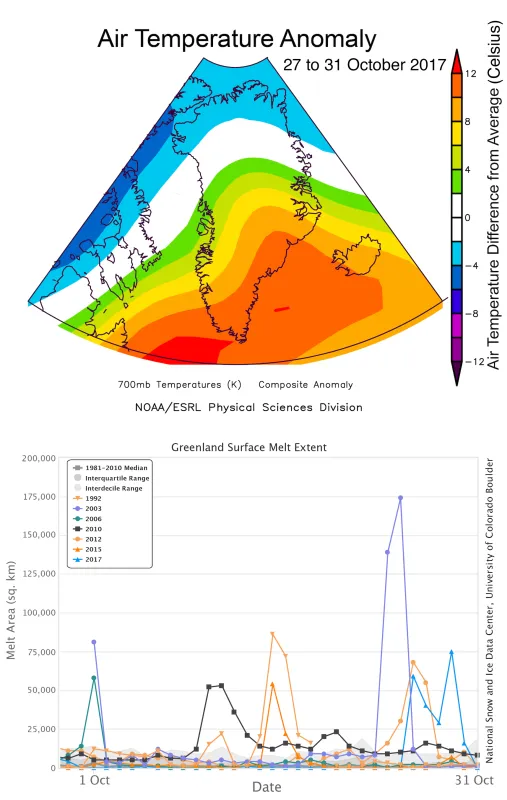
The 2017 melt year ended with two extreme spikes in melt area, one in mid-September and one at the end of October. While not unprecedented, such events are unusual. The 2017 late October event was notable for its duration (4 days with melt area above 25,000 square kilometers (10,000 square miles)). As with many warm events during the winter, a surge of warm air along the eastern coast was responsible for the melting. In 2003, a much larger melt event occurred in late October.
Did the Greenland Ice Sheet grow in 2016 to 2017?
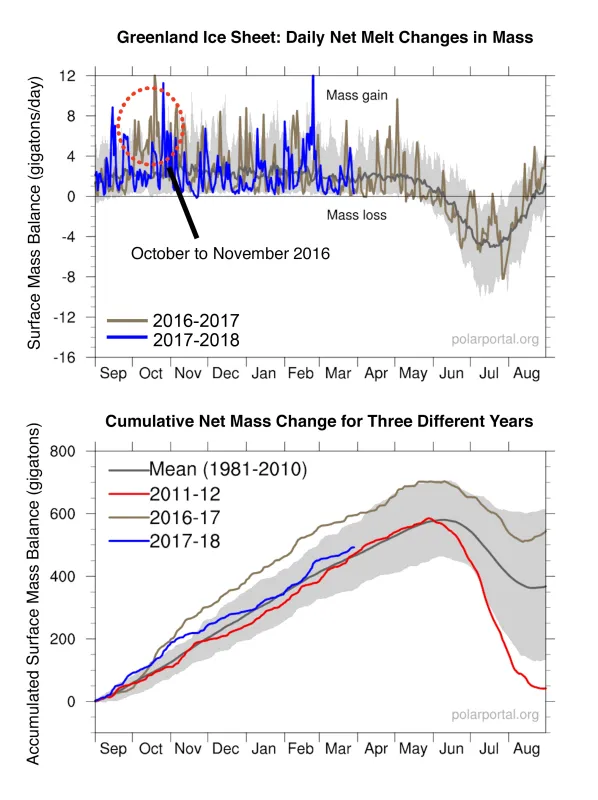
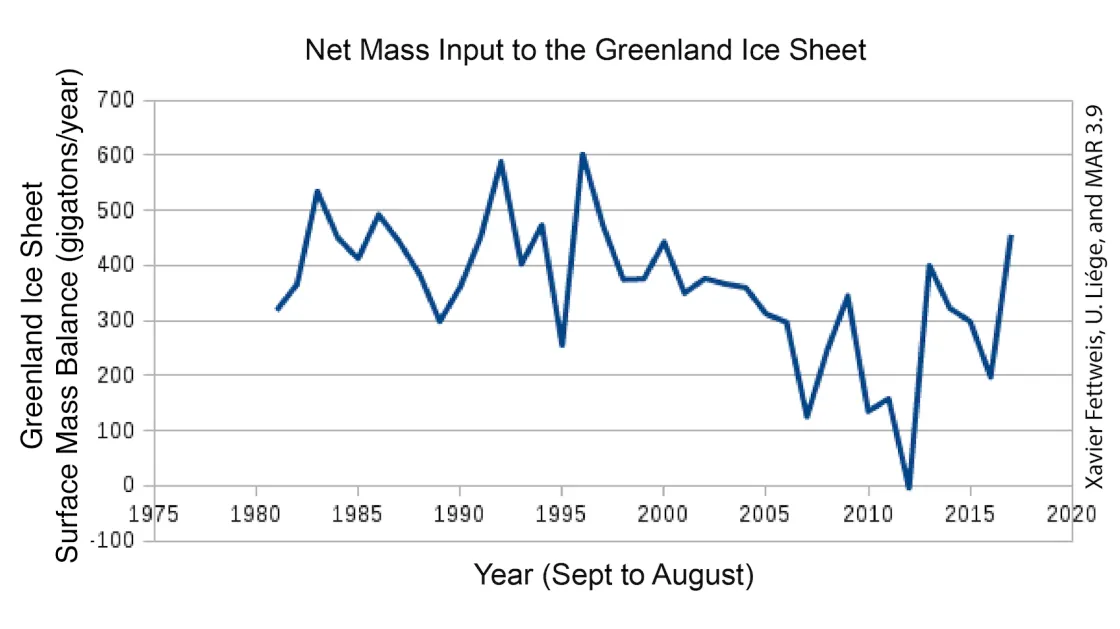
A model-based assessment of Greenland’s total net mass balance from snowfall, rainfall, and melt runoff (surface mass balance or SMB) shows large snow input in fall and winter 2016, followed by low surface melting in summer 2017. Relative to the 1981 to 2010 reference period, the ice sheet accumulated just under 200 billion tons more snow than typical. This value does not include the mass lost through ice flow to the ocean that produces icebergs, or to melting on the underside of the ice as it first flows into the ocean. Compared with 2014 to 2015 and 2016 to 2017 melt years, where mass loss ranged between -190 and -270 billion tons, it is likely that 2016 to 2017 was very close to a zero net mass gain, and possibly positive. If so this would be the first time since the late 1990s that the ice sheet increased in size. Unfortunately, the best satellite for making such assessments, the Gravity Recovery and Climate Experiment (GRACE), ceased to operate prior to summer 2017. The replacement satellite, GRACE-Follow-On (GRACE-FO), is scheduled to launch this spring. Early trends in the 2017 to 2018 season show a smaller but still above-average snowfall input to the season so far, with an intense storm depositing a significant amount of snow in mid-February. Early melt events prior to April 1, have been minor, but a few areas of melting occurred on February 18, along the eastern coastline. The eastern coastline is also the main region of above-average snow input to date.
Further reading
The 2017 Greenland Ice Sheet surface mass balance (SMB)
