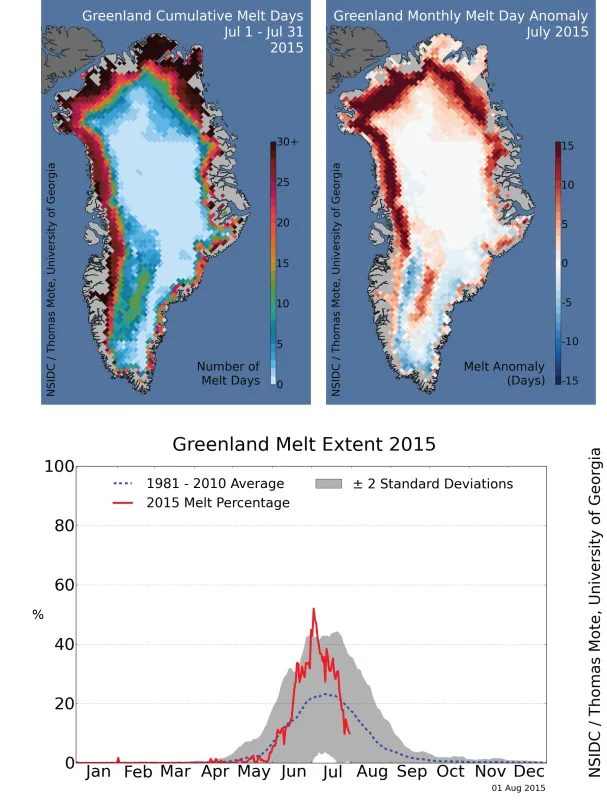
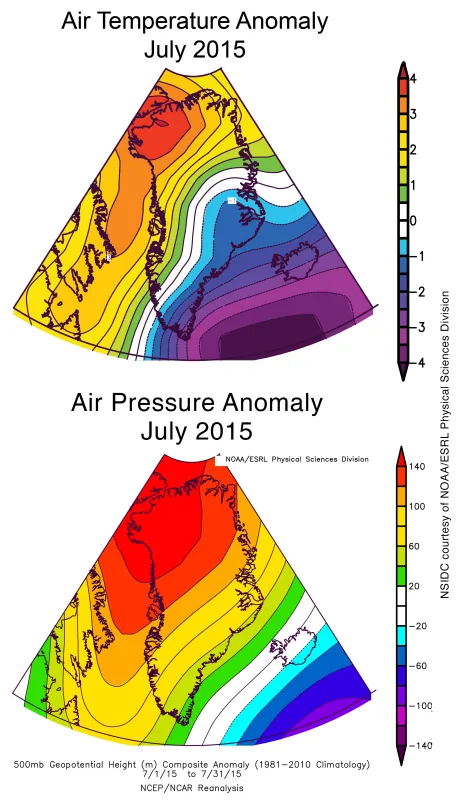
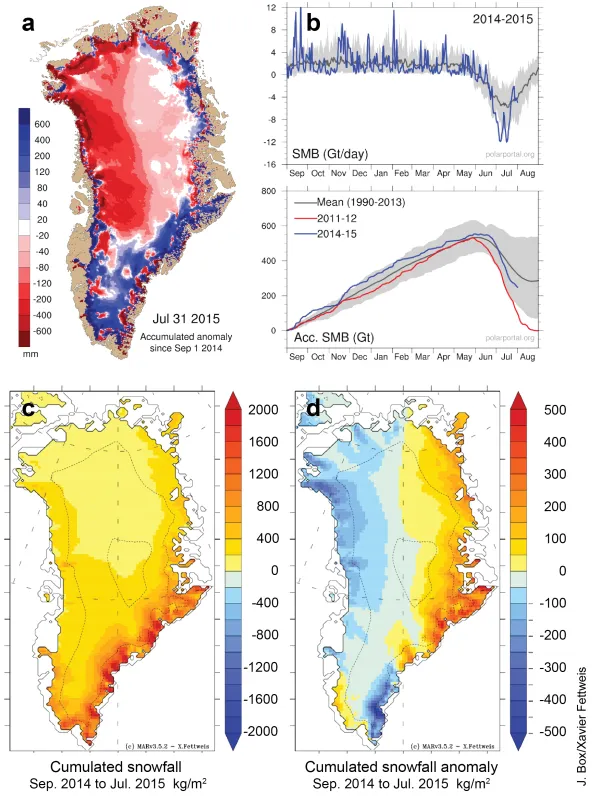
Surface melting was significantly more frequent and more extensive than average on the Greenland Ice Sheet in July, especially around the northwestern coast. July also saw high air pressure over the entire island and warmer-than-average temperatures in the northwest. This warmer summertime pattern, combined with lower winter snowfall patterns, resulted in a large mass loss from the ice sheet for the summer to date.
Overview of conditions
The surge in surface melt extent for the Greenland Ice Sheet that began in late June continued through much of July, with melt extent through mid-month not far from two standard deviations above the average for the 1981 to 2010 reference period, and peaking above two standard deviations during the first few days of July. By the last week of the month, overall melt extent had fallen below average. Broad areas of the far northern ice sheet and the northwestern Melville Coast experienced frequent surface melting. A somewhat unusual pattern occurred in the south, with more melt days than average near the ice sheet ridge crest (center) and coastline, and below-average melting in mid-elevation areas. The pattern could be explained by calm winds near the ridge crest, permitting surface melt, and stronger winds along the flanks, or by differences in cloud conditions. A similar pattern is seen in a model of surface melting based on weather conditions (see Dr. Xavier Fettweis’ Web page).
Conditions in context
Greenland’s temperature pattern is almost always a bull's-eye pattern, warmer around the coast and significantly colder near the center of the ice sheet. This pattern is driven by the high elevation difference between coast and summit. For this reason, we look at anomaly, or the deviation from the average pattern, to help see the weather characteristics of the month. In July, the anomaly showed a strong gradient from northwest to southeast, with conditions up to 3.5 degrees Celsius (6 degrees Fahrenheit) above average near Qaanaaq (Thule) in northwest Greenland, and about 1.5 degrees Celsius (3 degrees Fahrenheit) below average near Helheim Glacier in the southeast. The temperature pattern is consistent with a pressure pattern that has higher-than-average air pressure centered over the island for the month. A tendency toward clear skies and southerly winds along the northwestern coast is associated with strong high pressure over northern Greenland. The NAO (North Atlantic Oscillation) and AO (Arctic Oscillation) remained in a mildly negative index pattern throughout July.
Running a deficit
The sharp increase in surface melt extent (and estimated melt runoff) in July resulted in large ice mass loss rates. Although 2015 is not at satellite-era record levels (set in 2012), there was a large rate of loss overall. A combination of low snowfall in the past winter season and warm temperatures with extensive melting resulted in a large loss of ice from the ice sheet in the northwest. Some areas in the southern one-third of the ice sheet have less loss than average. Greenland typically loses mass due to melt runoff through the summer, although in recent years both low snow and runoff, and an increase in glacier outflow (not shown here) have combined to significantly shrink the thickness of the ice sheet, contributing to sea level rise.
Water-soaked: continued from June 15th
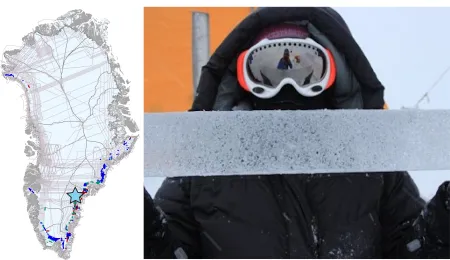
The high pressure over Greenland for much of July led to very good conditions for field work, bringing sunny skies to southeast Greenland. While melt area dropped below average overall for Greenland late in the month, melting was still frequent along the coastal southeast. The Greenland aquifer field team (a joint NSF/NASA research project) conducted a field measurement program to determine how the firn aquifer level and volume fluctuates through time (see our post for June 15, 2015, and the Earth Observatory Greenland Aquifer Expedition site). As warming conditions continue over the Greenland Ice Sheet, melt is extending further inland, increasing the extent of water-soaked snow at depth (called the firn aquifer). The aquifer level is also rising towards the surface in the interior of the ice sheet. Some drainage, locally lowering the aquifer level, has been observed toward the coast. To date there are just two ice cores that can be used to determine the volume of water in the aquifer. These suggest that the total volume of water in the aquifer has not changed significantly between 2013 and 2015. Airborne radar from Operation IceBridge from 2011 to 2013 suggests that the volume of the aquifer is likely increasing inland and perhaps decreasing towards the coast.
Fly-over tour of the Greenland melt lake region
A mock aerial tour video, created by NASA's Goddard Data Visualization group, highlights the importance of surface meltwater lakes in western Greenland and describes the goals of mapping lake depths from space. NSIDC's Dr. Allen Pope narrates. Meltwater on the surface of the ice sheet can drain through the ice and accelerate the flow of ice by partially lifting the ice sheet off the bedrock and gravel base (see Zwally et al. study for further reading). Landsat 8 satellite imagery from last July helps show the many melt lakes that typically pock the surface of the ice sheet in summer.
References
Zwally et al., Surface melt-induced acceleration of Greenland Ice Flow, Science, https://doi.org/10.1126/science.1072708.


