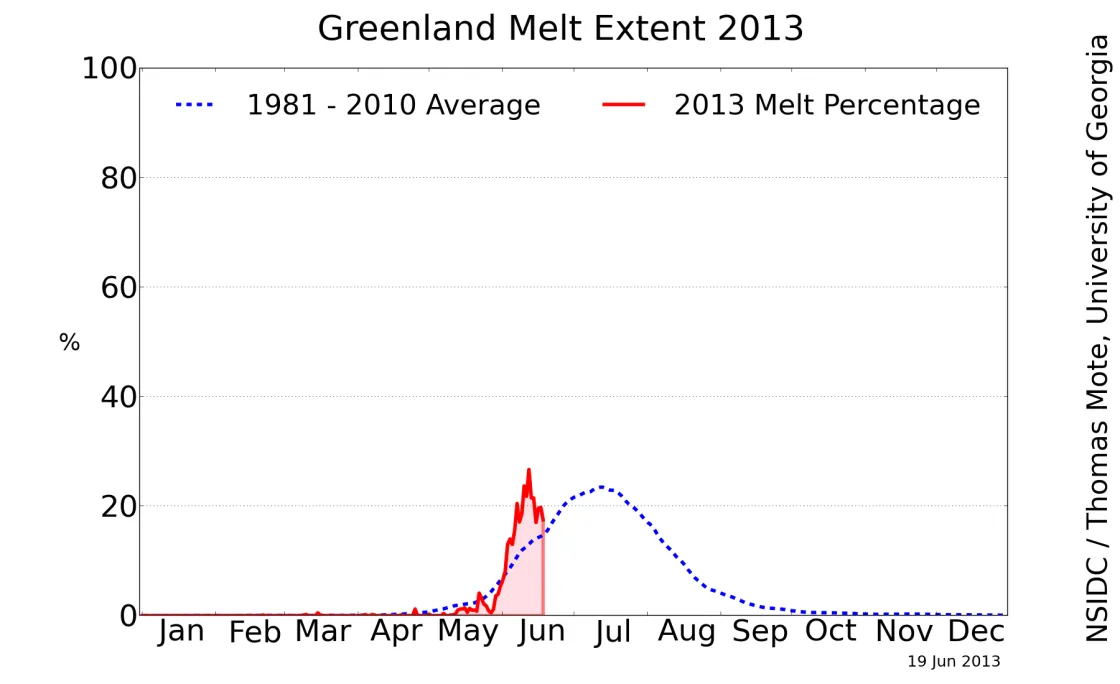
Surface melting of the snow and ice of the Greenland Ice Sheet had a slightly late start, but quickly spread over a significant area, extending over more than 20% of the ice sheet in early June and reaching above 2,000 meters (6,500 feet) elevation in some areas. Small melt lakes have begun to form on the ice sheet, as seen by the new USGS/NASA Landsat-8 satellite.
Overview of conditions
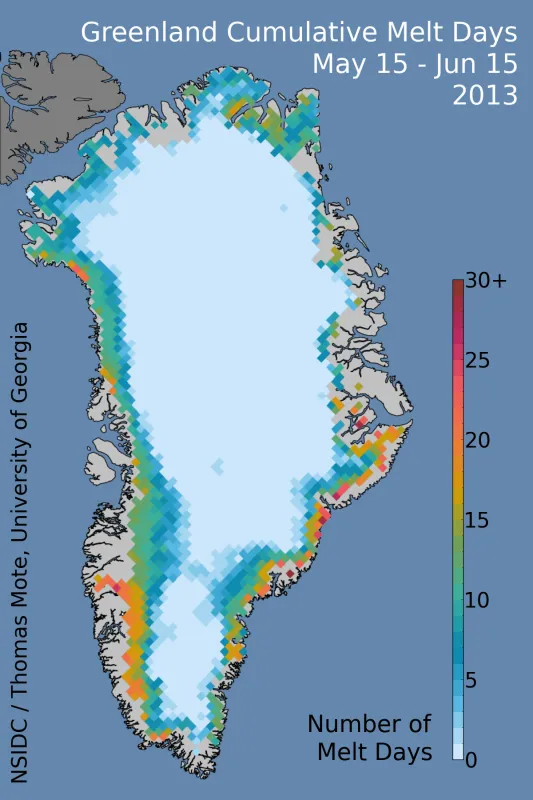
After the annual re-calibration of the melt algorithm in mid March (see March 18 post), very little melt was detected until May. A few southern coastal areas began melting in mid-May, followed by inland higher-elevation ice and all remaining coastal areas about June 3, when warmer conditions arrived. Surface melting reached the "Saddle" region of the ice sheet (located where the pale bluish band extends from the east to the west coastal zones in Figure 1) on June 11 and 13. Only the central eastern coast remains relatively melt free.
Conditions in context
At this point, the pace of melt is well above average, but well behind the early, intense start seen in the record 2012 season (see February 5 post). After a spike in melt area in early June, cooler conditions have brought the melt area near the average extent of ~20% of the ice sheet.
Rising temperatures
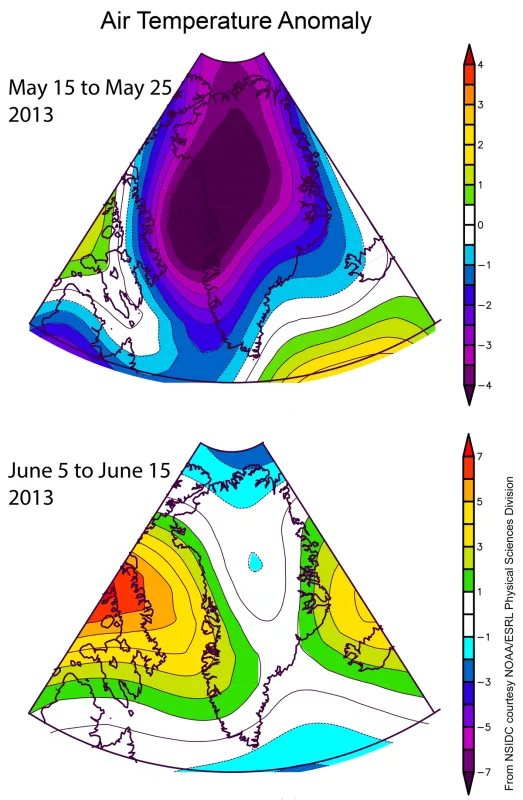
Cool conditions in April and May shifted to warmer-than-average weather along both coasts in early June, which initiated more widespread melt on the ice sheet. This shift roughly coincided with a larger change in the Arctic Oscillation from near-neutral conditions to slightly positive, and a shift from generally easterly and northerly winds to southwesterlies. The sea ice on both sides of Greenland remained at near-normal extent through the period.
Landsat 8 Images of early melt lakes
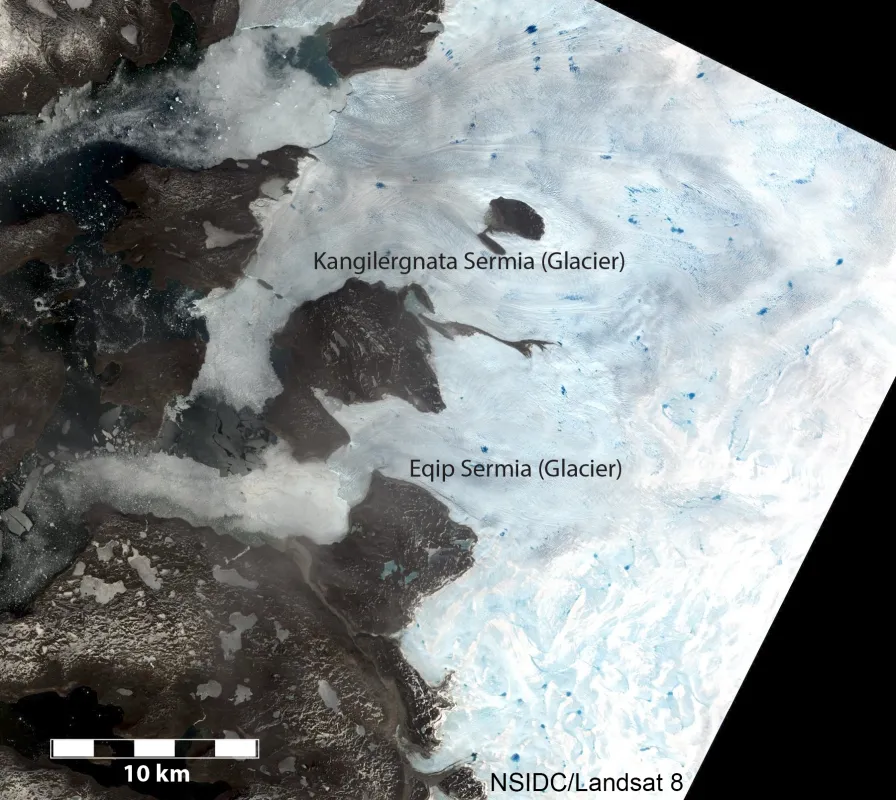
Melt ponds are already forming in some lower areas of the ice sheet, as shown in Figure 4. Ponds of meltwater on the ice sheet can have a significant impact on ice flow. As the ponds grow and deepen, they can force open cracks in the underlying ice and drain to the base of the ice sheet. This can lubricate the base of the glacier, causing it to flow more rapidly for a brief period. The drained water flows out under the ice sheet, emerging as small streams from beneath the ice at the edge. This image was acquired by the recently launched USGS/NASA Landsat 8 satellite, using its multi-spectral camera, the Operational Land Imager (OLI). Landsat 8 offers great opportunities for mapping and measurement of the world's ice and its ongoing changes. One improvement in the new sensor is the addition of a new spectral band, in the far blue visible range. This band (Band 1) may be useful for mapping lake area and depth. Knowing the total lake volume and rate of lake volume change is an important parameter for characterizing the intensity of the melt season and its potential effect on the rate of ice flow and surface melting for the ice sheet.
A report from the field
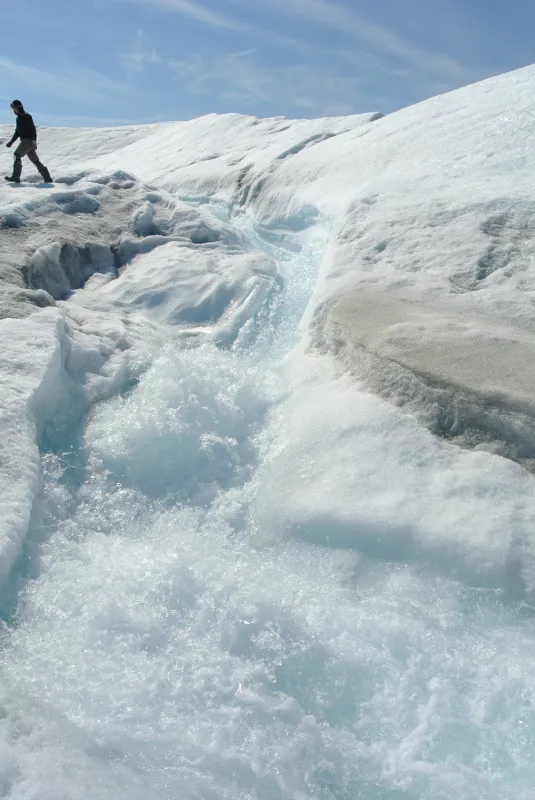
With summer beginning, many Greenland researchers are now in the field, and reporting back on observed surface melting conditions. Thomas Mote from University of Georgia, who is in the Kangerlussuaq area with Asa Rennermalm of Rutgers University, reports indications that there was a fairly warm late winter, a cool spring, and heavy snow in May. This area has experienced strong melting, but much of it is the melting of the late spring snowfall. There is word of a 1-kilometer (0.6 mile) long meltwater lake about 7 kilometers (4 miles) inland on the ice east of Kanger. They did observe some fairly large meltwater streams and moulins.
A darker shade of pale
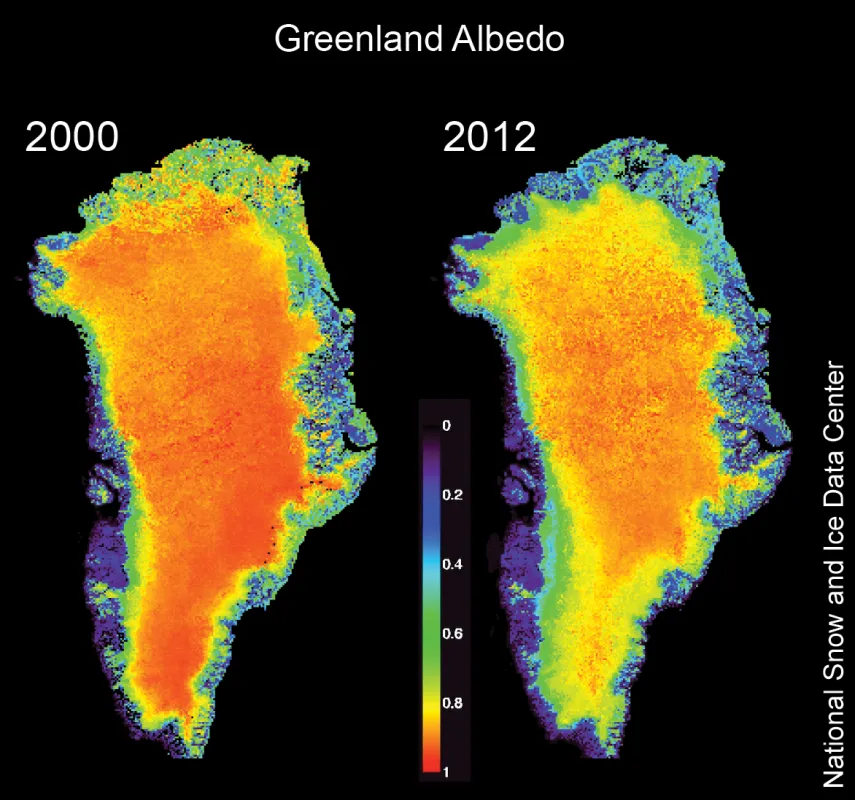
[Surface melting on the ice sheet reduces the reflectivity of the snow, and this change is measured by albedo, the ratio of the amount of light reflected from a surface to the amount of incoming light. Over the past twelve summer seasons, surface melting has increased in Greenland, culminating with last year's very extensive and intense melt season. Satellite data have been used to track this change in a recently submitted paper by Stroeve et al. (2013, in revision), showing that albedo has dropped by as much as 0.3 (30% reflectivity) in some areas. Dry cold snow is the most reflective naturally occurring land cover type on Earth, with albedos as high as 0.95, but as melting begins, this drops to 0.70, and continues to drop with increased melt. Very wet snow has an albedo of 0.6 to 0.5, and exposed ice can be as low as 0.3. This darkening of a snow surface with the onset and progression of melt leads to an important climate feedback. With warm conditions, melting and darker snow leads to more sunlight absorbed by the snow, leading to further melting and darkening.
A note on the data
We thank our readers for writing us with useful suggestions to include more historical data on surface melt, as well as other statistical information. We are working to add such information as time and funding permit.
Reference
Stroeve, J., J. Box, Z. Wang, A. Barrett, and C. Schaaf. 2013. Re-evaluation of MODIS Greenland albedo accuracy and trends. Remote sensing of the environment, in revision. https://doi.org/10.1016/j.rse.2013.07.023
