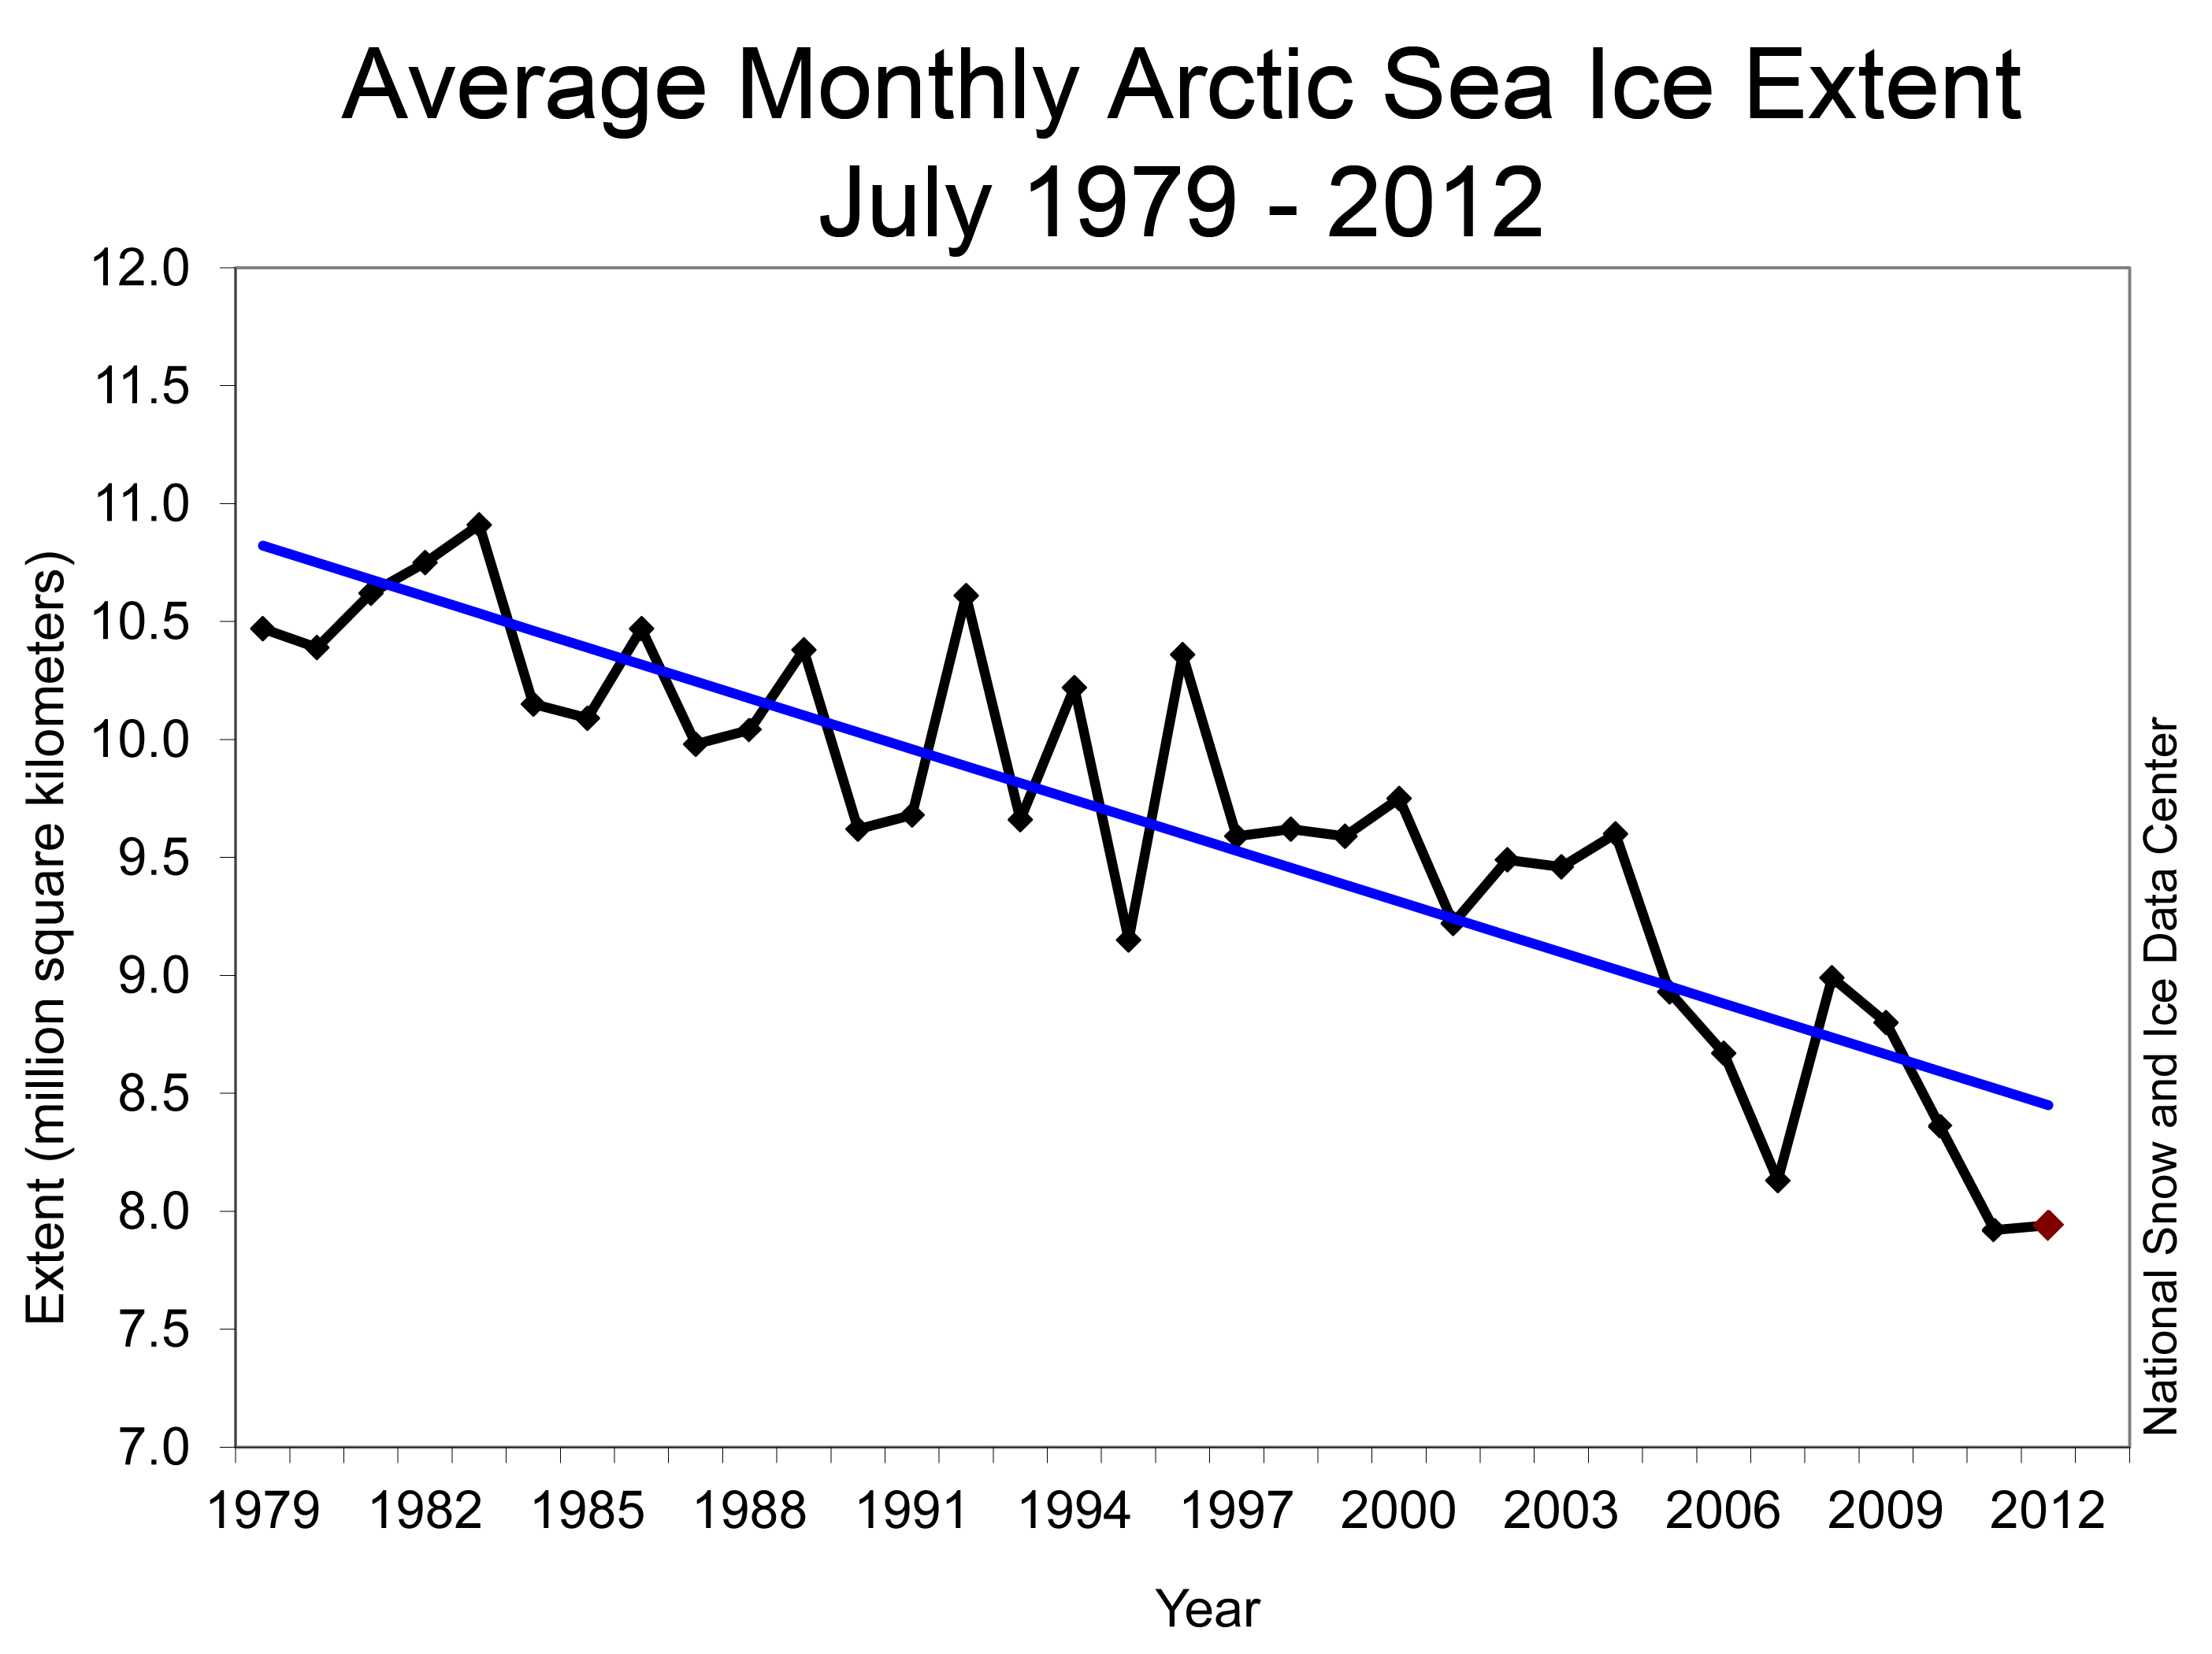
Figure 3. Monthly June ice extent for 1979 to 2012 shows a decline of 7.1% per decade.||Credit: National Snow and Ice Data Center |{a href=http://nsidc.org/arcticseaicenews/?attachment_id=2089}High-resolution image{/a}
Figure 3. Monthly June ice extent for 1979 to 2012 shows a decline of 7.1% per decade.||Credit: National Snow and Ice Data Center |{a href=http://nsidc.org/arcticseaicenews/?attachment_id=2089}High-resolution image{/a}
![]() Home | Contact Us
Home | Contact Us
© 2023, National Snow and Ice Data Center :: Advancing knowledge of Earth's frozen regions

