- Snow-covered area continued to decline in March 2020 from its peak in February.
- Both snow-covered area and snow cover days for March were just below average.
- Through March, snow cover percent and snow cover days were higher in continental locations and lower in California and Southwest United States.
- February patterns in Snow Water Equivalent (SWE) held through March, with low snowpack persisting in California and above average snow in locations farther inland.
- By the end of March, some regions no longer had a snowpack, such as monitoring sites in Arizona.
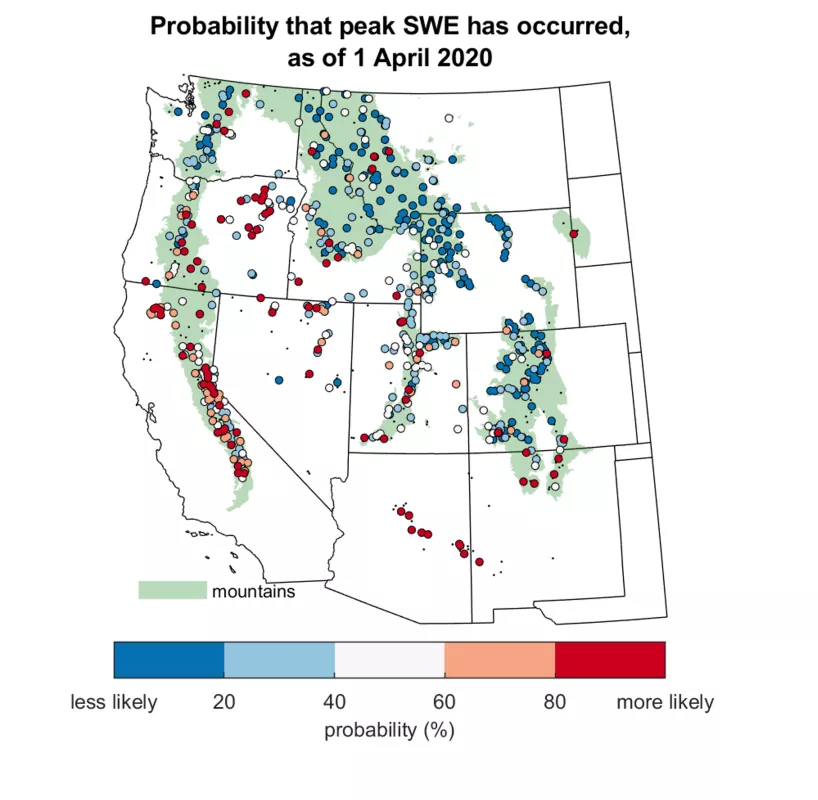
- April 1 is historically viewed as nearing the maximum SWE. The Rockies show less than a 50 percent probability of reaching maximum SWE in March while the Sierra Nevada, Arizona, New Mexico, and localized sites in the Pacific Northwest show greater than a 50 percent probability of reaching maximum.
Overview of conditions
| Snow-Covered Area | Square Kilometers | Square Miles | Rank |
|---|---|---|---|
| 2020 | 620,000 | 239,000 | 11 |
| 2001 to 2019, Average | 636,000 | 246,000 | -- |
| 2019, Highest | 923,000 | 356,000 | 1 |
| 2015, Lowest | 345,000 | 133,000 | 20 |
For the second month in a row, snow-covered area for the Western United States was just below average for this time of year when compared to the 20-year satellite record. For March 2020, snow-covered area was 620,000 square kilometers (239,000 square miles), just 2.5 percent less snow-covered area than the average March over the 2001 to 2019 reference period (Table 1). This was a notable improvement over earlier months in the current snow season, which had unusually low snow cover in December 2019 and January 2020. [Note that February 2020 actually had a near-average snow-covered area after re-analyzing last month’s data, and our daily images have been updated.] Following the trend from the end of February, snow-covered area in March 2020 continued to decline. March 2020 had much less snow-covered area than a year ago, when a record maximum 923,000 square kilometers (356,000 square miles) of snow-covered area was reported. Only five years ago in 2015, the record minimum for March reached 345,000 square kilometers (133,000 square miles) snow-covered area. March 2020 had 80 percent more snow cover than 2015.
Through March 2020, both snow-covered area (an instantaneous measurement) and snow cover days (a cumulative measurement) tracked slightly below average. Through the end of March 2020, there were 19.7 snow cover days when averaged over elevations greater than 1,200 meters (3,900 feet) in the Western United States. This was 1.7 days fewer snow cover days than the 2001 to 2019 average at the end of March.
Conditions in context
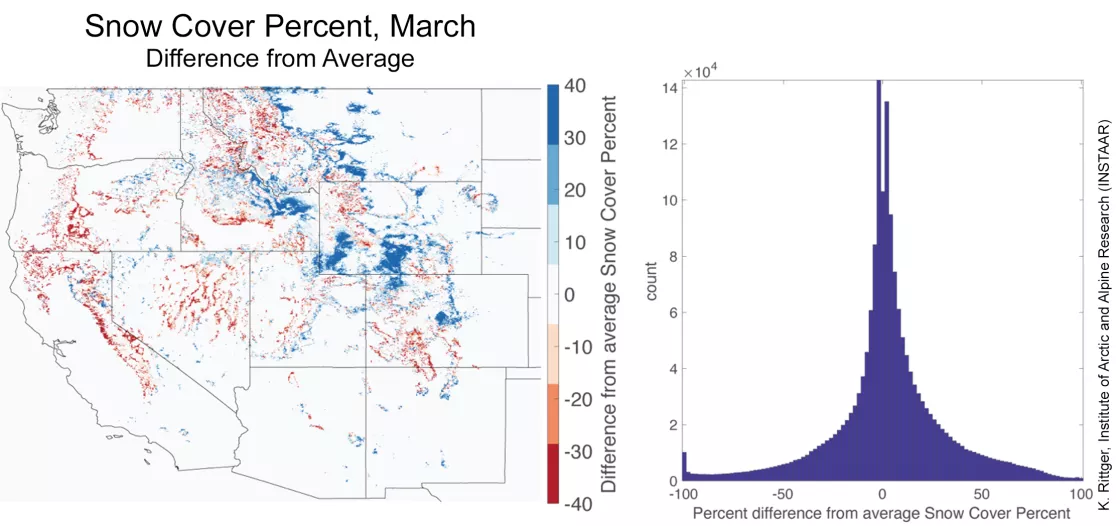
Compared to the 2001 to 2019 average, there was more snow-covered area in March 2020 in many parts of northern Colorado, southern Wyoming, mountains in New Mexico, and eastern Utah, Idaho, and Montana (Figure 1, blue zones in map). The other states—California, Oregon, Washington, Nevada, and Arizona—tended to have less snow cover in March 2020, especially at lower elevations (Figure 1, red zones in map). These regional differences largely canceled each other such that for the Western United States as a whole, snow cover was near the 2001 to 2019 average. In other words, the blue zones and red zones had largely balanced each other in terms of area (Figure 1, left).
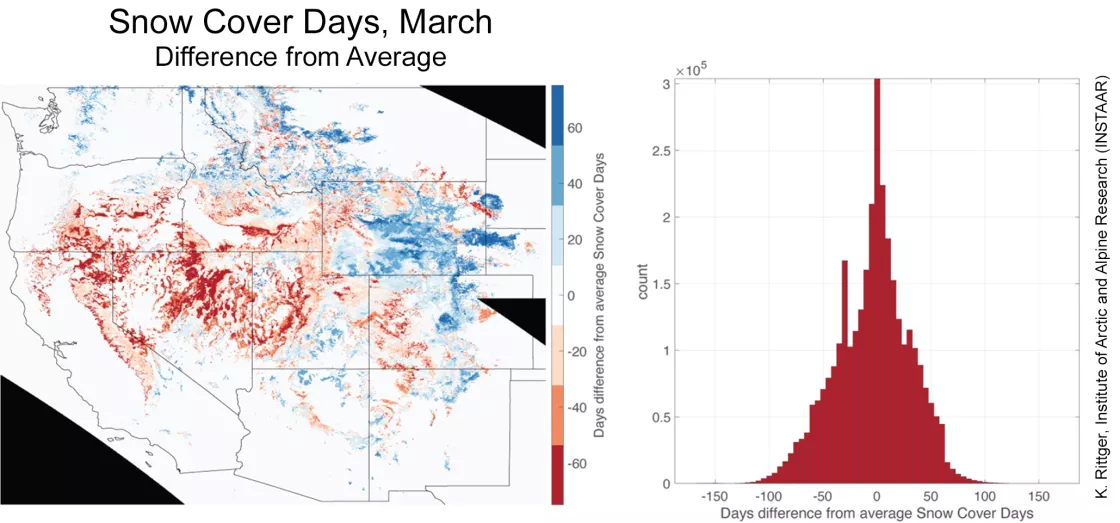
A comprehensive summation of snow conditions for the entire season is seen in the map of snow cover days from October 1 to March 31 (Figure 2, left). The dry conditions that have prevailed in the Southwest are evident, with fewer days of snow on the ground in the California Sierra Nevada, southern Oregon, Nevada, southern Idaho, central Utah, southwestern Colorado, and parts of Arizona and New Mexico (Figure 2, red zones in map). Meanwhile, more days with snow cover were found in Wyoming, the central and northern Colorado Rockies, southeastern Utah, Montana, northern Idaho, and northern Oregon, and Washington (Figure 2, blue zones in map). Similar to the differences in March snow-covered area (Figure 1, right), the differences in snow cover days for the Western United States as a whole in 2020 was near average (Figure 2, right). However, as seen in the histogram, some locations had snow on the ground for two or three months less than average (-60 to -90 day difference in the chart). In contrast, it was rarer for locations to have snow on the ground for two or three months more than average (+60 to +90 day difference in the chart).
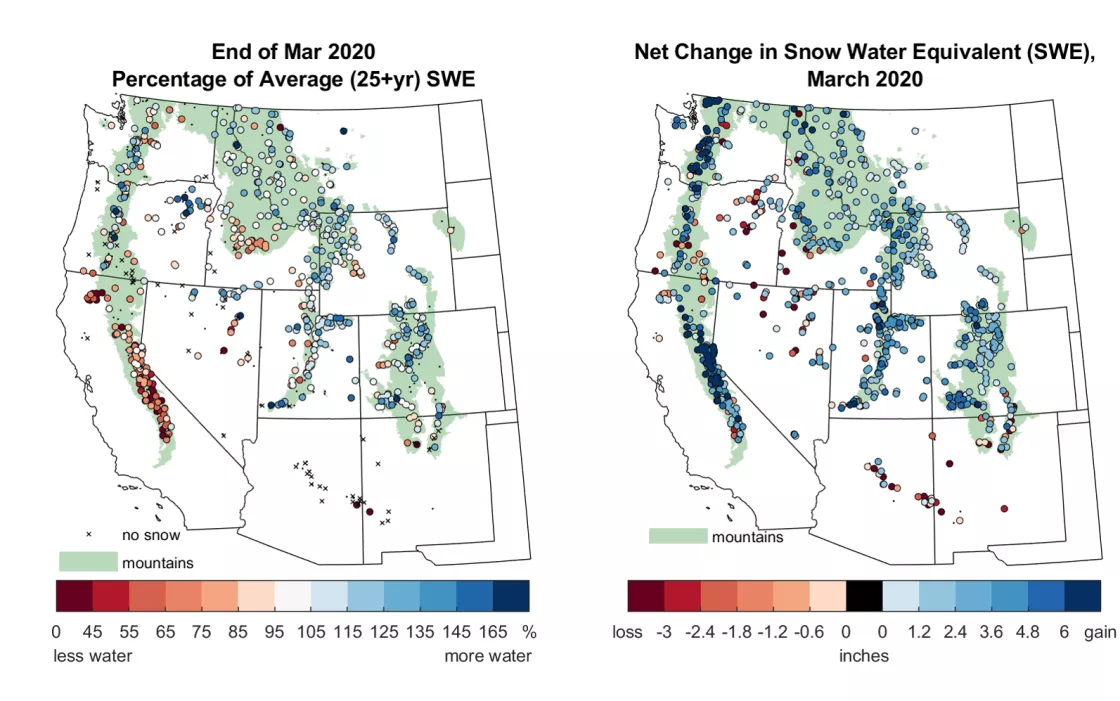
Snow Water Equivalent (SWE) patterns at the end of March were similar to the beginning of March, with a below-average snowpack prevailing through much of California, the Southwest, southern Idaho, and localized areas in the Pacific Northwest (Figure 3, left). In contrast, SWE was average to above average throughout the Rocky Mountains and parts of the Pacific Northwest Mountains (Cascades, Blue Mountains). The largest net increases—accumulation minus melt—in SWE in March were found in the Washington Cascades and the northern Sierra Nevada, where at least 6 inches (15 centimeters) of water was delivered as snow (Figure 3, right). These large storms in general develop more likely near coasts rather than farther inland. Locations across the Western United States had a net decrease in snowpack with melting conditions, including inland parts of the Pacific Northwest, Nevada, and Arizona (Figure 3, left). The snowpack melted out completely in some areas, such as Arizona. Areas with significant melting snow are beyond the maximum or peak SWE for the year (discussed more below), and more sites are expected to experience continued melt over accumulation in the coming weeks.
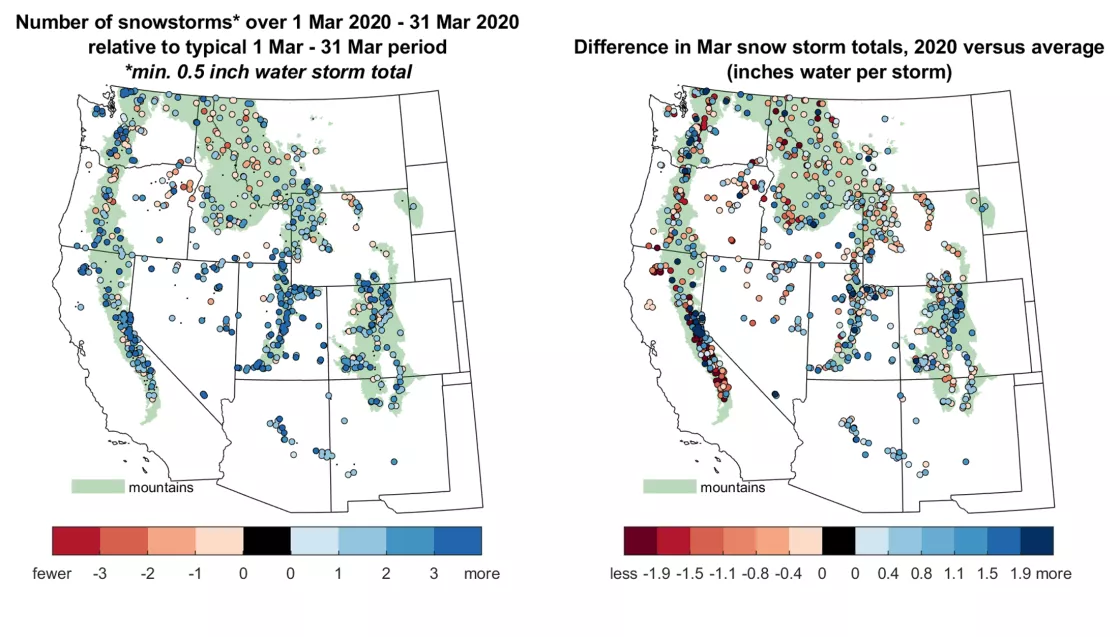
March had an above average number of snowstorms in the southern states (California, Nevada, Utah, Arizona, Colorado, and parts of Wyoming), with a mix of average or below average storms numbers in the northern states (Figure 4, left). Likewise, the southern domain mountain ranges (Rockies and Sierra except for most southern Sierra) generally had stronger snowstorms than in the northern ranges, relative to typical storms for those regions (Figure 4, right). A notable storm in mid-March over the Sierra (not shown) provided some relief to a very dry winter. This storm was particularly higher in intensity than typical March storms in the northern Sierra and around Lake Tahoe (Figure 4, right). Despite increased snowstorm activity through March, the new snowfall was not enough to reverse the ongoing snow drought in California (Figure 3, left).
The end of March marks an important period of water supply forecasting in snow-dominated watersheds, as historically the snowpack on April 1 is considered the approximate date for reaching the maximum annual SWE. Peak SWE is important because it is a primary metric of how much melt water may become available to supply rivers and ecosystems in spring and summer. The legacy of this convention, treating April 1 as the date of maximum SWE, is rooted in the history of snow measurement programs in the Western United States with manual snow surveys occurring typically at the beginning of each month. Recent research used daily snow pillow measurements (the same networks used in Snow Today SWE analyses) to assess how well April 1 approximates the timing of maximum SWE. While April 1 is a decent proxy for the date of maximum SWE when averaged across the full domain of the Western United States and Canada, regional differences arise (Musselman et al., 2019). For instance, although peak SWE occurs near April 1 in the California Sierra Nevada and Idaho intercontinental mountains, it occurs as much as a month earlier in the Southwest and Pacific Northwest and as much as a month later in the Rocky Mountains.
Monitoring stations and maximum SWE
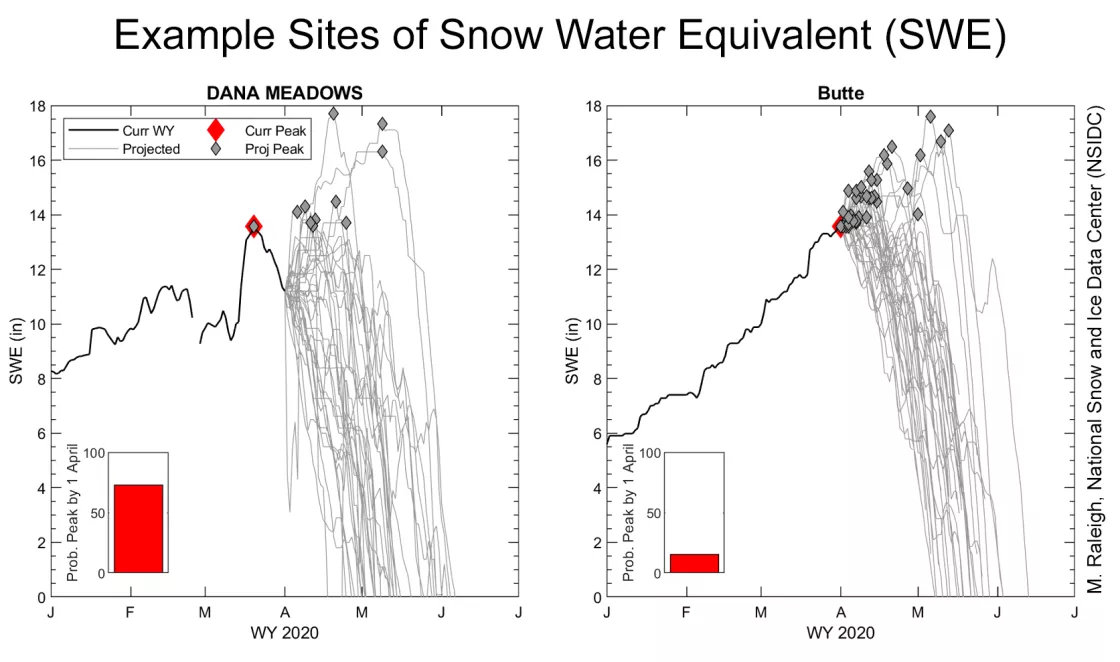
While the timing of this year’s maximum SWE at a particular location cannot be certain until later in the melt season, SWE at the end of March and how it has evolved from April 1 in distinct years in the historical record can provide insights into the potential timing of maximum SWE. Analyses at two examples sites—both with maximum SWE of 13.5 inches through the end of March—illustrate how the timing of maximum SWE may vary under different conditions (Figure 5). One site shows an extremely dry example that has likely passed peak SWE (Figure 5, left) and the other site shows an example that likely has yet to reach peak SWE in April or May (Figure 5, right).
The Butte, Colorado example (Figure 5, right) has reached about 13.5 inches (34 centimeters) as the current maximum SWE, occurring on March 31, 2020. What is the probability that the current maximum SWE holds once the snow melts away? To assess this question, the station’s record is examined to see what types of storms and melt events have occurred since April 1 in different years. For each year, we start with 13.5 inches (34 centimeters) on April 1 and step forward in time based on relative additions in SWE (snowstorms) and reductions in SWE (melt events) to project a possible trajectory for the current year. We thus have a possible trajectory for each year in the historical record. Requiring at least 25 complete years in the record, we look at how many of those possible trajectories suggest maximum SWE has already happened by April 1, 2020.
The probability that peak SWE has occurred is based on the number of projections with the peak occurring before April 1 divided by the total number of projections. At the Dana Meadows, California site (Figure 5, left), only ten (out of 35) of the historically based SWE projections show peak SWE greater than the current peak (about 13.5 inches on March 20, 2020), and thus the probability shows an excess of 70 percent that maximum SWE has been reached. In contrast, many more projections with maximum SWE occur after April 1 at the Butte site (Figure 5, right) where the probability that maximum SWE has been reached is only 15 percent. This data-driven approach is useful because it is simple and based on each station’s historical record, though still more sophisticated projections are possible.
Repeating this analysis on all stations using only data through March 2020, many locations, especially in the continental regions like the Rockies, had 50 percent less likelihood that maximum SWE occurred by April 1 (Figure 6). Places that had 50 percent greater probability of maximum SWE occurring by April 1 were: parts of the Sierra Nevada, Arizona, New Mexico, and localized areas in the Pacific Northwest. The Sierra Nevada are currently mired in snow drought, and given its historical record of accumulation and melt, maximum SWE has likely already occurred there by April 1. For sites with maximum SWE reached before the end of March, any gains in new snow in April and May are going to have to be large enough to offset declines in SWE from melt to push maximum SWE later in the year. The Dana Meadows example (Figure 5, left) illustrates that large, late season storms are required in order to shift maximum SWE later at sites that are actively melting before April 1. In places where snow melted out by the end of March—such as in Arizona—it is extremely likely that maximum SWE occurred earlier in 2020, as their historical record does not include sufficiently large April storms for the snowpack to have a late season rebound.
SnowEx 2020: Which sites are near maximum snowpack?
To date, we have been tracking snow cover and SWE conditions at thirteen sites in the NASA SnowEx campaign. Unfortunately, remaining SnowEx activities planned for this season have been postponed because of the ongoing COVID-19 pandemic. The measurements used in Snow Today, however, are automated and continue to operate and monitor snow conditions as they evolve at the SnowEx sites.
This analysis assesses the timing of the snowmelt season using available SWE and snow cover observations. The methods described above (Figure 5) were initially used to project the probability that maximum SWE occurred by April 1 at stations near the thirteen SnowEx sites, and then MODIS snow cover data were used to contextualize recent snowfall and snowmelt at a few of the sites.
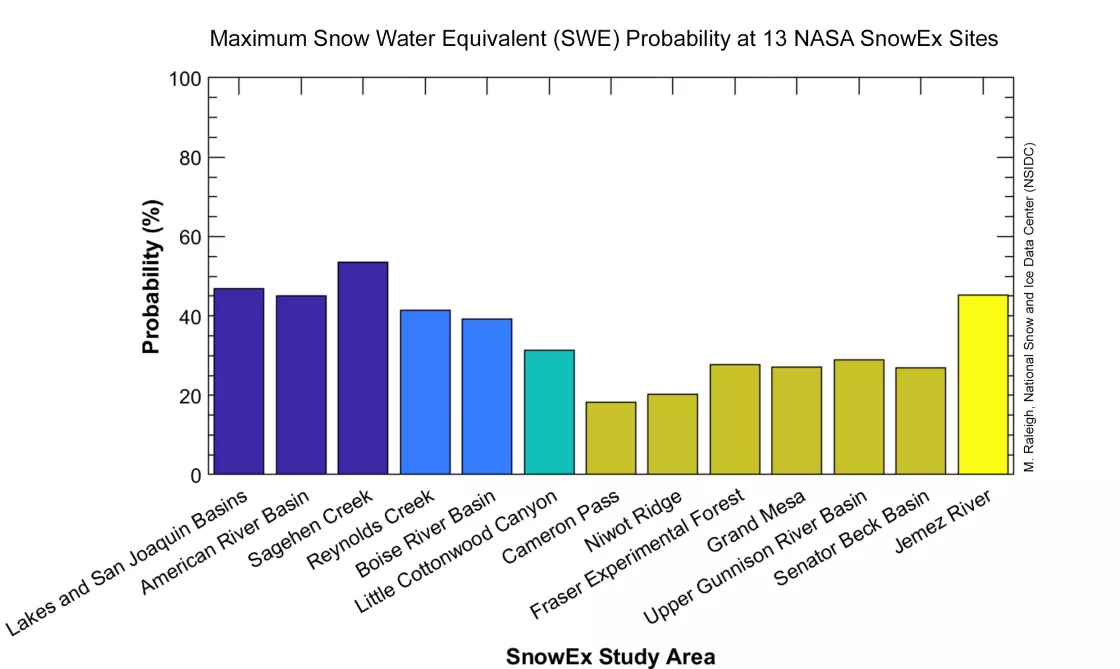
This analysis shows that at most SnowEx sites the probability that peak SWE has occurred by April 1, 2020 is on average below 50 percent (Figure 7). As noted in the March post, these sites are consistently snow covered throughout the winter season. Probability estimates are based on data from nearby snow pillow stations and as such reflect regional differences in maximum SWE timing (Figure 6). The three SnowEx sites in California collectively show the highest probability of maximum SWE in 2020 by April 1, ranging from 45 percent in the American River Basin to 53 percent in Sagehen Creek (the only site exceeding 50 percent probability). In contrast, six SnowEx sites in Colorado have the lowest odds of maximum SWE by April 1, with probabilities ranging from 18 percent in Cameron Pass to 29 percent in Upper Gunnison River Basin. The other study areas in Idaho, Utah, and New Mexico fall between California and Colorado (Figure 7).
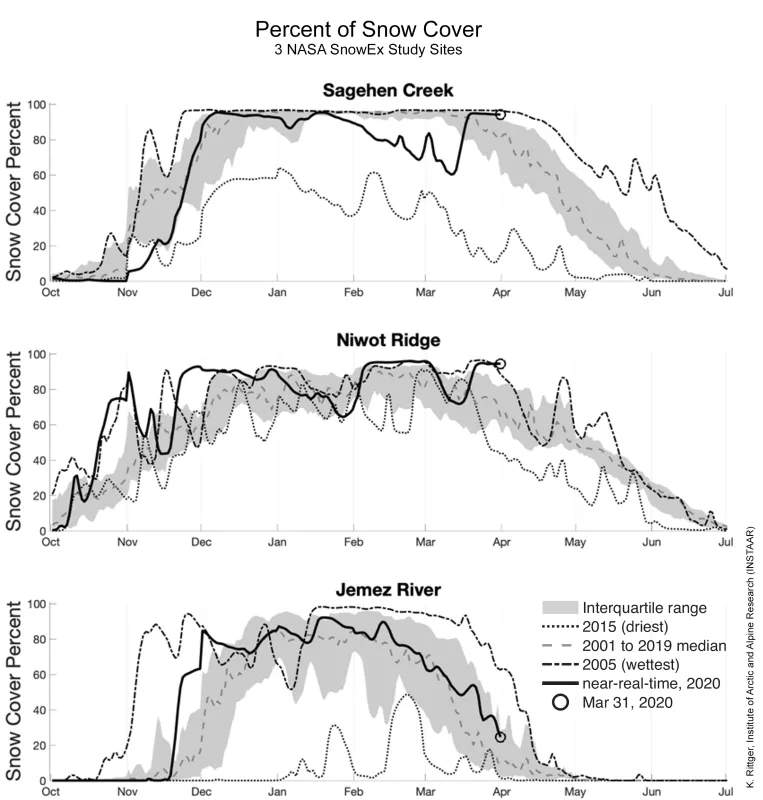
The timing of snowfall and snowmelt events leading up to March 31 can be seen by analyzing a 360 square kilometer (139 square miles) area surrounding SnowEx sites (Figure 8). For example, the snow cover data at Sagehen Creek in California (Figure 8, top) clearly show the large mid-March storm noted earlier in the Tahoe region that increased snow cover percent from well below average to above average for late March. The same storm progressed east to Niwot Ridge in Colorado where a decrease in snow cover percent had also occurred prior to the storm. Niwot Ridge has had above average snow cover (Figure 8, middle) and SWE for most of the year, suggesting maximum SWE has not yet occurred (Figure 7). Snow cover in the Jemez River (Figure 8, bottom) area in New Mexico shows a gradual decline from February onward with melting snow cover, and low snow-covered area as of late March 2020. These reductions in snow cover are consistent throughout New Mexico sites, with low SWE and a higher probability that maximum SWE was reached by April 1 (Figure 6). In a future post, data will be used to assess the incidence of snowmelt events, as well as the current and historical snow depletion and disappearance date at the SnowEx sites.
References
Rittger, K., M. S. Raleigh, J. Dozier, A. F. Hill, J. A. Lutz, and T. H. Painter. 2019. Canopy Adjustment and Improved Cloud Detection for Remotely Sensed Snow Cover Mapping. Water Resources Research 24 August 2019. doi:10.1029/2019WR024914.
Musselman, K. N., N. Addor, J. Vano, and N. P. Molotch. 2019. Reconsidering the Utility of the April 1st Snow Water Equivalent Metric for Water Resource Applications. Proceedings of the 87th Annual Western Snow Conference, Reno, Nevada.
