- Snow-covered area and snow cover days were near average in April 2020.
- Snow-covered area continued to decline in April 2020 but was bolstered by storms in California in early April and in Colorado in late April.
- Snow cover days, cumulative over the season, are slightly below average over the 2020 water year (October 1, 2019 to present).
- Snow cover days are beginning to level off as lower elevations melt out for the year.
- Rapid snowmelt is exceeding the average melt broadly across the entire Western United States.
- In the West, especially at lower and mid elevations, there is a net decrease in snow water equivalent (SWE), with a net increase in high elevations in California, Colorado, Wyoming, and Montana.
- The easternmost ranges across all latitudes have gained snow in April 2020, resulting in higher than average snow cover.
- The timing of snowmelt at SnowEx sites is assessed to assist planning activities for NASA.
Overview of conditions
| Snow-Covered Area | Square Kilometers | Square Miles | Rank |
|---|---|---|---|
| 2020 | 411,000 | 159,000 | 8 |
| 2001 to 2019, Average | 365,000 | 141,000 | -- |
| 2008, Highest | 529,000 | 204,000 | 1 |
| 2015, Lowest | 216,000 | 83,400 | 20 |
| 2019, Last Year | 442,000 | 171,000 | 5 |
Snow-covered area was 12 percent above average (Table 1) for the Western United States in April 2020 when compared to the 20-year satellite record. At this point in the season, snow can rapidly accumulate and melt. While February and March 2020 had slightly below average snow-covered area, storms in early April increased the area above the interquartile maximum only to rapidly decrease later in April. April had 7 percent less snow cover compared to last year and 22 percent less snow cover than 2008, the year with the highest April snow-covered area. Compared to 2015, the year with the lowest snow-covered area in April, 2020 had nearly twice the snow cover amount. During April 2020, daily snow cover was the lowest on April 30 at 268,000 square kilometers (103,000 square miles) and the highest on April 2 at 550,000 square kilometers (212,000 square miles). In other words, over half of the snow cover at the beginning of April melted away by the end of the month.
December through February had below average snow-covered area. Daily measurements of snow-covered area were slightly above average in April, unlike below average snow cover days, which is a calculation that accounts for all daily measurements to date. Between the start of the water year on October 1, 2019 and the end of April 2020, there were 22.7 snow-covered days when averaged over elevations greater than 1,200 meters (3,900 feet) in the Western United States. This was 1.6 fewer snow-covered days than the 2001 to 2019 average at the end of April. The progression in snow cover days has been tracking close to the historical record in recent months, as March 2020 had a similar deficit as April 2020—1.7 fewer snow-covered days—relative to the historical record (see previous post).
Conditions in context
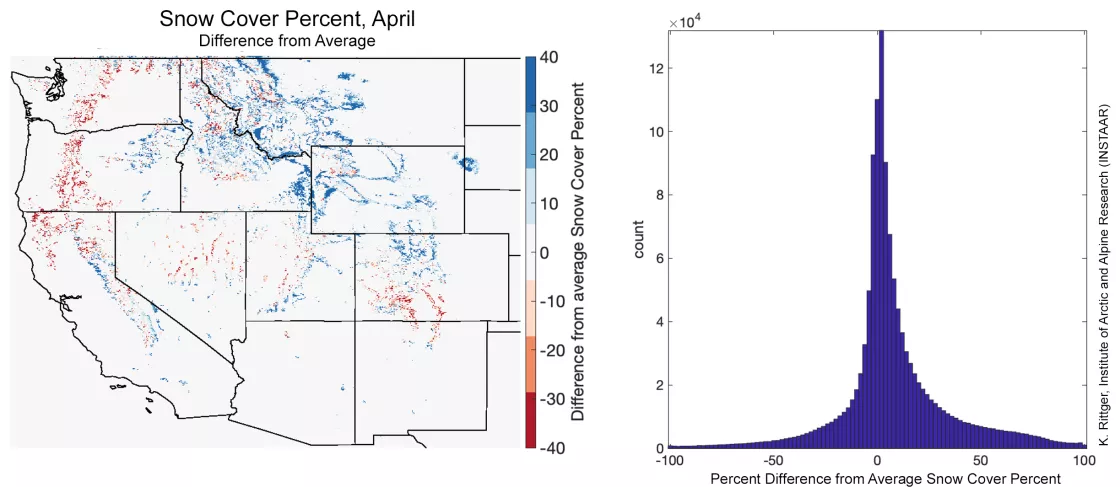
Compared to the 2001 to 2019 average, there was more snow-covered area in April 2020 in Montana, Wyoming, eastern Idaho, eastern Utah, northern Colorado, and eastern Oregon (Figure 1, blue zones in map). In contrast, Washington, western Oregon, northern Nevada, and southern Colorado had less snow-covered area compared to the average (Figure 1, red zones in map). California snow cover conditions were mixed after an early April storm with lower than average snow-covered area in the most northern areas, and more than average snow-covered area west of Lake Tahoe. Similar to March, the regional differences in April nearly canceled each other out across the Western United States (Figure 1, right), resulting in near average snow cover (Table 1).
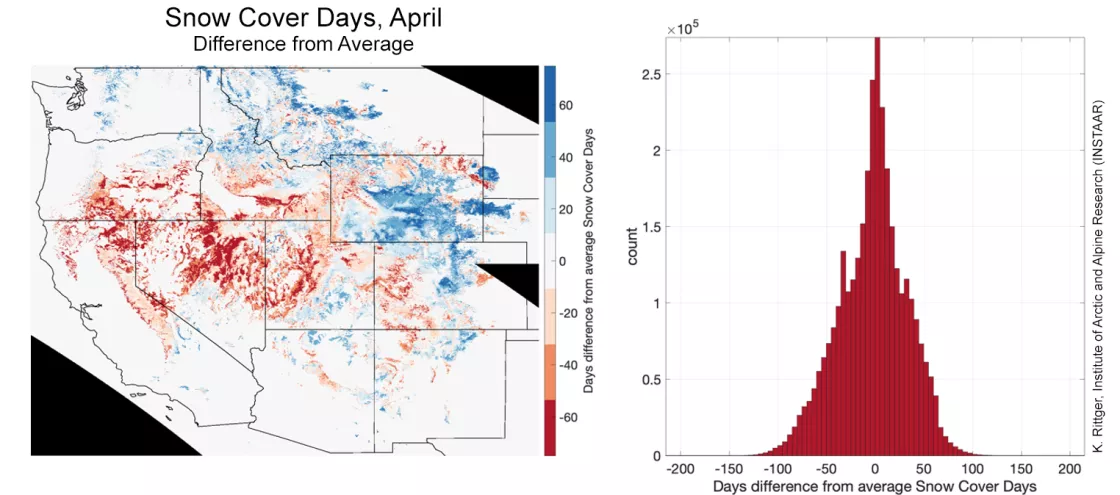
Maps of snow cover days from October 1 to April 30 (Figure 2, left) provide a more comprehensive look at snow conditions for the entire season. Lower than average snow-covered area over December through February continues to impact snow cover days with too few significant storms to change the trajectory of snow cover days in February through April. However, storms increased snow cover days in California, parts of Montana, and some of the lower elevation areas to more average values. Otherwise, there was little change in the pattern of snow cover days over the course of April in Washington, Oregon, Nevada, Idaho, Wyoming, Utah, Colorado, New Mexico and Arizona. Above average values in interior states such as Montana, Wyoming, northern Idaho, and northern Colorado help offset the more western areas that have fewer than average snow cover days (Figure 2, right). However, as noted earlier, the Western United States as a whole has slightly less than average snow cover days through April (1.6 fewer days with snow cover).
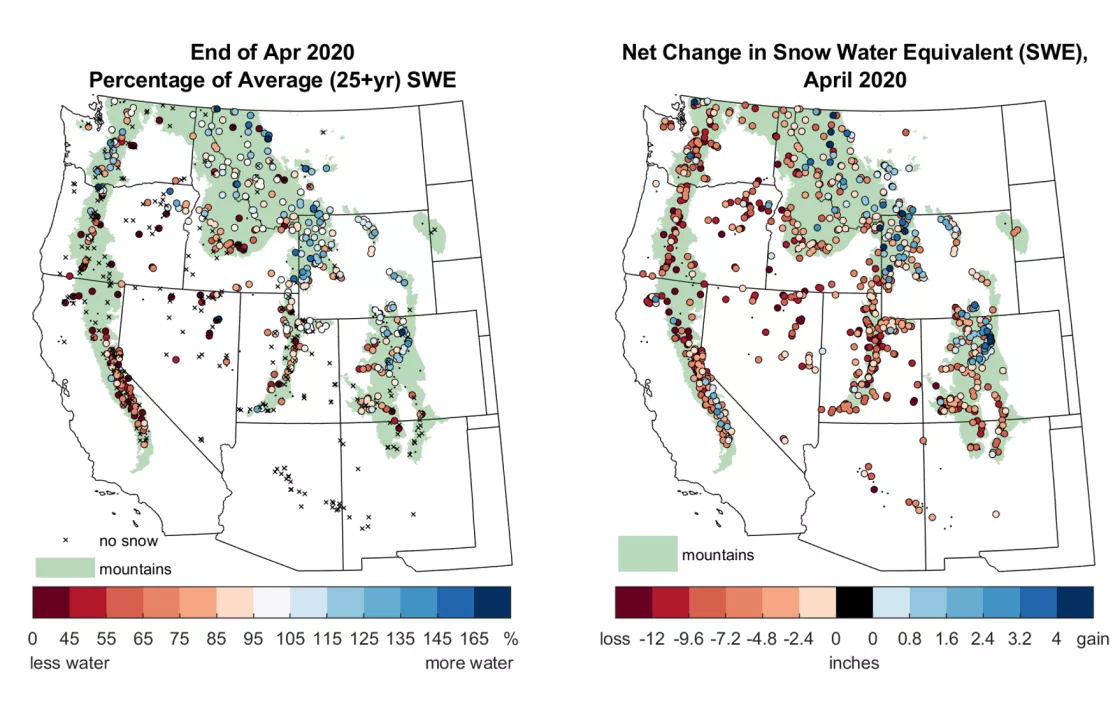
Snow water equivalent (SWE) at the end of April 2020 was below average at many sites across the California Sierra Nevada, Oregon, central and southern Idaho, central Utah, and southern Colorado (Figure 3, left). Many sites across the Western United States reported a decrease in SWE in April (Figure 3, right). Exceptions to these losses were high elevation sites in California, Colorado, Wyoming, and Montana, which gained SWE in April (blue markers, Figure 3, right) or showed no change (white markers). Increasing numbers of sites are also starting to report no snowpack. As of the end of April, sites that have lost all snowpack were most prevalent in Arizona and New Mexico but there were a notable number of sites with no remaining snowpack in Oregon, Nevada, and Utah. Similar to snow-covered area and snow cover days, sites with near average or above average SWE at the end of April were more concentrated farther inland from the Pacific Ocean, such as from northern Colorado through Wyoming and Montana, northeastern Utah, and parts of Northern Idaho (Figure 3, left). There were also some localized areas with average to above average SWE in the Washington Cascades and eastern Oregon.
A few sites with notably high SWE (exceeding 165 percent of average) were found at the end of April (e.g., in Montana and northern Colorado). However, caution in interpreting SWE percentage numbers is warranted near the beginning and end of the snow year, as very large percentages can result if there is even a modest amount of snow at a time of year when there is usually much less snow around. For that reason, the color bar in the SWE percentage graph stops at 165 percent of average (Figure 3), a reasonable upper limit that avoids bombastic headlines that are sometimes reported in the media. This is particularly a problem in years when snow persists longer, which can occur after a winter with very high snow accumulation, and/or years with late and slow snowmelt in spring and summer. In a future article, we will provide more discussion and analysis on the utility and pitfalls of the popular SWE percentage metric.
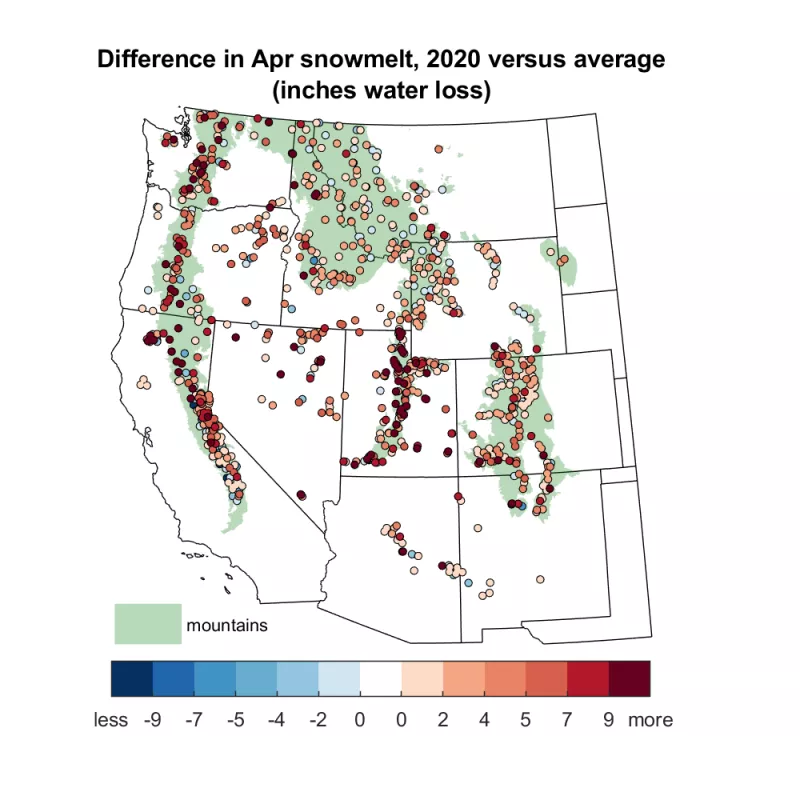
Comparing snowmelt in April 2020 to the historical records at each site in the Western United States, widespread and high melt totals were apparent (Figure 4, orange and red markers). The vast majority of sites had at least two inches more snowmelt in April 2020 than in an average April, and some sites had as much as nine inches more melt than average for April. Most notably, these high melt sites were found in Utah, but also parts of the Sierra Nevada and Cascades. Idaho, Montana, Wyoming, and Colorado—locations with average or above average snow-covered area and snow cover days—had more average melt totals. There were very few sites that had less snowmelt in April 2020 than average (Figure 4, blue markers), and these were generally isolated sites without any coherent, regional pattern. In these analyses, snowmelt is assumed whenever SWE declines between days, but it should be noted that other factors can also lead to loss of snow on the ground, such as sublimation. Given the high melt totals through April, we estimate that 85 percent of the sites have a greater than 95 percent probability that the maximum SWE was reached in 2020 before the end of April (see Maximum SWE section in previous post). Based on the snow cover and SWE data in April, it is clear that spring is in full swing.
SnowEx 2020: The timing of snow cover depletion and nearby snow melt
To date, snow cover and SWE conditions have been tracked at 13 sites in the NASA SnowEx campaign. Unfortunately, SnowEx activities planned for this snow season have been postponed because of the ongoing COVID-19 pandemic. The measurements used in Snow Today, however, are autonomous and continue to operate and monitor snow conditions as they evolve at the SnowEx sites.
This analysis assesses the melt and depletion of snow-covered area, and the timing of melting snow based on snow cover and SWE data for SnowEx sites to gain insights for planning the timing of future airborne observations in 2021.
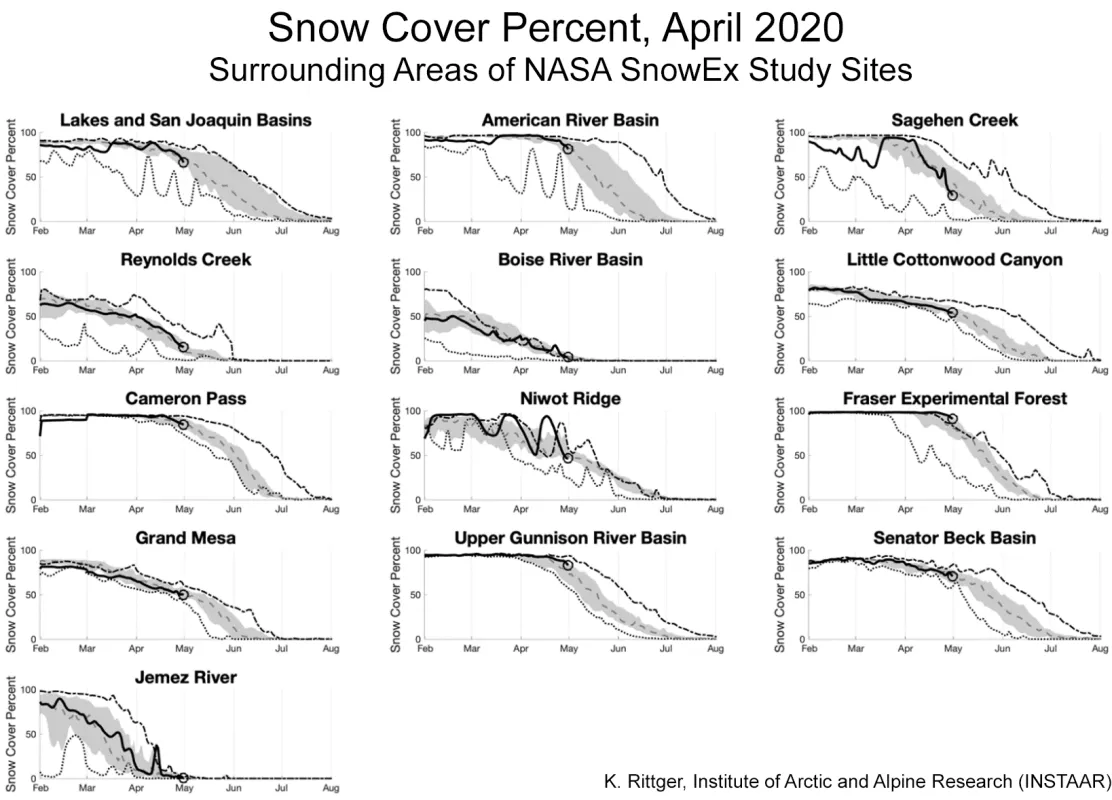
Snow-covered area is examined in regions where SnowEx plans to make airborne measurements with the Uninhabited Aerial Vehicle Synthetic Aperture Radar (UAVSAR). The loss of snow-covered area over the last few months (Figure 5) clearly indicates that melt is happening in the region. The most significant melt has occurred in Jemez River, Boise River Basin, Reynolds Creek, and Sagehen Creek. These four sites started losing snow-covered area in February. Little Cottonwood Canyon, Niwot Ridge, and Grand Mesa began losing snow-covered area in March. In contrast, there were only small decreases in snow-covered area for the American River Basin, Cameron Pass, Fraser Experimental Forest, Upper Gunnison River Basin, and Senator Beck Basin through the end of April.
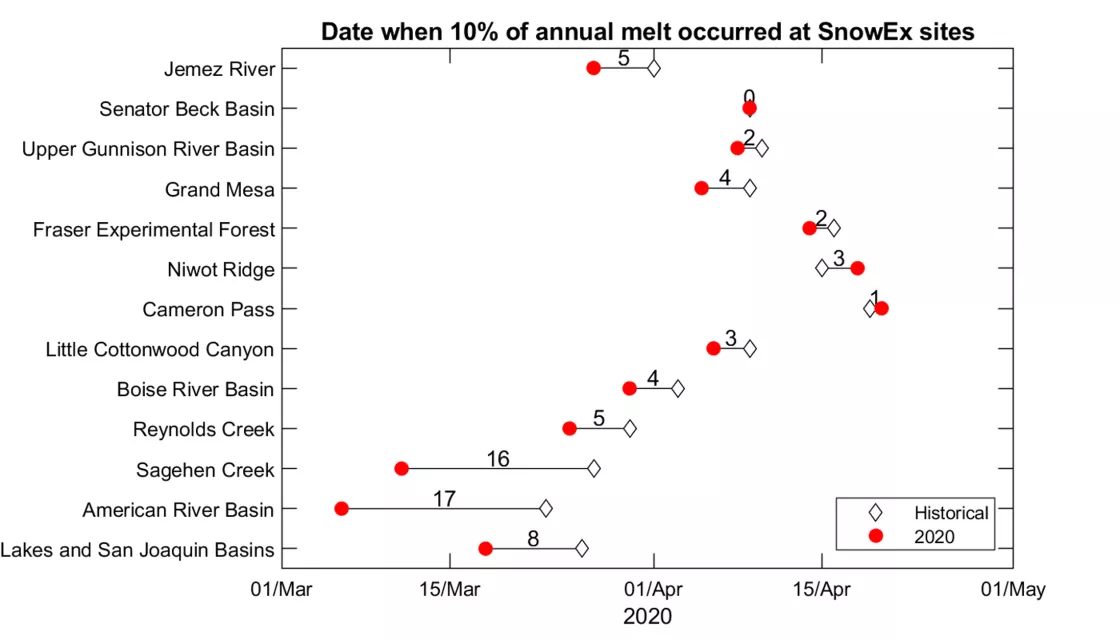
Field campaigns like SnowEx are interested in the timing of melting conditions. Snowmelt can occur in response to seasonal decreases in snow albedo, or how much solar radiation is reflected. Snowmelt is also associated with wet snow conditions that present a challenge to sensors that characterize snow based on microwave radiation (both passive and active radar techniques, such as UAVSAR). The SWE monitoring stations used in these analyses do not provide direct information on snow albedo or when wet snow conditions are present. However, losses in SWE can be inferred from snowmelt, and snowmelt progression can be tracked through the year. At the beginning of winter when a snowpack builds, the cumulative melt is 0 percent of the total annual melt. When that snowpack disappears in spring or summer, the cumulative melt is 100 percent of the total annual melt. This transition from primarily accumulating to primarily melting can be represented by a specific date when a certain percentage of snowmelt has been reached. Taking a modest 10 percent of the annual snowmelt, the timing of melt can be compared in 2020 with the historical average at the SnowEx sites (Figure 6). A lower threshold like 5 percent might be too sensitive to noise in the data at the snow sites, while a higher threshold like 25 percent might be too advanced in the melt season to represent the onset of melt conditions. The total melt in 2020 can be estimated by adding current melt plus future melt, based on remaining SWE, at the end of April.
At many SnowEx sites, earlier than average snowmelt characterized 2020, and presumably, earlier than average wet snow conditions (Figure 6). The date that the areas reached the 10 percent annual melt threshold varied from as many as eight to seventeen days early in the Sierra sites (Lakes and San Joaquin, Sagehen, and American), four to five days early in the Idaho Sites (Boise River and Reynolds), three days early at the Utah site (Little Cottonwood), and five days early at the New Mexico site (Jemez). Three of the Colorado sites (Upper Gunnison, Grand Mesa, and Fraser) showed melt early by two to four days while the other three Colorado sites showed either average melt timing (Senator Beck) or melt later than average by one to three days (Cameron and Niwot Ridge). Note that the analysis based on SWE melt (Figure 6) has some differences than the one based on snow cover depletion (Figure 5), which may be attributed to differences in the sensing area of each measurement (areal snow cover vs. snow water at point locations) as well as differences in how melt timing is inferred from each variable. The timing of wet snow initiation at these sites is certainly earlier than either of the analyses show. However, the analyses highlight the melt timing seen in 2020 and provide a benchmark for future planning in the upcoming 2020 to 2021 snow year.
References
Rittger, K., M. S. Raleigh, J. Dozier, A. F. Hill, J. A. Lutz, and T. H. Painter. 2019. Canopy Adjustment and Improved Cloud Detection for Remotely Sensed Snow Cover Mapping. Water Resources Research 24 August 2019. doi:10.1029/2019WR024914.
