Throughout August 2025, sea ice rapidly melted and compacted north of Alaska in the Beaufort Sea, initiated by a warm pulse of air from east Siberia that was sustained by persistent winds from the southwest. However, the overall pace of decline for the month was near average. Antarctic sea ice climbed in August but remained well below average, ending at third lowest extent.
Overview of conditions
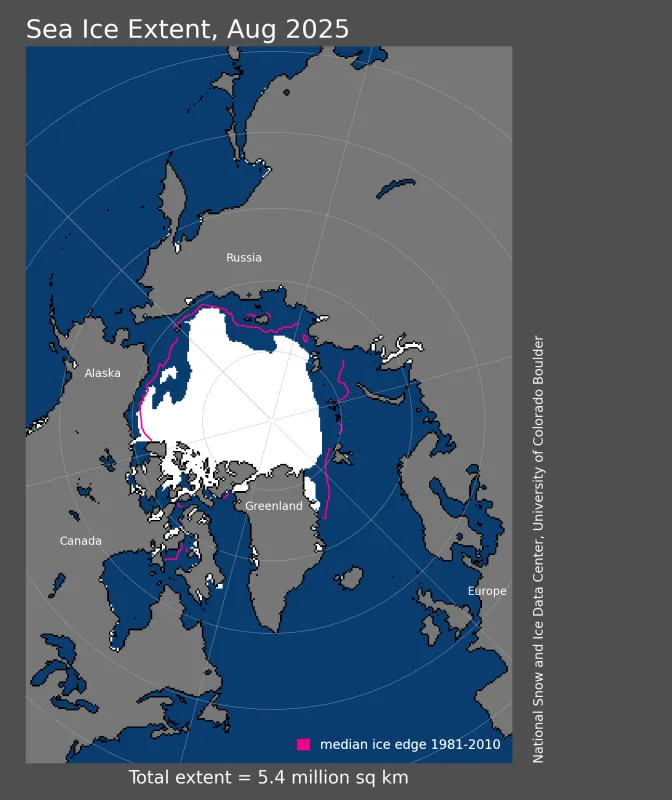
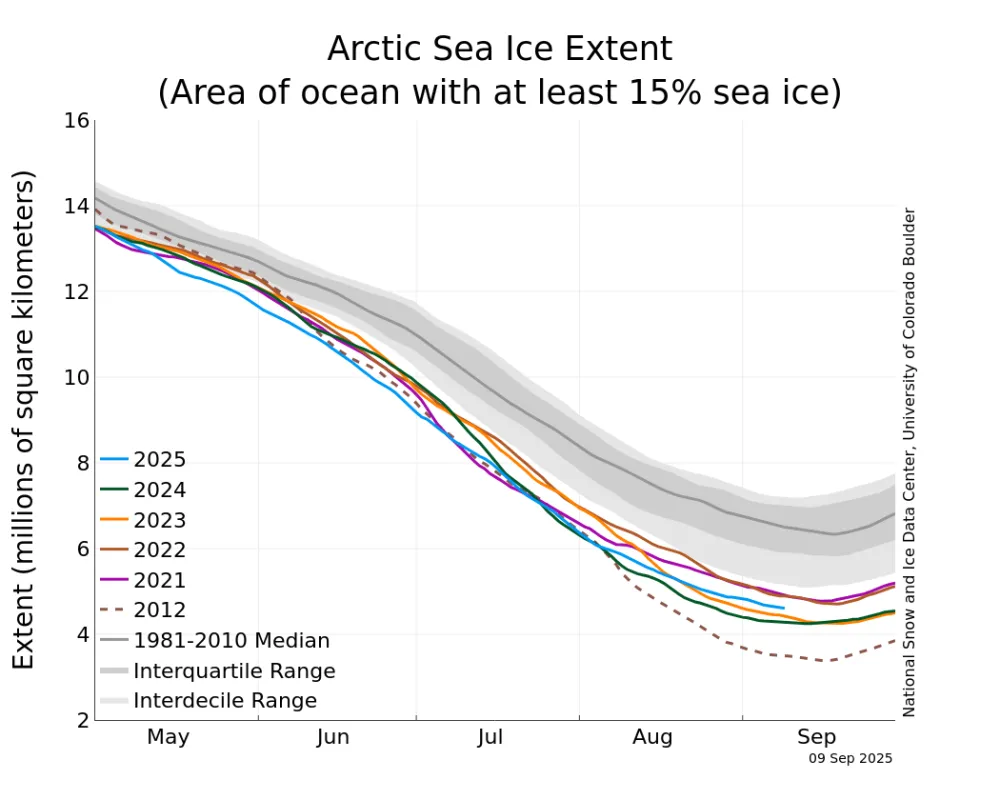
Arctic sea ice extent for August 2025 averaged 5.41 million square kilometers (2.09 million square miles), the seventh lowest in the satellite record (Figure 1a). This monthly average extent was 690,000 square kilometers (266,000 square miles) above the satellite record low set in 2012 (Figure 1b). Sea ice extent was far below average in the Kara, Laptev, and Beaufort Seas, although small areas of the East Siberian Sea had near-average conditions. In the channels of the Canadian Archipelago, there was low ice extent in the southern (Amundsen’s) Northwest Passage route, but heavy ice cover blocked M’Clure Strait, the west end of the deepwater northern route. The Northern Sea Route is essentially ice free, although Russian icebreakers still accompany vessels as a standard practice. Overall, sea ice concentration—or the precent of ice cover—has been below average throughout the month. Rapid sea ice loss north of Alaska resulted in a "bite" taken out of the Beaufort Sea ice cover (Figure 1c). Sea ice can be compacted rapidly by winds, even after surface and ocean-driven melting of sea ice ends.
Figure 1a. Arctic sea ice extent for August 2025 was 5.41 million square kilometers (2.09 million square miles). The magenta line shows the 1981 to 2010 average extent for that month. Sea Ice Index data. About the data — Credit: National Snow and Ice Data Center
Figure 1b. The graph above shows Arctic sea ice extent as of September 9, 2025, along with daily ice extent data for four previous years and the record low year. 2025 is shown in blue, 2024 in green, 2023 in orange, 2022 in brown, 2021 in magenta, and 2012 in dashed brown. The 1981 to 2010 median is in dark gray. The gray areas around the median line show the interquartile and interdecile ranges of the data. Sea Ice Index data. — Credit: National Snow and Ice Data Center
Conditions in context
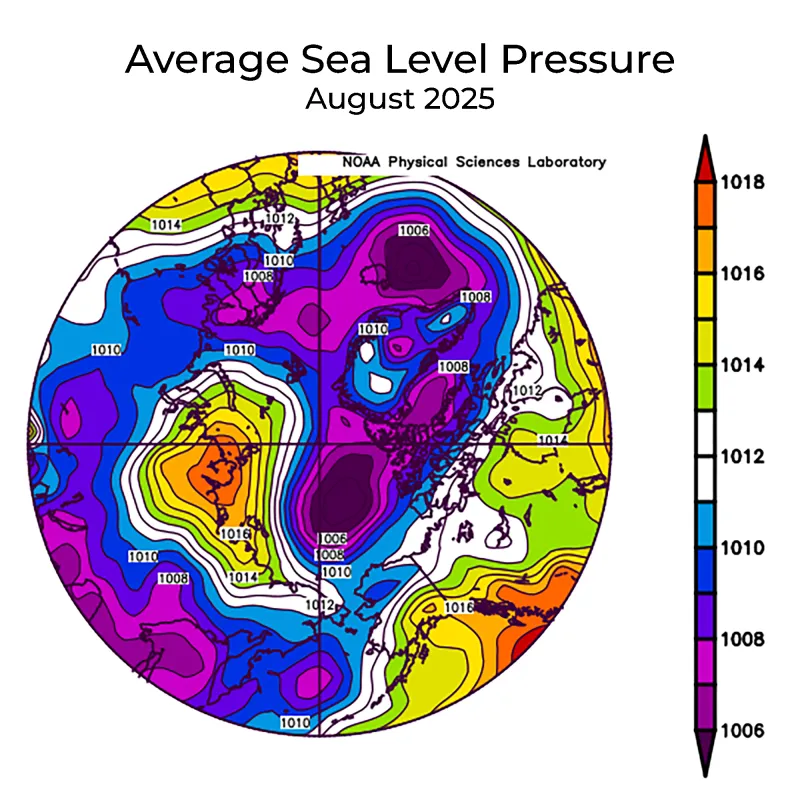
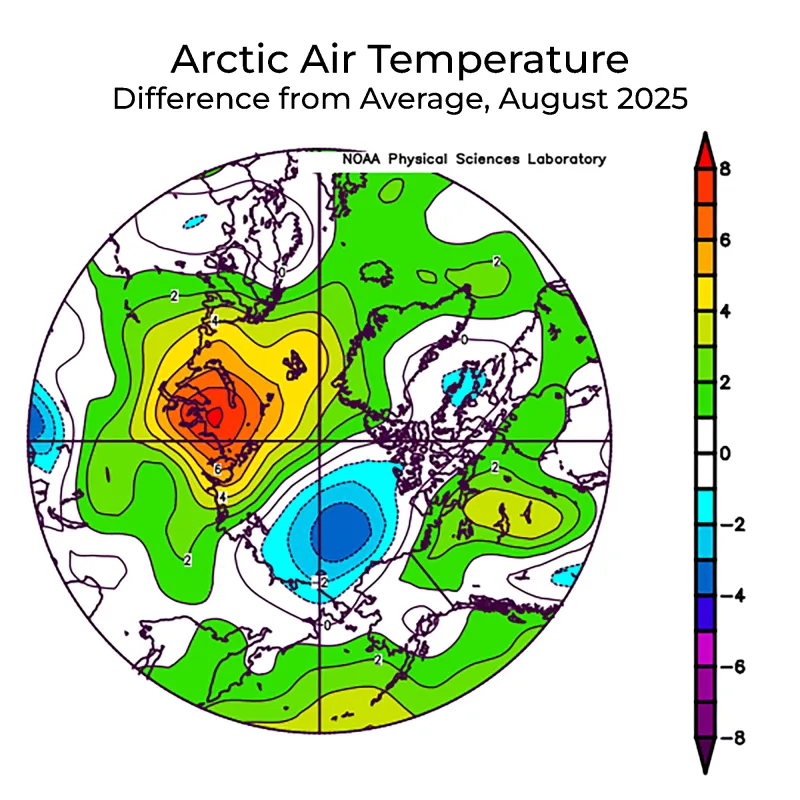
Low sea level pressure dominated the central and western Arctic and the far northern Atlantic Ocean, supporting strong winds from the southwest over the southern Beaufort Sea (Figure 2a). This helped drive low sea ice concentration over much of the Arctic Ocean. An area of high air pressure spanned much of the Siberian coast, centered on the Taymyr Peninsula. These conditions likely reduced export of ice through Fram Strait, and indeed the ice edge in the East Greenland Sea, Barents, and Kara Seas remained largely unchanged through the month. Air temperatures at the 925 millibar level (about 2,500 feet altitude) were 5 to 7 degrees Celsius (9 to 13 degrees Fahrenheit) above average in the high air pressure area and 2 to 4 degrees Celsius (4 to 7 degrees Fahrenheit) below average over the Beaufort Sea (Figure 2b). Much of the rest of the Arctic had near-average temperatures for the month.
Figure 2a. This plot shows average sea level pressure in the Arctic in millibars for August 2025. Yellows and reds indicate high air pressure; blues and purples indicate low pressure. — Credit: NSIDC courtesy NOAA Earth System Research Laboratory Physical Sciences Laboratory
Figure 2b. This plot shows the departure from average air temperature in the Arctic at the 925 hPa level, in degrees Celsius, for August 2025. Yellows and reds indicate above average temperatures; blues and purples indicate below average temperatures. — Credit: NSIDC courtesy NOAA Earth System Research Laboratory Physical Sciences Laboratory
August 2025 compared to previous years
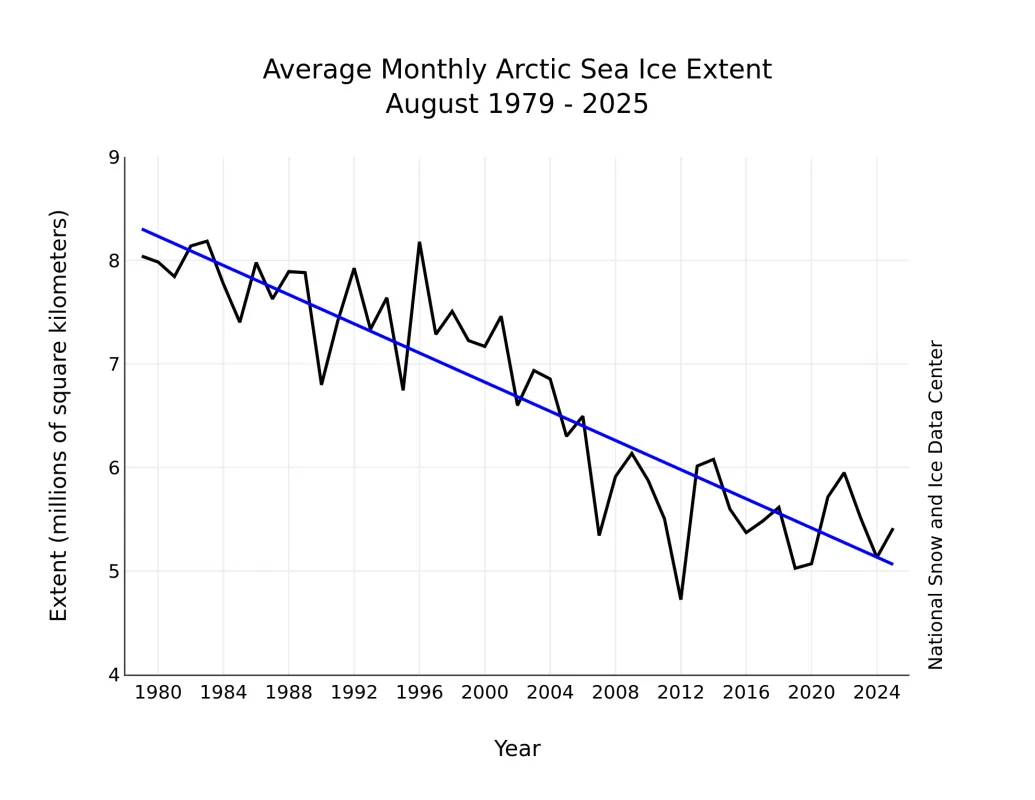
The downward linear trend in Arctic sea ice extent through 2025 for August is 70,500 square kilometers (27,200 square miles) per year or 9.8 percent per decade relative to the 1981 to 2010 average (Figure 3). Based on the linear trend, since 1979, August has lost 3.24 million square kilometers (1.25 million square miles) of sea ice. This is equivalent to nearly twice the size of Alaska.
Northwest Passage
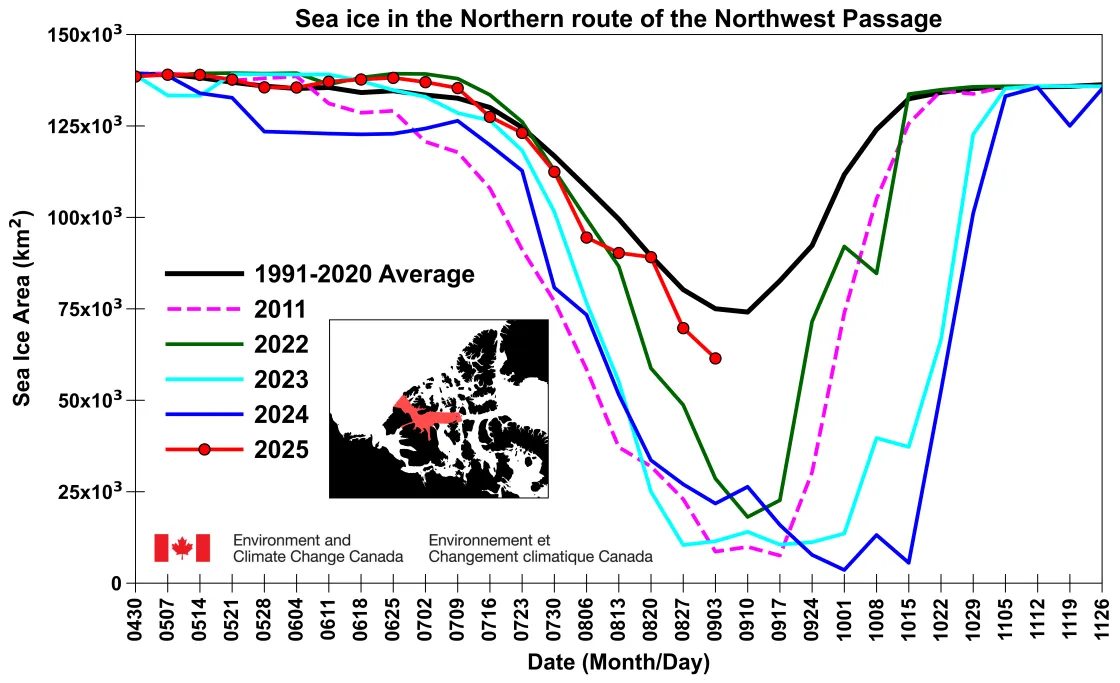
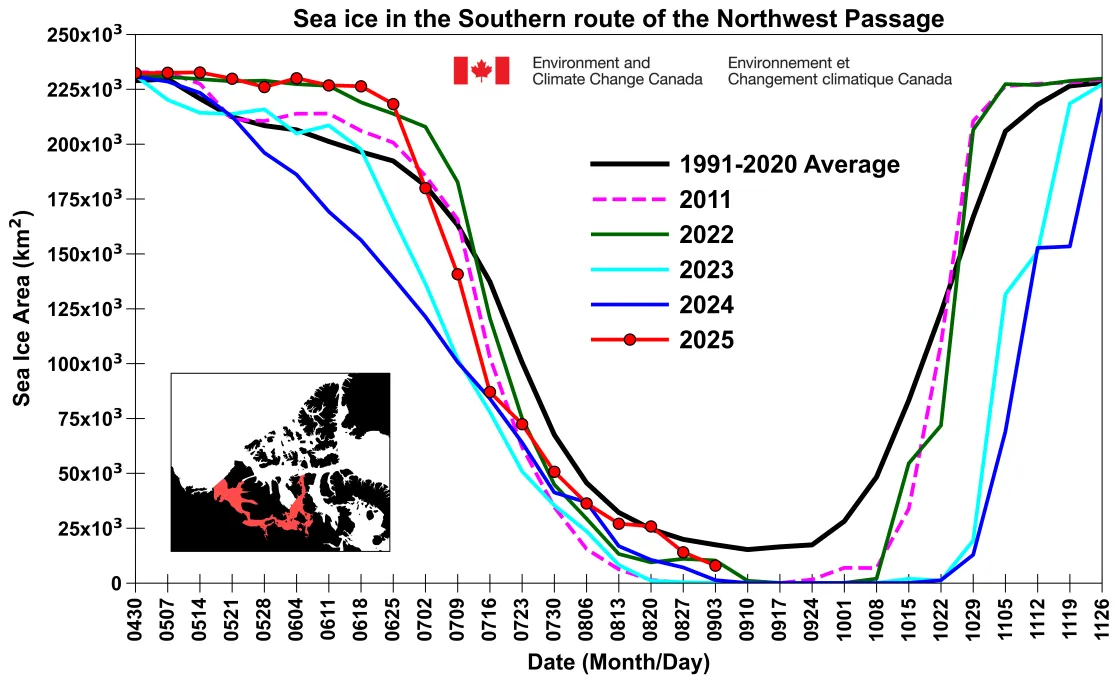
Sea ice area this year is below the 1991-to-2020 average in both the northern and southern Northwest Passage (NWP) routes but is not near last year's record low (Figure 4a and 4b). Amundsen’s southern route, through shallow and sometimes narrow channels, appears to be mostly ice free. Ice area in the wider and deeper northern route dropped substantially after reaching near average area in mid-August. However, considerable ice remains, particularly in M’Clure Strait on the western end. Last year, ice cleared late—in early October—in the northern route dropping the area to record low levels; the entire route was nearly ice free by then. This year, even with some late melt out of ice, it will not be near a record low minimum area in the NWP.
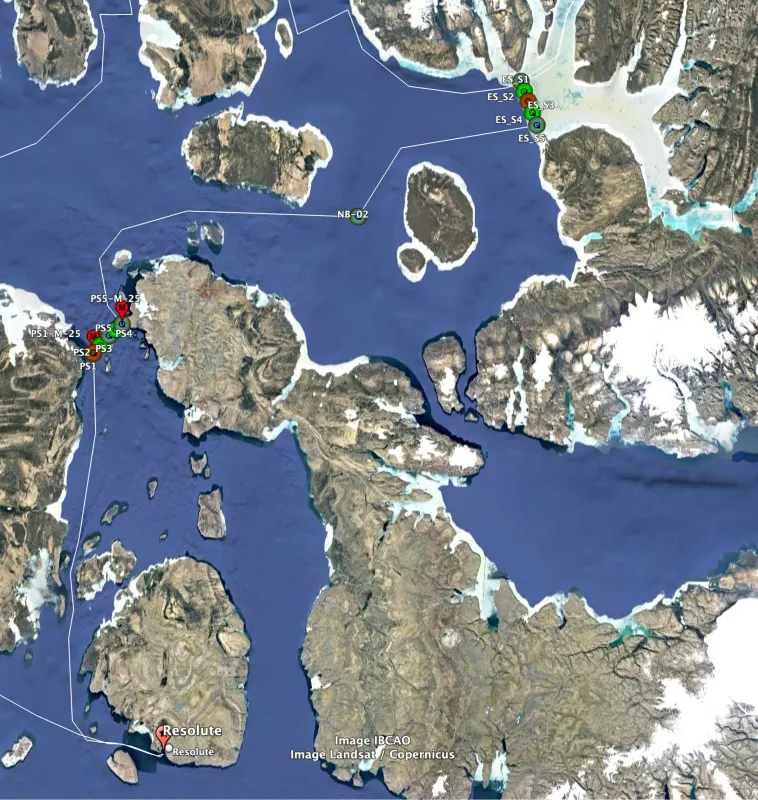
Currently, NSIDC scientist Julienne Stroeve is traveling on the Canadian Coast Guard icebreaker Amundsen through the Queen Elizabeth Islands, crossing areas not yet charted for bathymetry. The ship left Resolute, Nunavut, on September 4, and despite having to divert twice for rescue observations back towards Resolute, is currently on its way to Eureka Sound. By September 10, the ship will reach the landfast ice located in Nansen Sound where the sea ice team will begin their on-ice field work. The team will deploy three ice mass balance buoys on multiyear ice floes to assess melt and growth processes of the last vestiges of old, thick ice in the region.
Arctic Ocean temperature
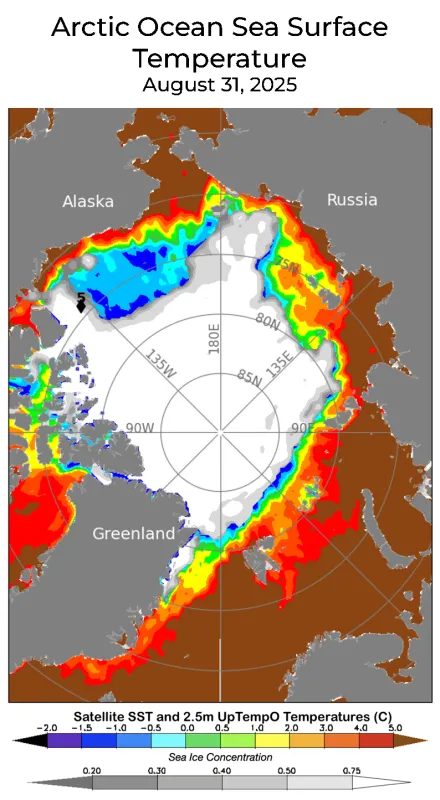
A large area of open water developed in the central Beaufort Sea during the last two weeks of August, characterized by low sea surface temperatures (SST). This rapid opening likely resulted from strong winds from the southwest associated with a series of storms, melting ice in two ways. Initially, warm air blew in from the south and melted ice floes from the top. Later, a warm, shallow ocean layer—that had absorbed solar energy between ice floes and through thin ice—melted sea ice from the bottom. Note the large area of open water at around 1 degree Celsius (33 degrees Fahrenheit), which is higher than the freezing point of sea water at -1.6 degrees Celsius (29 degrees Fahrenheit) (Figure 5). Although sea ice concentration was relatively low in the area of rapid ice loss, little new compaction occurred along the downwind edges (to the north and east in the opening) of the expanding feature. This suggests that the primary cause of the rapid retreat was wind-enhanced air and ocean melting of thin, distributed ice, rather than pushing the ice laterally.
Elsewhere over the Arctic Ocean, SSTs tend to be linked to the length of time that waters were ice free. Areas of early openings such as in the Chukchi, Laptev, and Kara Seas have SSTs higher than 5 degrees Celsius (41 degrees Fahrenheit). Northern Baffin Bay became ice free very early this year, resulting in SSTs of 4 degrees Celsius (39 degrees Fahrenheit) by the end of August.
With continued warming, some areas of the Arctic will begin to open very early in the sunlit season and will have most of the summer to absorb solar energy. At this point, clouds will become an important indicator for determining Arctic Ocean temperatures by the end of the melt season. A paper written by several colleagues details this trend.
Antarctic sea ice
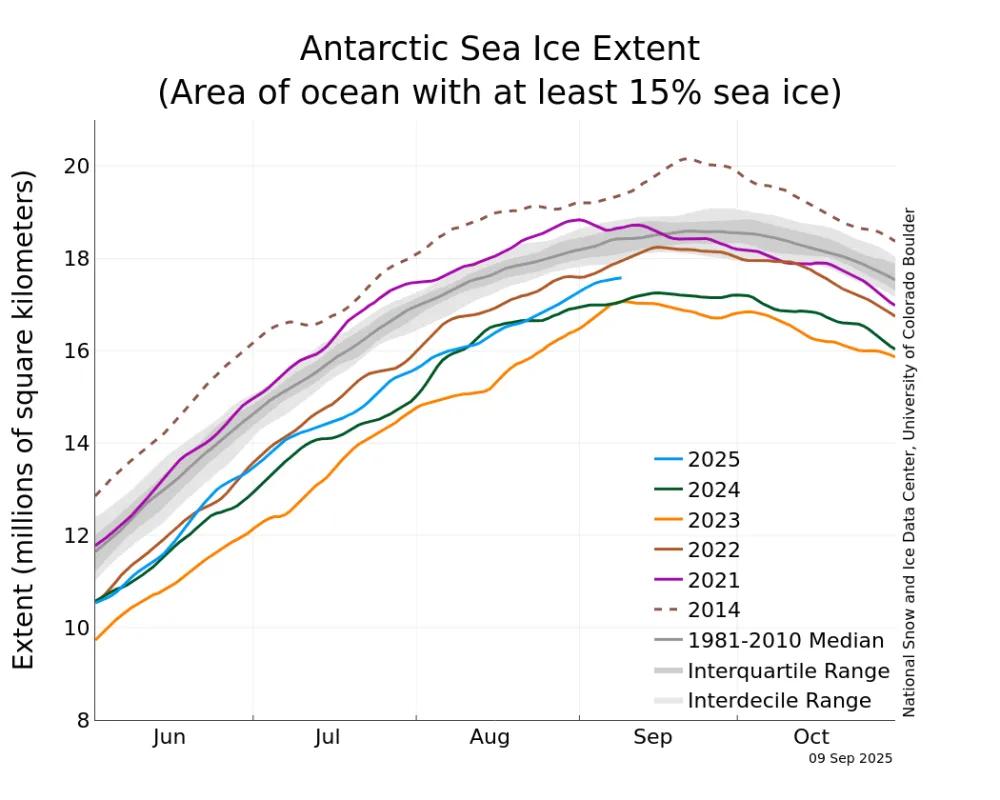
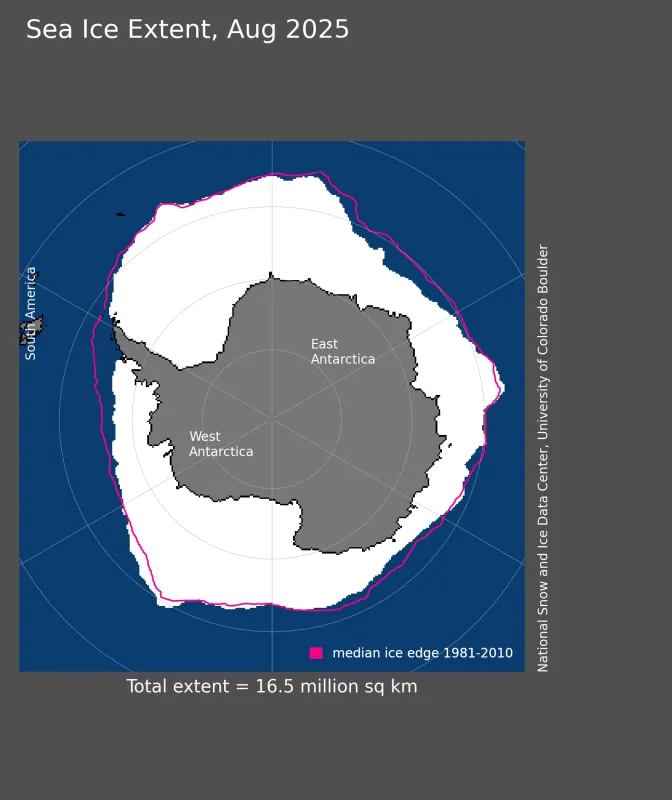
Sea ice in the Southern Hemisphere is rising toward its annual maximum, which generally occurs in late September to early October. This year's ice extent has already surpassed the annual maximum for the two lowest years on record, 2023 and 2024, but it is still tracking at third lowest in the satellite record (Figure 6a). As has been the case for the entire winter season, extent is very low in the Bellingshausen Sea off the west coast of the Antarctic Peninsula and the Cosmonaut Sea in the southwest Indian Ocean (Figure 6b). A somewhat smaller deficit is present south of Australia, but as of now there is slightly above average sea ice in the Ross Sea.
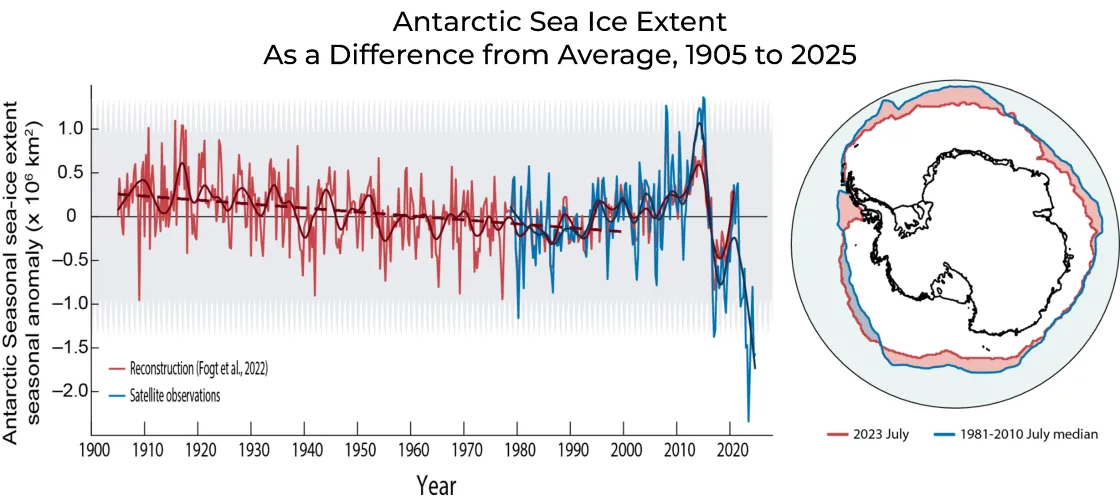
A new paper by Nerelie Abram and others identified several rapidly-evolving aspects of the Antarctic climate-ice-ocean system, including sea ice, ocean overturning circulation, and ice sheet losses that are emerging as ocean warming and changing wind patterns slowly reshape the continent and surrounding seas. Antarctic sea ice has undergone a dramatic decrease beginning in 2016, far exceeding the range of variability in the preceding four decades of satellite measurement, or the past century as far as proxy records can determine (Figure 6c). The recent decline is attributed to an amplifying cycle of early retreat and solar heat uptake by the ocean, slowing re-growth later in the annual cycle. Earlier papers attributed the initiation of this cycle to the import of warmer ocean water from the north and greater upward mixing of the warmer upper ocean into the near-surface polar ocean layer. The production of cold, dense water near the Antarctic coast, which drives the global Antarctic Overturning Circulation, also appears to be on the decline. Higher air temperatures and more ocean exposure near the Antarctic coast appear to be reducing the production of Antarctic bottom water, threatening to slow this fundamental ocean circulation driver. Lastly, changing winds and their effects on ocean circulation near the continental shelf edge appear to be pushing more warm mid-depth ocean water onto the continental shelf. Deep glacier outflow areas in several places around the continent, notably in the Amundsen Sea Embayment, are being eroded by this thicker layer of warm deep water. This has led to significant glacier retreat and acceleration. Some glaciers have a basin configuration that can lead to a continuing ice loss even in the absence of further warming and forcing, if a critical tipping point is reached. As the planet warms, all of these potentially disruptive tipping points are more likely to be breached.
Figure 6a. The graph above shows Antarctic sea ice extent as of September 9, 2025, along with daily ice extent data for four previous years and the record high year. 2025 is shown in blue, 2024 in green, 2023 in orange, 2022 in brown, 2021 in magenta, and 2014 in dashed brown. The 1981 to 2010 median is in dark gray. The gray areas around the median line show the interquartile and interdecile ranges of the data. Sea Ice Index data. — Credit: National Snow and Ice Data Center
Figure 6b. Antarctic sea ice extent for August 2025, was 16.47 million square kilometers (6.36 million square miles). The orange line shows the 1981 to 2010 average extent for that day. Sea Ice Index data. About the data — Credit: National Snow and Ice Data Center
Reference
Abram, N. J., A. Purich, M. H. England, et al. 2025. Emerging evidence of abrupt changes in the Antarctic environment. Nature, 644, 621–633. doi:10.1038/s41586-025-09349-5.
Fogt, R. L., A. M. Sleinkofer, M. N. Raphael, and M. S. Handcock. 2022. A regime shift in seasonal total Antarctic sea ice extent in the twentieth century. Nature Climate Change, 12(1), 54-62, doi:10.1038/s41558-021-01254-9.
Purich, A. and E. W. Doddridge. 2023. Record low Antarctic sea ice coverage indicates a new sea ice state. Communications Earth & Environment, 4(1), 314, doi:10.1038/s43247-023-00961-9.
Sledd, A., T. S. L’Ecuyer, J. E. Kay, and M. Steele. 2023. Clouds increasingly influence Arctic sea surface temperatures as CO2 rises. Geophysical Research Letters, 50(8), p.e2023GL102850, doi:10.1029/2023GL102850.
