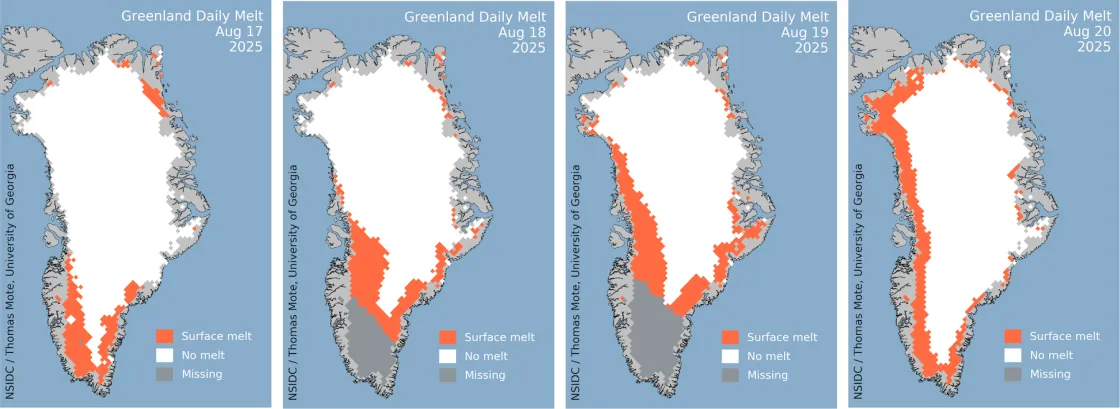
A strong and persistent melt event occurred in southern Greenland in mid-August 2025, preceded by extensive rain in the same area. Snowfall following the rain events covered the lower elevation bare ice areas along the western side, brightening the surface again. Overall, Greenland’s 2025 melt season appears to be moderately intense. Persistent data gaps from the satellite data source resulted in an underestimation of the 2025 melt area. This post also reviews the impacts of rain on snow on the ice sheet.
Overview of conditions
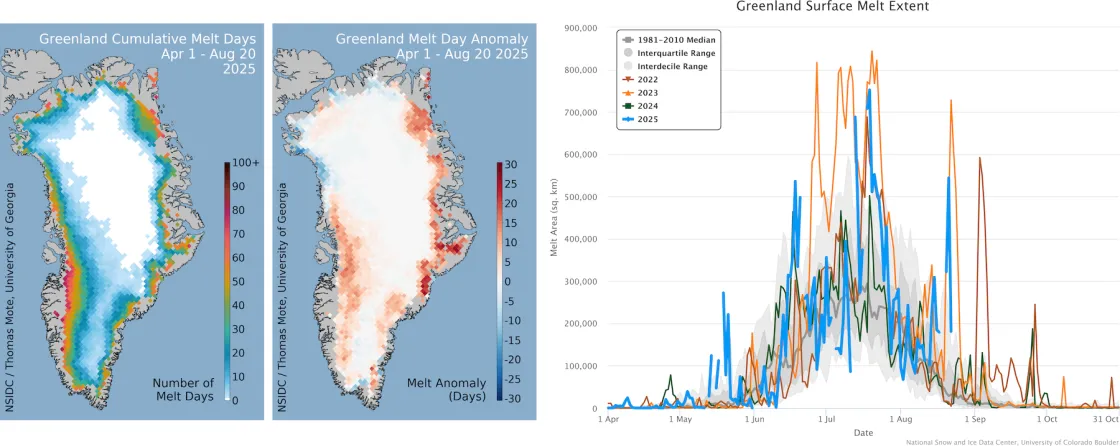
The daily areal extent of melting abated to near-average levels in late July and early August, and then increased on August 14 as a series of warm fronts from the southwest reached the island (Figure 1a). The warm fronts pushed daily melt area on August 21 to over 540,000 square kilometers (about 210,000 square miles), a record for that date. The ice sheet’s southern dome, including its western and eastern coasts, melted repeatedly during this period. Meltwater runoff has been well above average. However, the total loss of mass from the ice sheet—calculated as snow and rain accumulation minus evaporation and melt runoff—is only about 50 billion tons at this point, far below the 300 billion tons of peak years such as 2023, 2019, and 2012.
As of August 20, the 2025 Greenland melt season was nineteenth in the 47-year satellite record in overall cumulative daily melt area extent, although gaps in our satellite data are likely causing an underestimating the value (Figure 1b).
Conditions in context
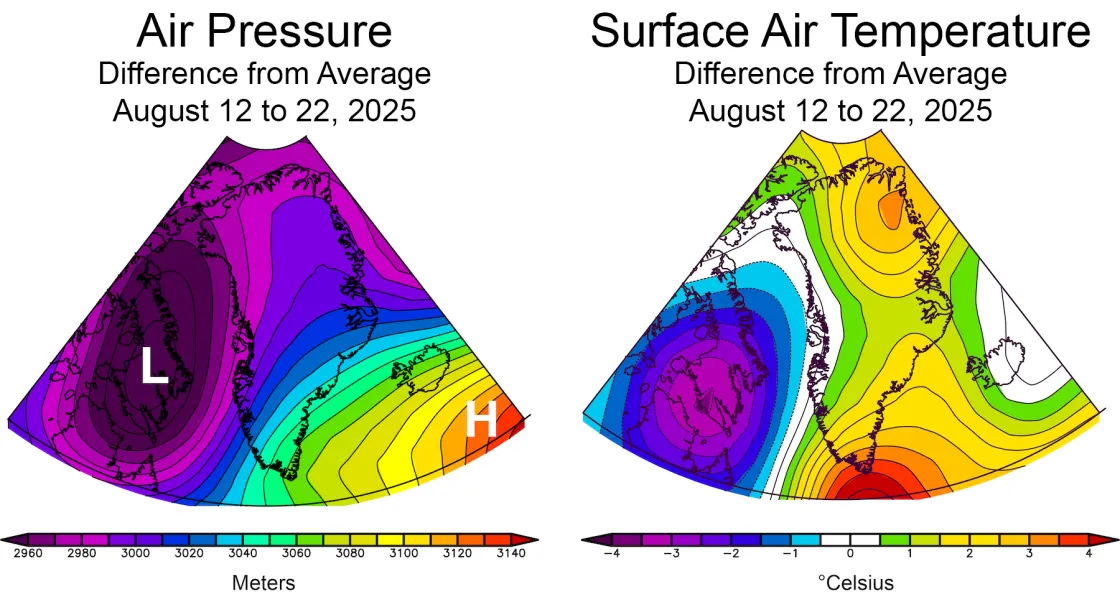
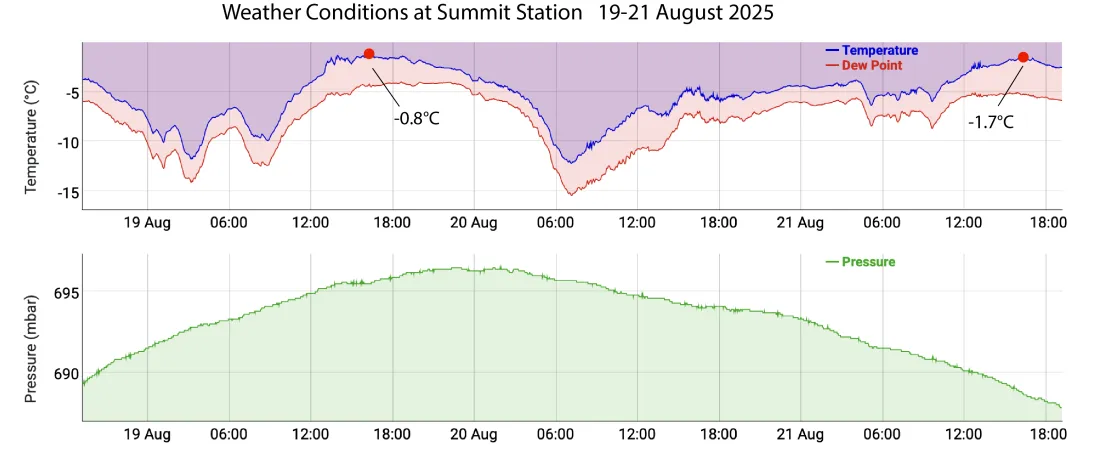
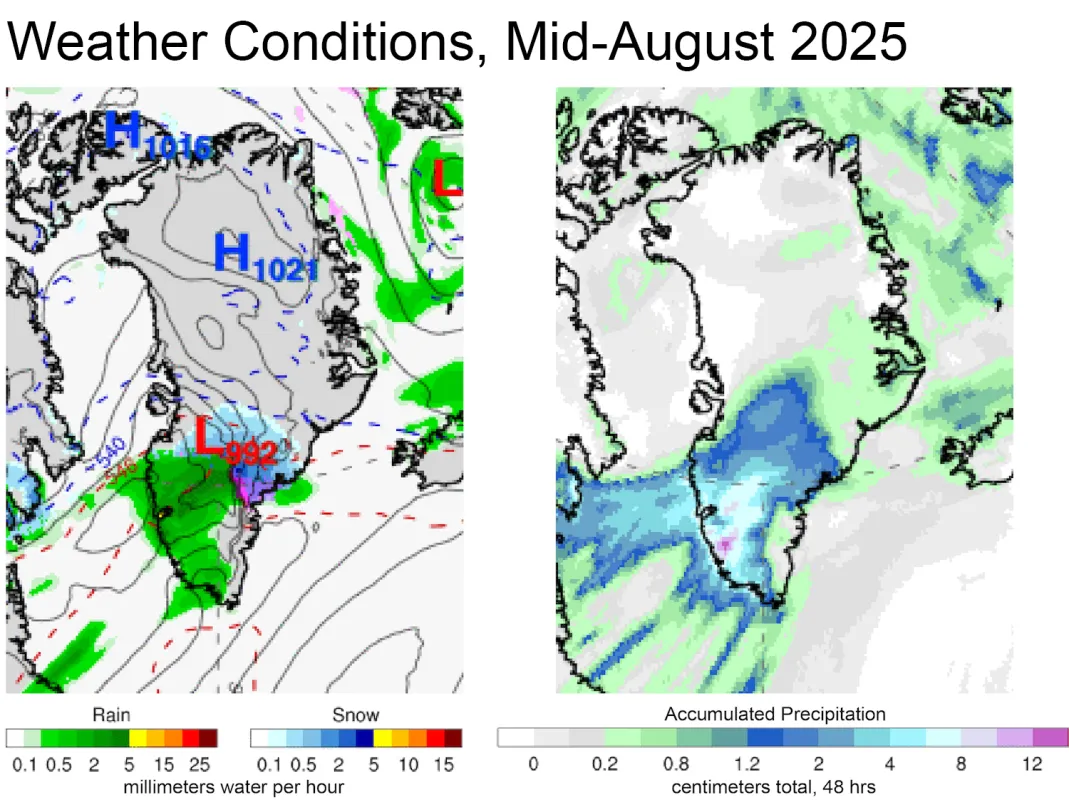
Temperatures over the Greenland Ice Sheet from August 14 to August 22 were above average over the ice sheet, peaking at 3 degrees Celsius (5 degrees Fahrenheit) above average, across the northeast and the southern portion of the ice sheet (Figure 2a). Winds from the south and southwest drove these conditions, as high pressure east of Iceland and a persistent low pressure over Baffin Island pumped air from eastern Canada to the ice sheet (Figure 2a). At the Summit Station, near the highest point on the ice sheet, the National Oceanic and Atmospheric Administration (NOAA) recorded temperatures that repeatedly approached the melting point through this period but did not exceed it. The warmest day at Summit was August 19, when early afternoon temperatures reached -0.8 degrees Celsius (about 30.6 degrees Fahrenheit) (Figure 2b).
Greenland’s melt season has been above average across nearly the entire ice sheet, the exception being the far northern edge of the ice where temperatures have been near average. Temperatures in the south were up to 1 degree Celsius (34 degrees Fahrenheit) above average from June to August 22, 2025.
Rain o’er me
As the low air pressure center and warm front pushed onto the Greenland coast, an intense rain event in the south coincided with the strong melting as detected by satellite microwave sensing. Weather forecast models indicated areas with 2 to 5 millimeters (0.08 to 0.2 inches) of rain per hour above Nuuk, Greenland’s capital, on the southwestern coast. The forecasted precipitation totals in the 48 hours beginning on August 14 were as much as 8 to 12 centimeters (3 to 4.7 inches) (Figure 3a). Further north and east, the precipitation fell as sleet or freezing rain, and snow. A similar, though less intense, rain forecast accompanied the earlier mid-July melt event, situated more in the west-central portion of the ice sheet.
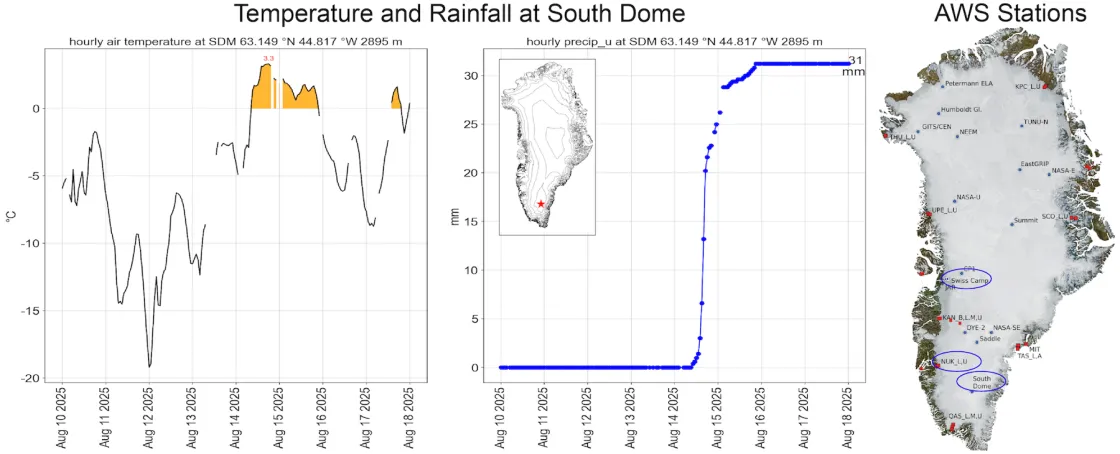
Substantial rainfall reached the South Dome (SDM) weather station at an elevation of 2,895 meters (9,498 feet) above sea level, with more than 30 millimeters (1 inch) recorded at the SDM weather station on August 14 and 15, per Denmark’s Programme for Monitoring of the Greenland Ice Sheet (PROMICE) (Figure 3b). This is an exceptional amount of rain at this altitude. A similar amount of rain, 29 millimeters (1.14 inches) over August 14 and 15, was also recorded above Nuuk at the NUK_U weather station, at an elevation of 1,122 meters (3,680 feet). In later warm-front pulses during the melt event, the weather station at Swiss Camp recorded 4 millimeters (0.16 inches) of rain on August 18. Earlier, the Swiss Camp station recorded 10 millimeters (0.4 inches) of rain during the mid-July melt event. The first important rain event observed at Summit Station occurred on August 14, 2021. Both rain and surface melting occurred at the same location.
Rain on the Greenland Ice Sheet is nothing to sing about
Both rain and the weather conditions that accompany it heat the ice sheet. Rain falling on bare ice runs off to streams or fills lakes, and erodes snow or ice as it flows over the surface.
Liquid water, even at the freezing point, 0 degrees Celsius (32 degrees Fahrenheit), has a considerable heat content. The transition from liquid to solid requires removing 80 calories of heat* per gram of water–or, put another way, going from liquid water to frozen ice requires removing enough heat to raise the temperature of the same amount of water by 80 degrees Celsius (144 degrees Fahrenheit). (A heat calorie is not the same as a food calorie; a food calorie is 1,000 heat calories.) However, in a typical rain event on snow, much of that heat is lost to the atmosphere. Only in cases of larger rain events onto a sub-freezing surface, may the liquid water seep into the snowpack to warm the snow at depth.
Earlier studies have also shown that the main heat source of rain conditions comes from low and warm clouds. Warm clouds radiate heat to the surface, transferring energy in addition to the heat from the rain falls. As heat warms snow grains, they transform from jagged to rounded, leading to snow grains that are less reflective. So, after the snow surface has refrozen, rounded snow grains absorb more sunlight when sunny conditions follow.
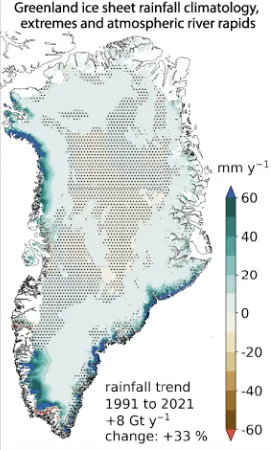
The July post reviewed the impacts of rain on the Arctic and its changing seasonality. Rain is much less common on the Greenland Ice Sheet than other areas of the Arctic, but it is increasing. In large part this is because of an increase in the delivery of moisture and heat (both as rain and warm snow events) through atmospheric rivers, or intense moisture-laden bands associated with strong weather fronts.
Reflecting on rapid changes
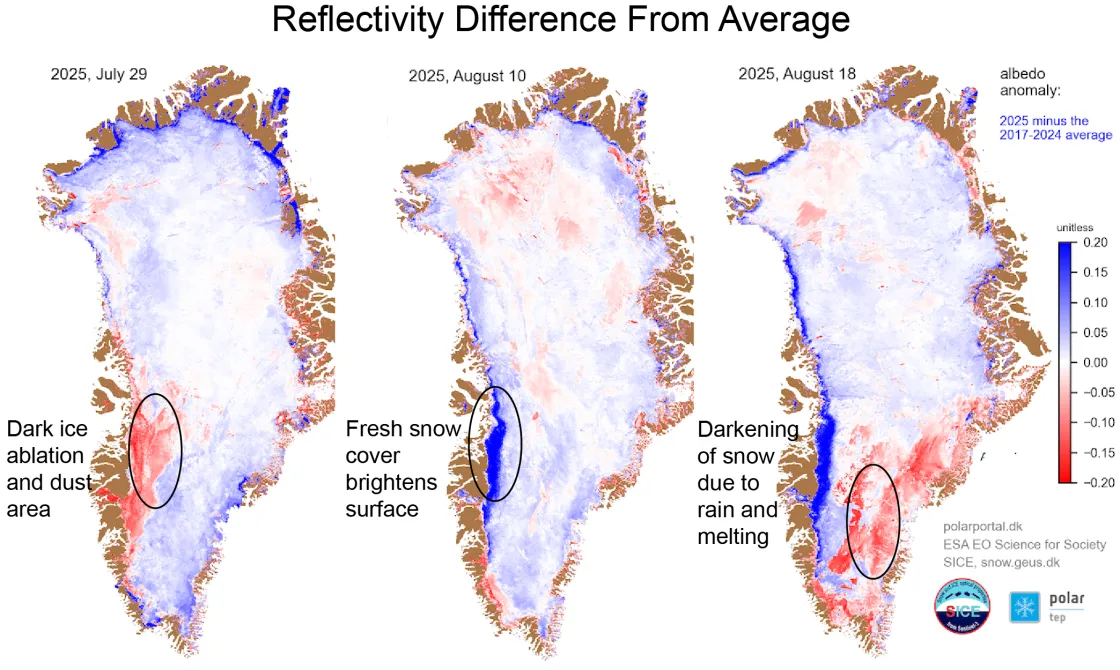
The reflectivity of the ice sheet has changed sharply this late in summer of 2025 when snow fell after the melt and rain events, followed by further melting and rain. Old, bare ice areas along the western edge of the ice sheet, known as the ablation zone, create a dark band on the surface when exposed. Dust and algae growth can compound its already dark color. The dark band melts faster by absorbing more solar radiation. However, a thin cover of snow dramatically increased the reflectivity in mid-August, suppressing melt temporarily.
This sequence is well illustrated by a set of reflectivity maps of the Greenland Ice Sheet spanning late July to mid-August. Weather modelling (MARv3.14.2) indicates ablation on the western flank in late July, followed by snowfall on August 6 to 13, followed by a sequence of heavy rain, melting, light snow and then further melting over August 14 to 18.
Wildfire smoke reaches Greenland’s coast
Smoke from fires in western North America was observed over central western Greenland. Studies of past widespread melt events have shown that soot on the snow of the upper ice sheet can augment melting. Soot concentrations were associated with the past extreme melt events of 2012 and 1889, as determined from ice core analysis.
Further reading
Box, J.E., K.P. Nielsen, X. Yang, M. Niwano, A. Wehrlé, D. van As, X. Fettweis, M.A.Ø. Køltzow, B. Palmason, R.S. Fausto, M.R. van den Broeke, B. Huai, A.P. Ahlstrøm, K. Langley, A. Dachauer, and B. Noël. 2023. Greenland ice sheet rainfall climatology, extremes and atmospheric river rapids. Meteorological Applications 30:2134, doi:10.1002/met.2134.
Box, J.E., A. Wehrlé, D. van As, R.S. Fausto, K.K. Kjeldsen, A. Dachauer, A.P. Ahlstrøm, and G. Picard. 2022. Greenland ice sheet rainfall, heat and albedo feedback impacts from the mid‐august 2021 atmospheric river. Geophysical Research Letters 49, doi:10.1029/2021gl097356.
Keegan, K.M., M.R. Albert, J.R. McConnell, and I. Baker. 2014. Climate change and forest fires synergistically drive widespread melt events of the Greenland Ice Sheet. Proceedings of the National Academy of Sciences 111(22): 7964-7967, doi:10.1073/pnas.1405397111.
Neff, W. 2018. Atmospheric rivers melt Greenland. Nature Climate Change. 8(10): 857-858, doi:10.1038/s41558-018-0297-4.
Greenland automated weather station data, maintained by the Greenland Survey of Denmark: https://thredds.geus.dk/thredds/catalog/catalog.html
Promice GC-Net. Accessed August 27, 2025.
