At the end of July 2025, daily sea ice extent in both hemispheres ranked third lowest in the 47-year satellite record. For most of the month, Arctic sea ice extent tracked close to levels recorded for 2012, the record-low-September year. July 2025 ended the month at fourth lowest on record, slightly surpassing July 2012. Although 2012 experienced the lowest September extent in the satellite record, the July 2012 monthly extent was only the fifth lowest. As of early August, the Northern Sea Route is nearly clear of ice, and Amundsen’s Northwest Passage path through the Canadian Archipelago also has many open water areas. A large area of low concentration ice in the Beaufort Sea seems to be quickly melting. Data gaps in the Special Sensor Microwave Imager/Sounder (SSMIS) time series persisted for multiple days in some areas, but our interpolation scheme continued to provide a reasonable tracking of sea ice extent through July. However, due to the data gaps, as of July 31, 2025, NSIDC has shifted to using the Japan Aerospace Exploration Agency (JAXA) Advanced Microwave Scanning Radiometer 2 (AMSR2) sensor for the sea ice time series.
Overview of conditions
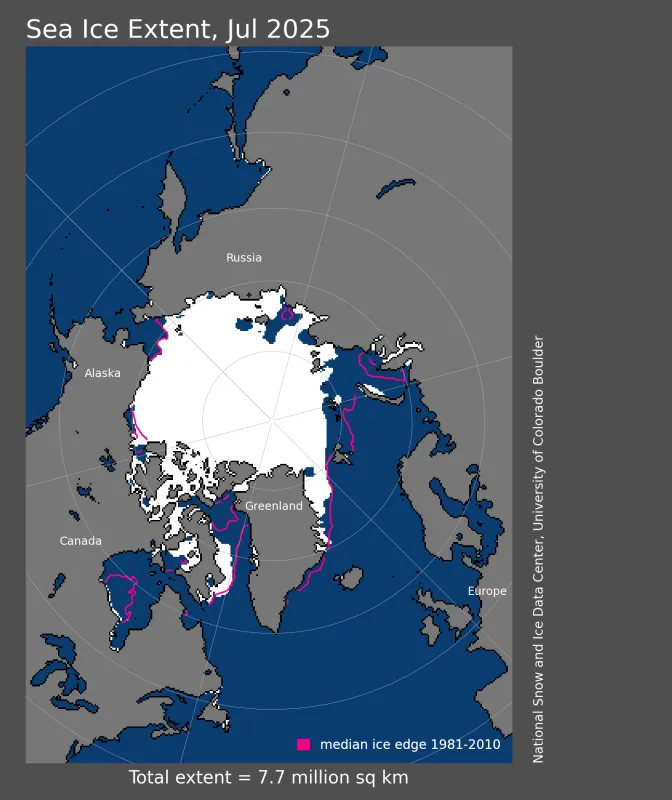
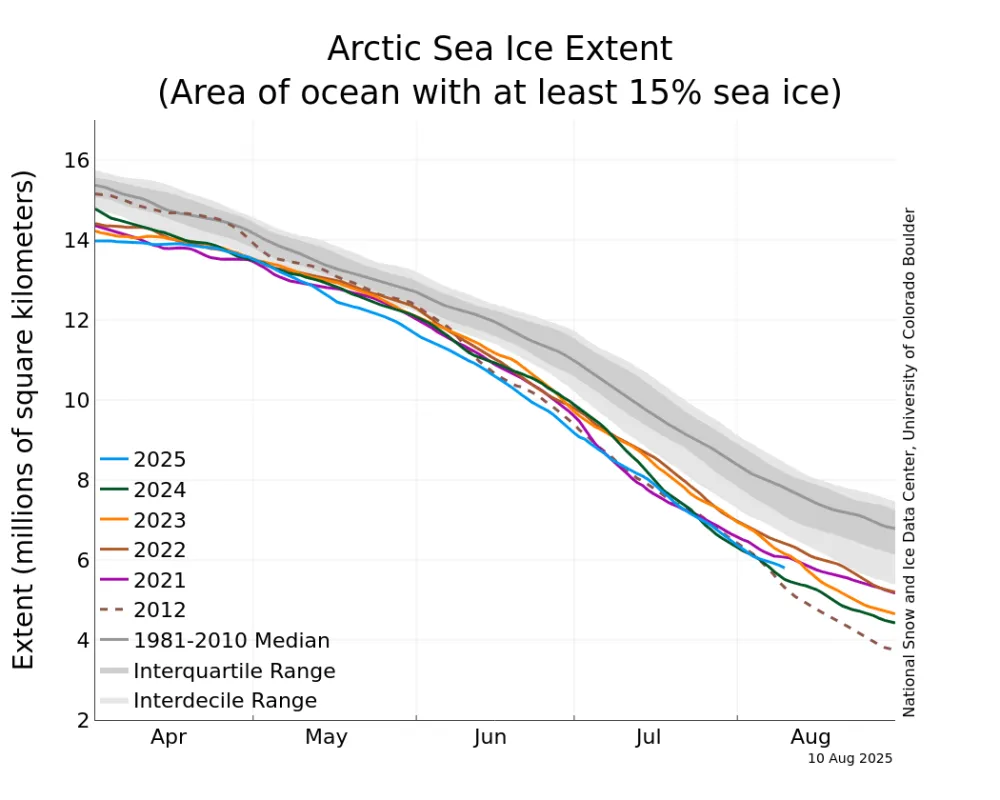
Arctic sea ice extent for July 2025 averaged 7.66 million square kilometers (2.96 million square miles). It is the fourth lowest July average in the satellite record, 370,000 square kilometers (140,000 square miles) above the satellite era record low set in 2020 (Figures 1a and 1b). Compared to average, and as seen for June, extent remains far below average in the Barents and Kara Seas; both of these areas are essentially ice free. Below average extent continues along most of the Eurasian coast, notably in the Laptev Sea. Extent is also below average in the East Greenland Sea. While Amundsen’s Northwest passage and the Northern Sea Route still hold considerable ice at key choke points, there was an early start to seasonal shipping along the Northern Sea Route with icebreaker escort. As of the end of the first week of August, daily extent was the third lowest in the satellite record, with a large area of low concentration ice in the Beaufort Sea quickly melting.
Note that as of July 31, the NSIDC Sea Ice Index has switched to using the Japan Aerospace Exploration Agency (JAXA) Advanced Microwave Scanning Radiometer 2 (AMSR2) sensor as input for the extent estimates and images used by Sea Ice Today and Charctic. The AMSR2 data are processed to be consistent with the previous Defense Meteorological Satellite Program (DMSP) F17 and F18 Special Sensor Microwave Imager/Sounder (SSMIS) data source. Sea Ice Index data for all of 2025 have been reprocessed with AMSR2 for consistency through the year. Thus, 2025 extent values will change slightly from those previously reported in Sea Ice Today.
Figure 1a. Arctic sea ice extent for July 2025 was 7.66 million square kilometers (2.96 million square miles). The magenta line shows the 1981 to 2010 average extent for that month. Sea Ice Index data. About the data. — Credit: National Snow and Ice Data Center
Figure 1b. The graph above shows Arctic sea ice extent as of August 10, 2025, along with daily ice extent data for four previous years and the record low year. 2025 is shown in blue, 2024 in green, 2023 in orange, 2022 in brown, 2021 in magenta, and 2012 in dashed brown. The 1981 to 2010 median is in dark gray. The gray areas around the median line show the interquartile and interdecile ranges of the data. Sea Ice Index data. — Credit: National Snow and Ice Data Center
Conditions in context
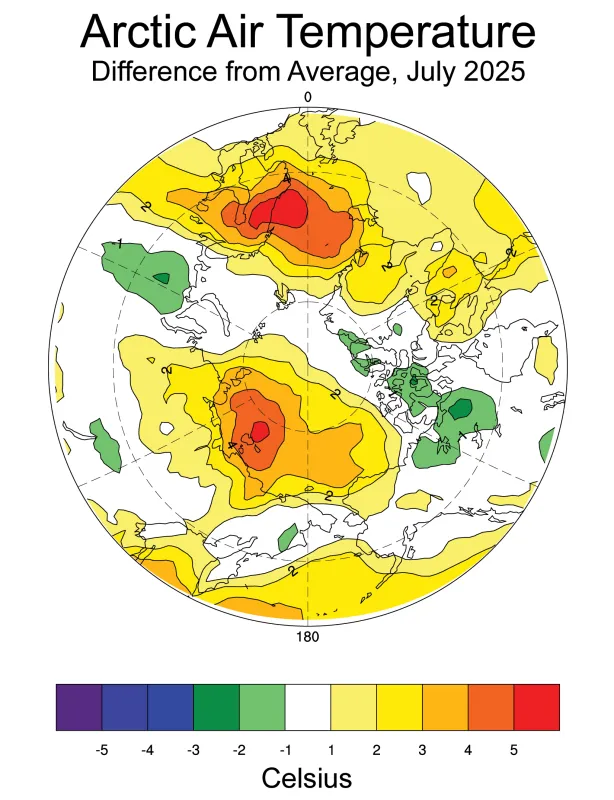
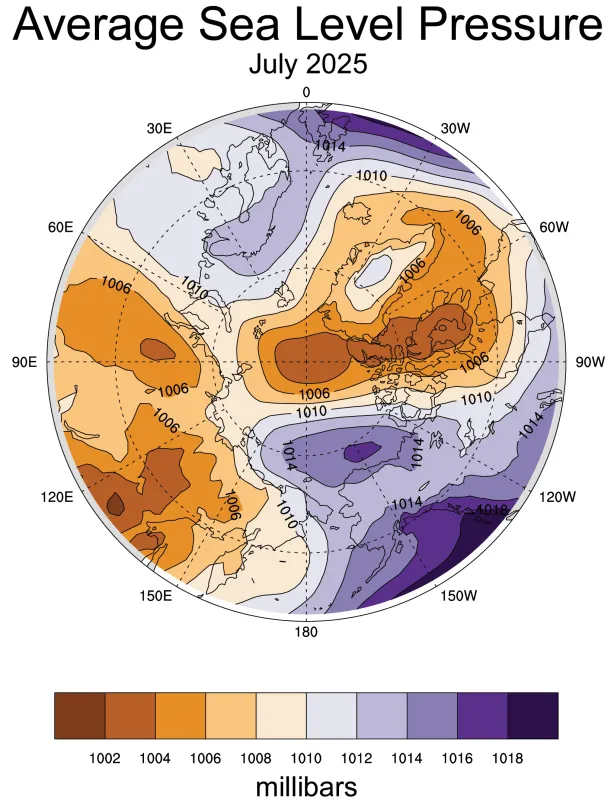
The average air circulation pattern as sea level was somewhat unusual, with low sea level pressure over much of the Arctic Ocean, a large center of low pressure encompassing most of the Canadian Arctic Archipelago and Greenland, and separate areas of low pressure over central and eastern Russia. A region of high pressure (anticyclonic conditions) prevailed in the Beaufort Sea north of Alaska. Note that the pressure pattern over the Fram Strait region implies winds from the south, acting to inhibit ice transport through the Strait. This helps to explain the below-average ice extent in the East Greenland Sea. Temperatures at the 925 hPa level (about 2,500 feet above the surface) were up to 4 degrees Celsius (7 degrees Fahrenheit) above average over the Laptev Sea, where as noted earlier, extent is well below average. Below average temperature prevailed over most of the Canadian Arctic Archipelago and south of the Barents Sea coast. Clear skies under the high pressure in the Beaufort Sea likely allowed for enhanced surface melting (Figures 2a and 2b).
Figure 2a. This plot shows the departure from 1981 to 2010 average air temperature in the Arctic at the 925 hPa level, in degrees Celsius, for July 2025. Yellows and reds indicate above-average temperatures; blues and purples indicate below-average temperatures. — Credit: NSIDC courtesy NOAA Earth System Research Laboratory Physical Sciences Laboratory and ECMWF Version 5 (ERA5) Reanalysis
Figure 2b. This plot shows average sea level pressure in the Arctic, in millibars, for July 2025. Purples indicate high air pressure; oranges indicate low pressure. — Credit: NSIDC courtesy NOAA Earth System Research Laboratory Physical Sciences Laboratory and ECMWF Version 5 (ERA5) Reanalysis
July 2025 compared to previous years
The downward linear trend in Arctic sea ice extent through 2025 for July is 65,000 square kilometers (25,000 square miles) per year or 6.9 percent per decade relative to the 1981 to 2010 average (Figure 3). Based on the linear trend, since 1979, June has lost 3.01 million square kilometers (1.16 million square miles) of sea ice. This is equivalent to nearly twice the size of Alaska.
Reduced concentration in Beaufort and Chukchi Seas
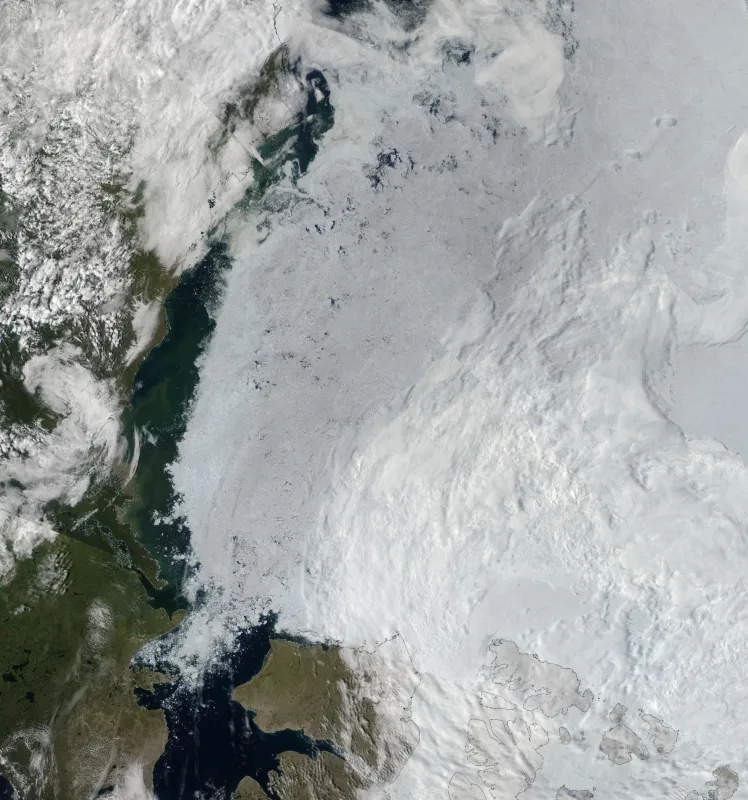
Data from the AMSR-2 sensor indicates large areas of reduced concentration ice in the Beaufort and Chukchi Seas. While in parts, this likely reflects surface melt, which can contaminate the microwave emission signal, visible band data from NASA’s Moderate Resolution Spectroradiometer (MODIS) confirm reductions in ice concentration (Figure 4).
New insights on Arctic rain events
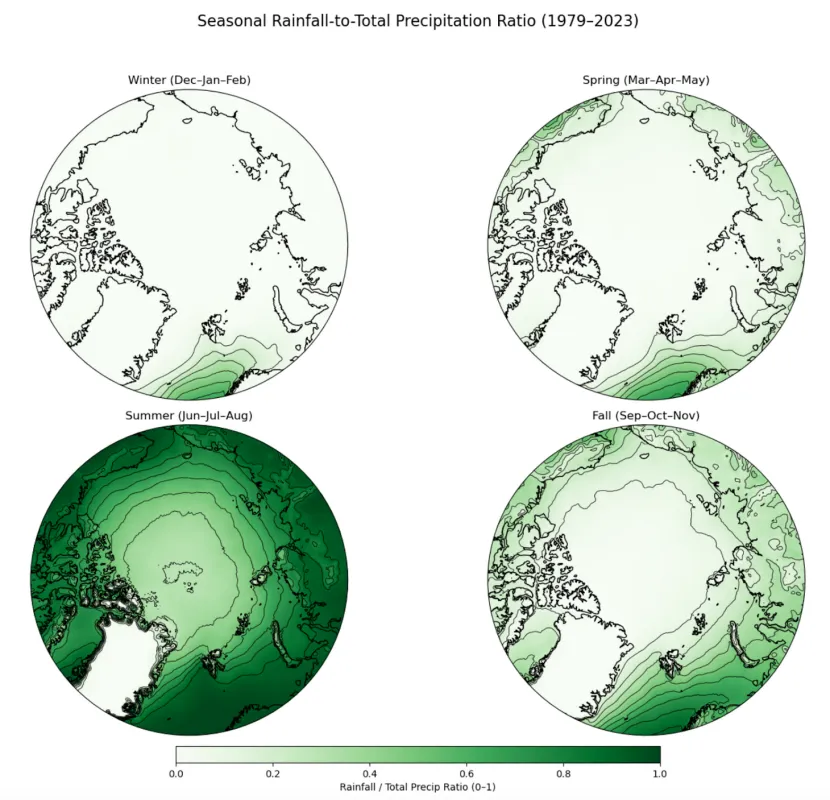
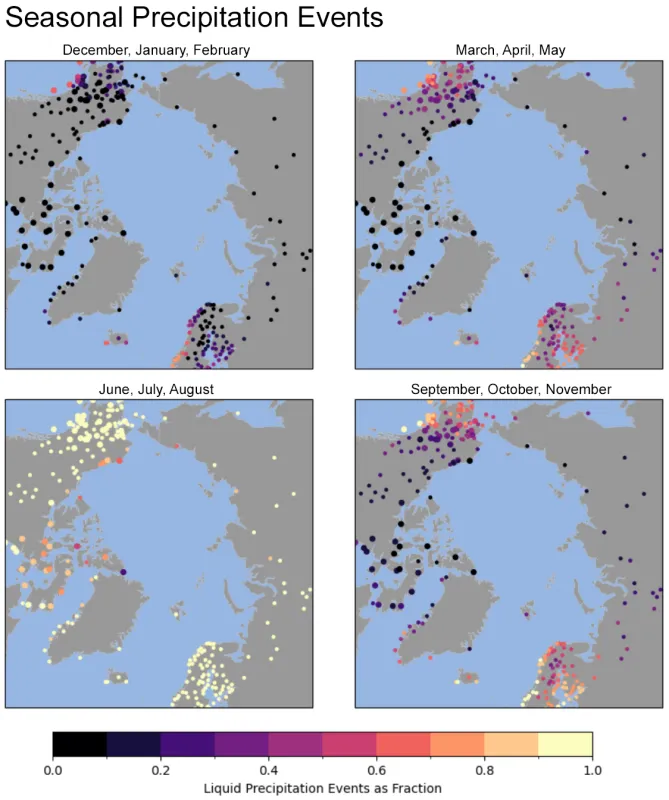
A new study, led by NSIDC Ph.D. student Zaria Cast and submitted to The Cryosphere, takes an Arctic-wide view of rain events and seasonality. It examines precipitation trends over both land and water over the past few decades. Rain on ice or snow has a large impact on melting, and if it refreezes above soft snow, it can inhibit animal mobility over sea ice. Rain on snow can be especially severe for land animals on snow-covered tundra. The study finds increases in overall precipitation across the Arctic, consistent with Arctic amplification, and finds that the proportion of rainfall relative to snowfall has increased. Trends vary, however, by location and season.
The study draws from multiple data sources: the Automated Surface Observing System (ASOS); a 1996 study examining global precipitation over the second half of the twentieth century, Integrated Comprehensive Ocean-Atmosphere Data Set (ICOADS); and the European Centre for Medium-Range Weather Forecasts (ECMWF) Version 5 Reanalysis, or ERA5.
During the Northern Hemisphere autumn, unsurprisingly, the proportion of rainfall drops as temperatures drop. In winter, most precipitation falls as snow, except for the southernmost portion of the Atlantic sector of the Arctic Ocean. In fact, the North Atlantic stands out as a warm, humid, and increasingly rainy spot in the Arctic. Nearly all summer precipitation now falls as rain in this region, and rain precipitation continues to predominate throughout much of the year. This shift is likely driven by sea ice loss. Minor increases in the rain fraction of precipitation are seen along the North Slope of Alaska and Laptev Sea north of Siberia.
Outside of summer, the climate over the central Arctic Ocean has not warmed enough yet to appreciably change the snow-to-rain ratio. Comparison of modern precipitation patterns (1979 to 2023) with those documented in the IOCADS study (from 1950 to 1995) show little change in the snow-to-rain ratio, when the Arctic was cooler than now.
Antarctica’s winter
Sea Ice in the Southern Hemisphere tracked at third lowest in the satellite record throughout July, and grew at slower-than-average rates through the month. At month’s end, Antarctica’s sea ice cover was about 850,000 square kilometers (330,000 square miles) above the record low extent for the day, and 1.3 million square kilometers (500,000 square miles) below the 1981 to 2010 average (median) extent. Ice cover remains very low in the Bellingshausen Sea, Cosmonaut Sea, Ross Sea, and southwestern Pacific (south of Australia) regions. Recent ice growth has reduced the shortfall in the Bellingshausen Sea and Cosmonaut Sea, but has created larger shortfalls in the Ross and southwestern Pacific.
Reference
Cast, Z.I. M.C. Serreze, E. Cassano, and A.P. Barrett. In press. Seasonal characteristics and trends in precipitation partitioning in the Arctic.
