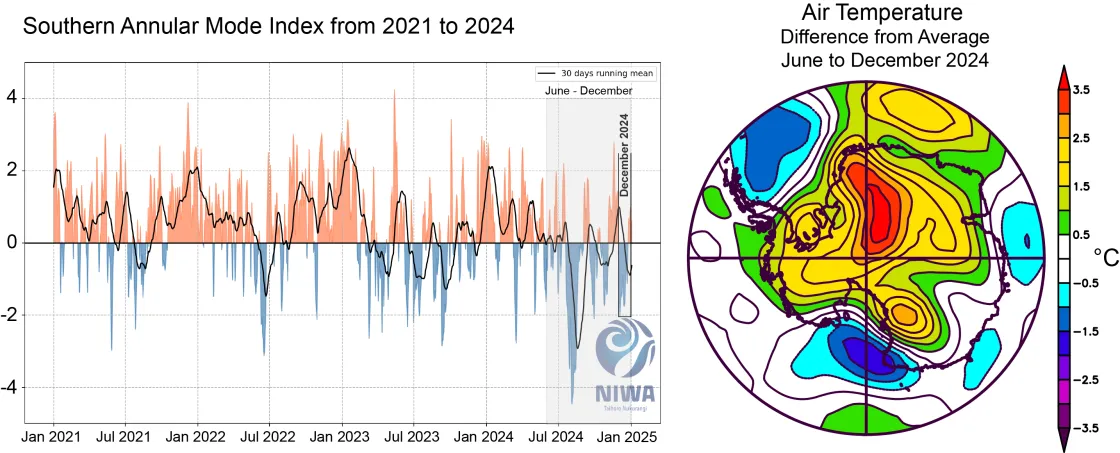
Widespread coastal melting occurred in Antarctica through the second half of December and is continuing in the first few days of the new year in several areas. Nearly every region with routine surface snowmelt has had more days of melt than is typical for this time of year. Causes for the melting vary by region, but it is noteworthy that the temperatures over the Antarctic Ice Sheet have been generally above average, by roughly 2 degrees Celsius (4 degrees Fahrenheit) over the entire latter half of 2024. By contrast, cooler conditions prevailed over the adjacent ocean in the Weddell and Ross Seas, which contributed to a slower springtime sea ice retreat.
Current conditions
Surface melt extent over the Antarctic Ice Sheet rose sharply again in late December, after a record melt event in mid-December, culminating in all-time record melt extent in the passive microwave satellite record on December 25 and 26, surpassing 3 percent of the ice sheet area. Surface melt remained high into the first few days of the new year, particularly in the northern Peninsula. In this second melt surge, surface melting happened over several areas of the East Antarctic coast, including the Amery, West, and Shackleton Ice Shelves, the Totten Glacier and Porpoise Bay region, and Cook Inlet. Nearly all these areas have already accumulated above-average melt days for this time of year by 5 to 10 days.
Conditions in context
Causes for the widespread melt event of late December varied from region to region. In the Peninsula, an arrangement of low pressure to the west and high pressure to the northeast drove persistent eastward winds across the Peninsula ridge, leading to downslope, warm, and dry wind (foehn) events over the northeastern Larsen Ice Shelf. The cyclonic wind pattern of the low pressure (clockwise in the Southern Hemisphere) was extensive enough to also drive winds from the east along the southern end of the Peninsula, bringing foehn winds and melting to the George VI and Wilkins Ice Shelves. Along the East Antarctic coast, from Enderby Land all the way to Cape Adare, the melting was accompanied by several strong low-pressure systems that closely approached the coastline, again drawing strong downhill winds off the continental ice, where prominent above-average air pressure fed the low-pressure offshore areas.
Warm winter and spring in the South
Temperature conditions on the Antarctic Ice Sheet have been generally above average over much of 2024. From June to December, air temperatures over most of the ice sheet were more than 1 degree Celsius (2 degrees Fahrenheit) above the 1991 to 2020 average. This coincided with several periods of weak circumpolar air circulation, as measured by an index of the Southern Annular Mode (SAM). The SAM index is a way of characterizing the main circumpolar westerly wind pattern. When it is positive, the ring of westerly winds is stronger, with a less wobbly atmospheric boundary; when it is negative, there is greater north-south air exchange. Thus, warmer conditions and more moisture can generally be expected when the SAM index is negative, although there are other crucial factors. Over the past few decades, the SAM index has trended towards more positive values, in contrast to the past several months. The generally increasing trend is a result of both warmer conditions in the tropical latitudes and the loss of ozone in the upper atmosphere in Antarctic springtime.
Snowfall in Antarctica in 2024
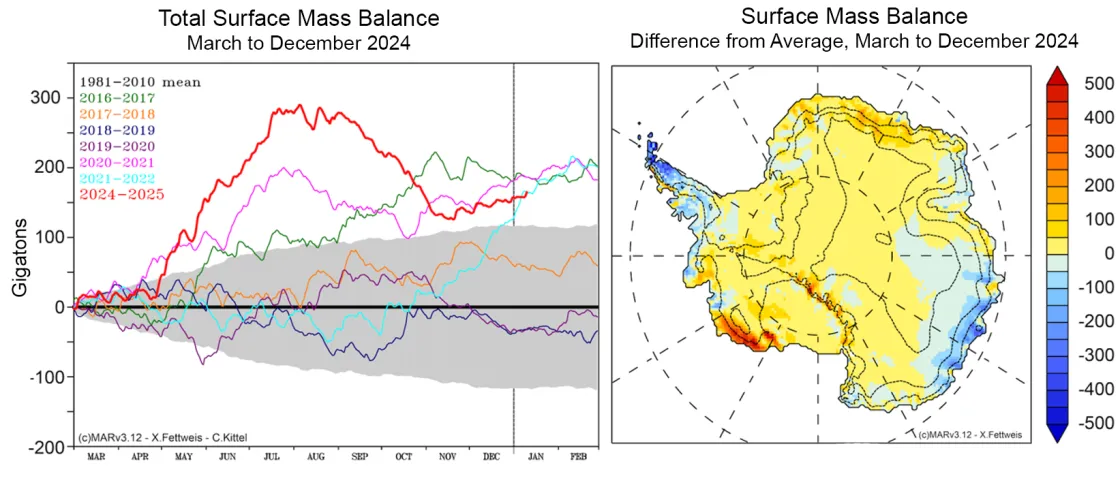
Antarctic climate models, based on real weather data and a model reanalysis of conditions across the continent, indicate a substantial increase in total snowfall in 2024, in particular, over the Dronning Maud Land coast, Getz and Sulzberger Ice Shelves, and most importantly, much of the East Antarctic Plateau and higher elevations of West Antarctica. The 2024 surface mass balance, which is the sum of snowfall and rainfall minus evaporation and run-off, was over 300 billion tons above the typical annual input, but was reduced to 200 billion tons by the end of the year, primarily through evaporation (melt runoff and rainwater are minor factors in Antarctica). The small but very extensive surplus in accumulation over the East Antarctic Plateau is an important component of Antarctica’s mass budget. This region is usually very dry, so increased snowfall offsets much of the ice loss as glaciers accelerate along the continental margin. The increased snowfall over much of Antarctica and the warm conditions and low SAM index (i.e. low polar vortex strength) are likely related, together making for unusually snowy and warm conditions on the southern continent.
Rapid expansion of surface melt and ponding in several areas
Intense prolonged melting in the northern Larsen Ice Shelf region transformed the appearance of the area in satellite images during December. What started out as typical springtime snow cover and landfast sea ice extent within its embayments, shifted to summer-like conditions by the start of the new year. Our team monitors this area closely because of its past history of rapid fracturing from surface meltwater on the Larsen A and B Ice Shelves and their remnant tributary glaciers. Of particular interest through the rest of the season is the remnant area of the Larsen B ice shelf in its southernmost embayment (Scar Inlet). Sudden loss of buttressing fast ice in this area has led to changes to inland glacial ice.


