As darkness extends southward across the Arctic, sea ice has advanced to much of the Russian shoreline, but growth has been particularly slow in the Barents and Kara Seas. In the Antarctic, with the onset of spring, the pace of seasonal sea ice loss has increased.
Overview of conditions
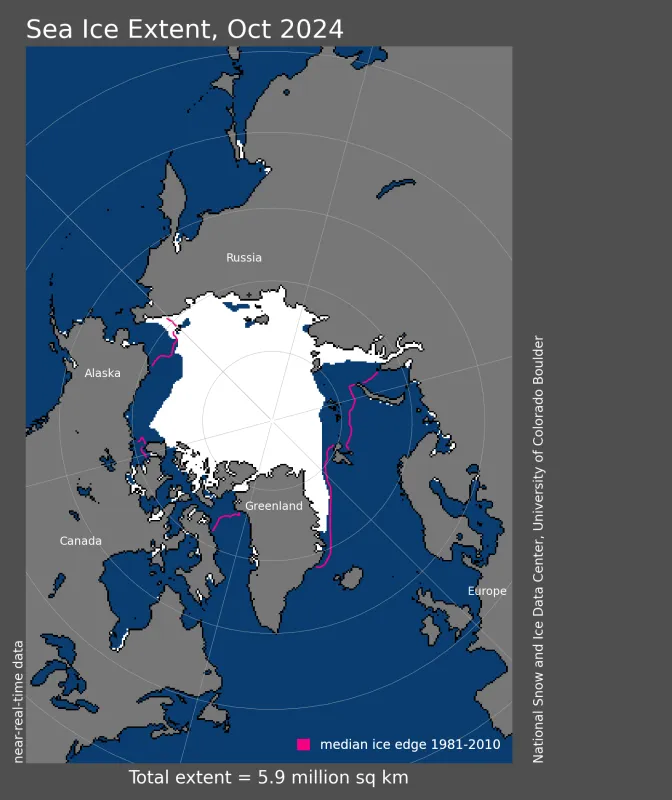
Average Arctic sea ice extent for the month of October was 5.94 million square kilometers (2.29 million square miles), fourth lowest in the 46-year-satellite record and 610,000 square kilometers (236,000 square miles) higher than 2020, the record low extent for the month (Figures 1a and 1b). Sea ice extent is particularly low in the Barents and Kara Seas, and in the Beaufort Sea, Baffin Bay, and the Canadian Archipelago. Elsewhere, the extent was near average with the ice reaching the Russian coast everywhere east of the Kara Sea.
After a slow start early in October, Arctic sea ice extent quickly grew after mid-October; but, slowed again at the end of the month.
Figure 1a. Arctic sea ice extent for October 2024 was 5.94 million square kilometers (2.29 million square miles). The magenta line shows the 1981 to 2010 average extent for that month. Sea Ice Index data. About the data — Credit: National Snow and Ice Data Center
Figure 1b. The graph above shows Arctic sea ice extent as of November 3, 2024, along with daily ice extent data for four previous years and the record low year. 2024 is shown in blue, 2023 in green, 2022 in orange, 2021 in brown, 2020 in magenta, and 2012 in dashed brown. The 1981 to 2010 median is in dark gray. The gray areas around the median line show the interquartile and interdecile ranges of the data. Sea Ice Index data. — Credit: National Snow and Ice Data Center
Conditions in context
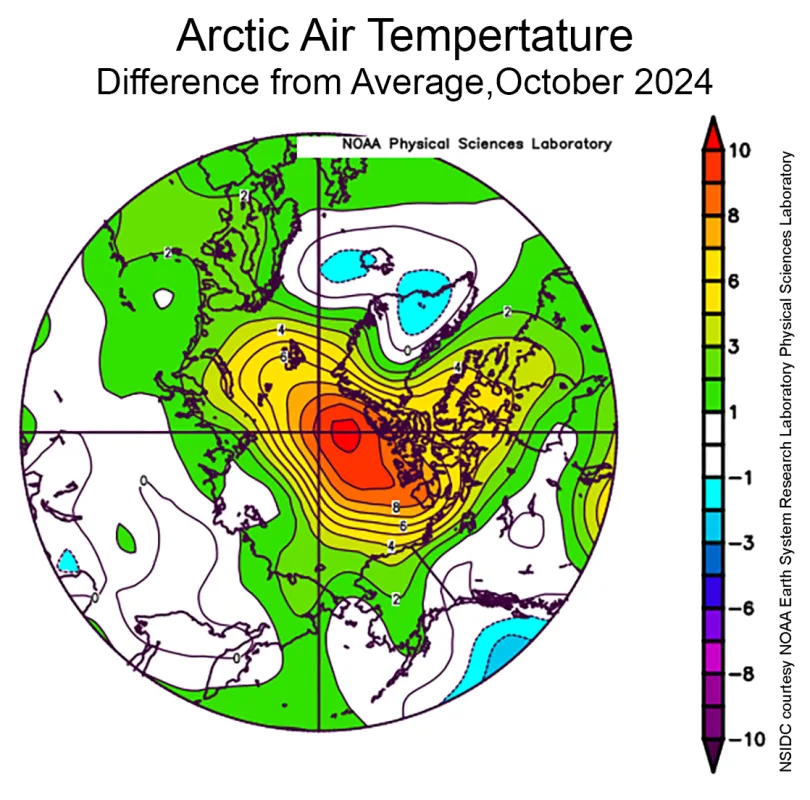
During October, much of the Arctic was markedly warmer than average. Air temperatures at the 925 hPa level (approximately 2,500 feet above the surface) were 6 to 10 to degrees Celsius (11 to 18 degrees Fahrenheit) above average near the pole and north of Greenland and the Canadian Archipelago (Figure 2a). Much of the rest of the Arctic was at least 2 degrees Celsius (4 degrees Fahrenheit) above average, with the exception of the coastal areas of the Chukchi, East Siberian, and Laptev Seas, where average temperatures prevailed.
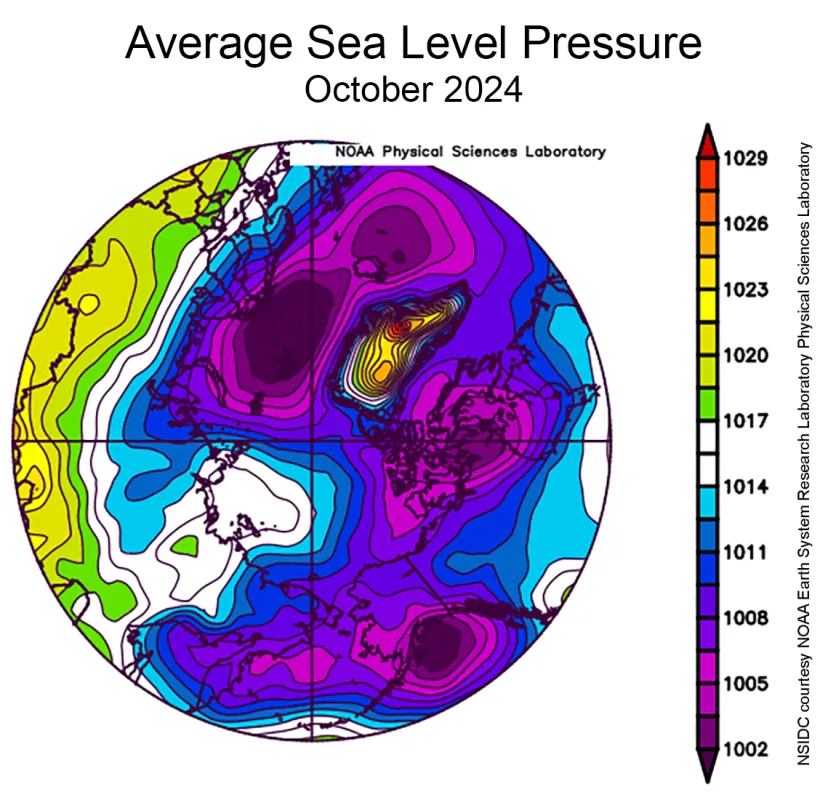
Sea level pressure was low over most of the Arctic during October with distinct lows centered over the Gulf of Alaska, the Canadian Archipelago, and Svalbard (Figure 2b). This pressure pattern helped to push ice northwards in the Kara and Barents Seas and bring in warmer air towards the central Arctic Ocean.
Figure 2a. This plot shows the departure from average air temperature in the Arctic at the 925 hPa level, in degrees Celsius, for October 2024. Yellows and reds indicate above average temperatures; blues and purples indicate below average temperatures. — Credit: NSIDC courtesy NOAA Earth System Research Laboratory Physical Sciences Laboratory
Figure 2b. This plot shows average sea level pressure in the Arctic in millibars for October 2024. Yellows and reds indicate high air pressure; blues and purples indicate low pressure. — Credit: NSIDC courtesy NOAA Earth System Research Laboratory Physical Sciences Laboratory
October 2024 compared to previous years
Including 2024, the downward linear trend in Arctic sea ice extent for October is 79,500 square kilometers (31,000 square miles) per year, or 9.5 percent per decade relative to the 1981 to 2010 average. Based on the linear trend, since 1979, October has lost 3.58 million square kilometers (1.38 million square miles) of sea ice, which is roughly equivalent to five times the size of Texas or slightly more than the country of India.
A look at the Arctic Oscillation
The Arctic Oscillation (AO) is a mode of climate variability that is a measure of the relative sea level pressure difference over the north polar region and the mid-latitudes. It has two phases. In the negative phase, there is relative higher pressure over the Arctic and lower pressures further south. In the positive phase, lower pressure reigns over the Arctic with higher pressure in the mid-latitudes. A positive AO during winter (January through March) has been associated with stronger advection of ice across the Arctic and out through Fram Strait (Rigor et al., 2002; Rigor and Wallace, 2004). This favors a thinner springtime ice cover, strong summer ice loss, and a low September minimum extent. A negative AO winter broadly favors the opposite effect. However, as the Arctic sea ice cover has thinned, the relationship between the winter AO and September extent seems to have weakened and summer minimum extents can be low even with a negative winter AO pattern (Stroeve et al., 2011).
The AO phase is also expressed in terms of weather patterns in the mid-latitudes, particularly during winter. A negative AO tends to be associated with a “wavier” jet stream over the United States and Europe that can bring extreme weather to those regions. A positive AO pattern holds the polar air mass over the Arctic, resulting in less extreme mid-latitude winters.
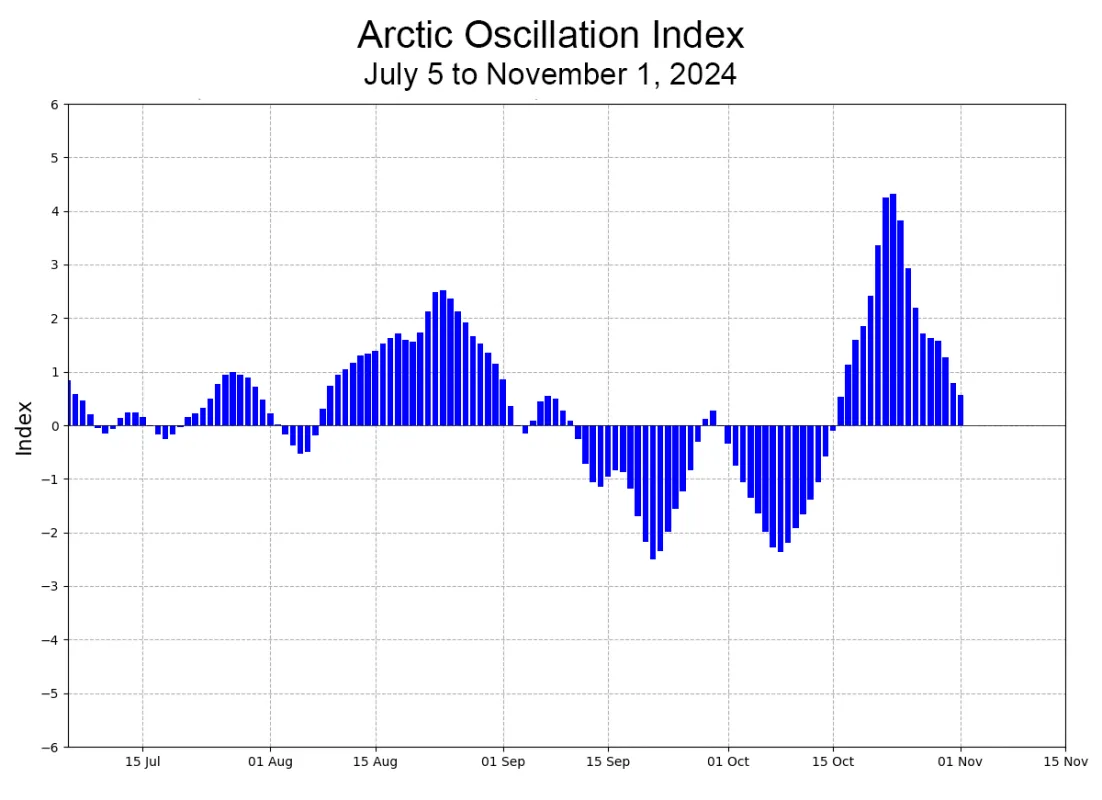
So far this fall, the AO has been highly variable, with a negative phase during the first half of October, followed by a strong positive phase during the second half of October, but moderating toward a neutral phase by the end of the month. Over the longer term, the winter AO (January-February-March average, the period of the most extensive sea ice) has trended mostly positive over the past decade; this is true for the annual average as well, with relatively few periods of strongly negative index values. However, the effect of this trend is unclear. There has been little trend in summertime sea ice extent minimums over the past 10 years.
For more information on the AO, read What is the Arctic Oscillation?
Antarctic seasonal sea ice loss accelerating
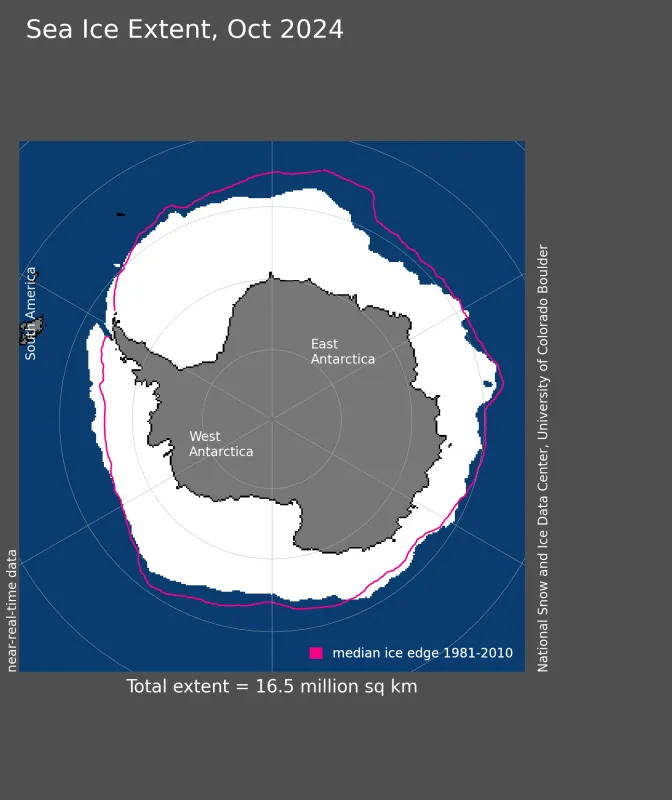
Through October, Antarctic sea ice extent continued to be second lowest following 2023 in the satellite record (Figure 5a). Seasonal ice loss was relatively slow during the early part of the month, but the pace picked up substantially during the last week of October, approaching 2023 values. As of October 31, the 2024 extent was only 120,000 square kilometers (46,000 square miles) above the October 31, 2023 value and 630,000 square kilometers (243,000 square miles) below the next lowest Halloween extent, which occurred in 1986.
Extent continued to be extremely low in the Dronning Maud Land sector and also below average in the Davis Sea and the Ross Sea (Figure 5b). Extent was slightly above average in the Amundsen and Bellingshausen Seas, as well as the western Weddell Sea.
Figure 5a. The graph above shows Antarctic sea ice extent as of November 3, 2024, along with daily ice extent data for four previous years and the record high year. 2024 is shown in blue, 2023 in green, 2022 in orange, 2021 in brown, 2020 in magenta, and 2014 in dashed brown. The 1981 to 2010 median is in dark gray. The gray areas around the median line show the interquartile and interdecile ranges of the data. Sea Ice Index data. — Credit: National Snow and Ice Data Center
Figure 5b. Antarctic sea ice extent for October 2024 was 16.55 million square kilometers (6.39 million square miles). The magenta line shows the 1981 to 2010 average extent for that month. Sea Ice Index data. About the data — Credit: National Snow and Ice Data Center
References
Rigor, I. G., J. M. Wallace, and R. L. Colony. 2002. Response of Sea Ice to the Arctic Oscillation. Journal of Climate, 15, 2648–2663, doi:10.1175/1520-0442(2002)015<2648:ROSITT>2.0.CO;2.
Rigor, I. G. and J. M. Wallace. 2004. Variations in the age of Arctic sea-ice and summer sea-ice extent. Geophysical Research Letters, 31, L09401, doi:10.1029/2004GL019492.
Stroeve, J. C., J. Maslanik, M. C. Serreze, I. Rigor, W. Meier, and C. Fowler. 2011. Sea ice response to an extreme negative phase of the Arctic Oscillation during winter 2009/2010. Geophysical Research Letters, 38, L02502, doi:10.1029/2010GL045662.
