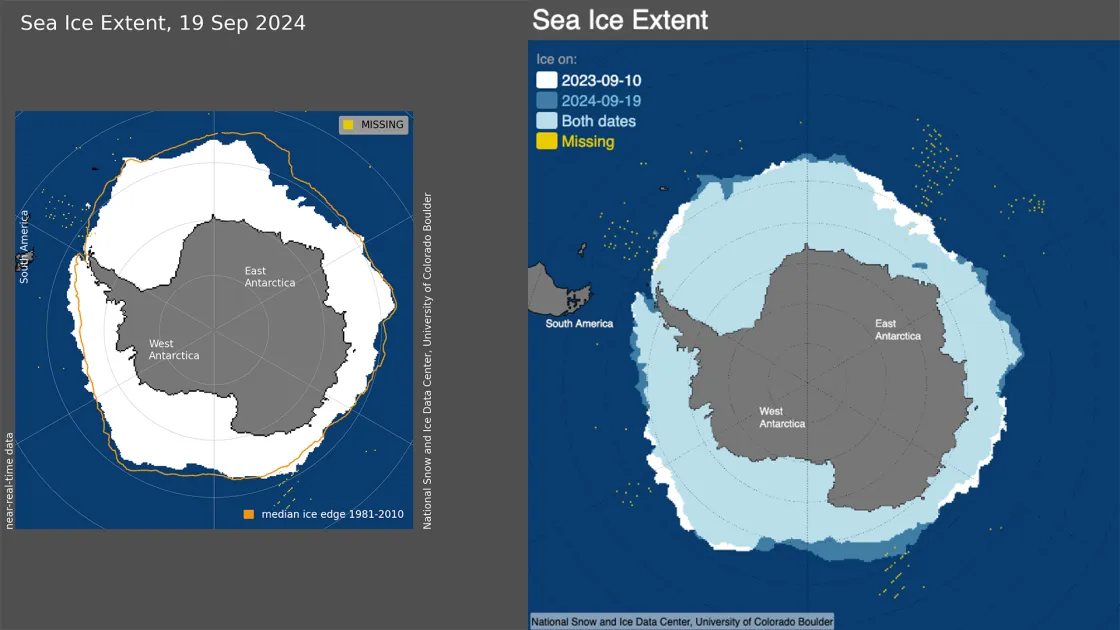
On September 19, Antarctic sea ice likely reached its annual maximum extent of 17.16 million square kilometers (6.63 million square miles). The 2024 maximum is the second lowest in the 46-year satellite record above only 2023. There is some uncertainty in the extent and date due to the loss of input source data around the time of the maximum.
Overview of Conditions
On September 19, 2024, Antarctic sea ice stalled out at an annual maximum extent of 17.16 million square kilometers (6.63 million square miles), the second lowest maximum in the satellite record that began in 1979 (Figure 1a). This year’s maximum is 200,000 square kilometers (77,000 square miles) above the previous record low set in 2023. It is 1.55 million square kilometers below (598,000 square miles) below the 1981 to 2010 average Antarctic maximum extent. Sea ice extent is markedly below average in the Indian Ocean. Extent is above average stretching out of the Amundsen Sea. This sea ice pattern is similar to last year’s record low (Figure 1b).
The Antarctic maximum extent is four days earlier than the 1981 to 2010 median date of September 23. The interquartile range for the date of the Antarctic maximum is September 18 to September 30.
There is also some uncertainty in the estimate and date of the maximum because of an outage in the input source data from September 12 to 18. The September 19 value is the highest extent in the five-day average estimates. However, this is the first valid value after the input data stream was restored. So, it is possible that the maximum actually occurred during the data outage. Also, our five-day average allows for some missing data and requires a minimum of two days of data to calculate an average. This was the case for the September 19 estimates. There is greater uncertainty as well with only partial data used for the five-day average. The highest date with a complete five days of data is September 23, which has a value of 17.13 million square kilometers (6.61 million square miles). This is slightly below the September 19 value, but given the uncertainty range of the values, it does affect the ranking or long-term trends.
Conditions in Context
This year marks another substantial low maximum in Antarctic sea ice extent (Figure 2). After tying for second lowest minimum in the satellite record on February 20, 2024, Antarctic sea ice extent appeared to be returning to more average growth rates though June. However, then it deviated significantly from most previous years except 2023 with very slow growth starting in mid-July. At the end of July, Antarctic sea ice extent was very close to the 2023 extent. Then growth picked up again through August only to settle back down in September, not far off from the 2023 lowest maximum.
While weather conditions like winds and temperature control much of the day-to-day variations in ice extent, the shift from a small long-term increasing trend through 2015 to generally much lower extents since then continues to be a topic of much debate. The overall trend in the maximum extent from 1979 to 2024 is +0.8 percent per decade relative to the 1981 to 2010 average, which is not a significant trend.
For more information on what may be causing the reduced sea ice growth around Antarctica, read Has Antarctic sea ice hit a breaking point?
Ten lowest maximum Antarctic sea ice extents (satellite record, 1979 to present)
RANK | YEAR | MAXIMUM ICE EXTENT | DATE | |
|---|---|---|---|---|
| IN MILLIONS OF SQUARE KILOMETERS | IN MILLIONS OF SQUARE MILES | |||
1 | 2023 | 16.96 | 6.55 | Sept. 10 |
2 | 2024 | 17.16 | 6.63 | Sept. 19 |
3 | 1986 | 17.99 | 6.95 | Sept. 21 |
4 | 2002 | 18.05 | 6.97 | Oct. 12 |
5 | 2017 | 18.10 | 6.99 | Oct. 10 |
6 | 1989 | 18.22 | 7.03 | Sept. 25 |
10 | 1984 | 18.32 | 7.07 | Sept. 23 |
For more information
2024 NASA visualization of Antarctic sea ice maximum

