The melt mapping tool for Antarctica Today has been improved after a revision was made to the data processing used for Greenland Today. The adjustment accounts for more widespread occurrences of unusual firn structure in Antarctica. Firn is older subsurface snow that can produce false indications of melt under certain conditions. With the correction applied, a first look at the 2020 to 2021 season points to an intense melt season in the northernmost and southernmost Antarctic Peninsula, but generally below-average melting elsewhere on the continent.
Current conditions
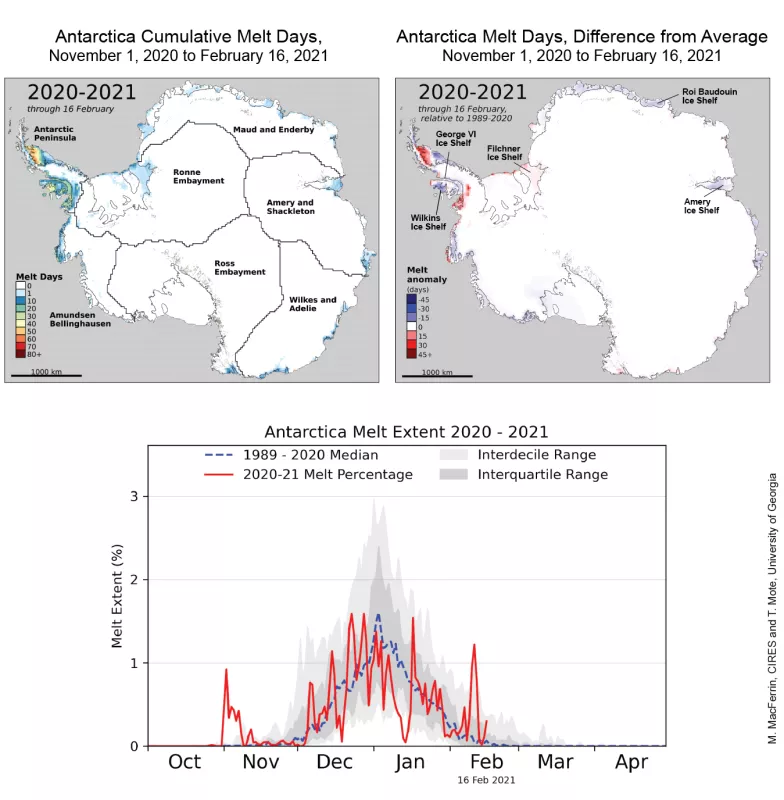
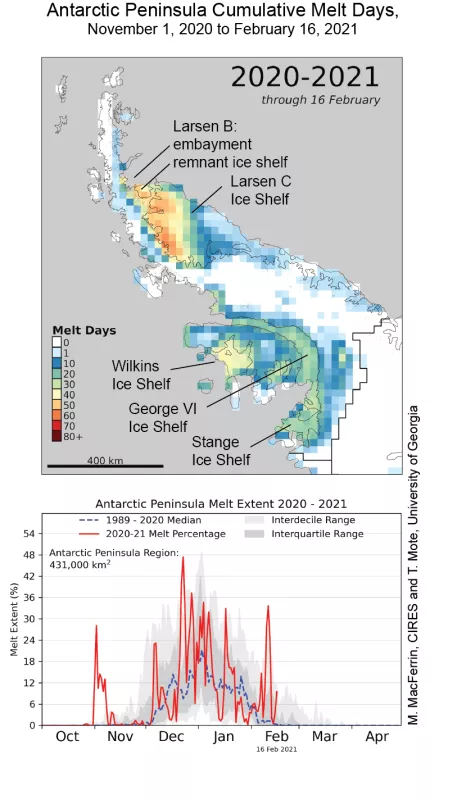
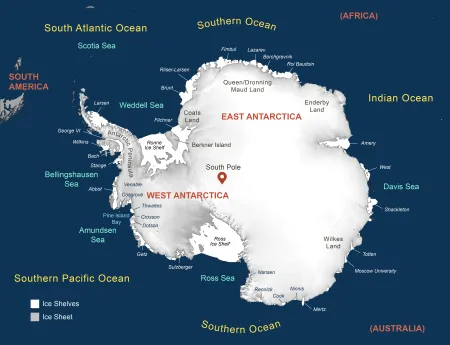
Antarctic surface snow melt extent through February 16, 2021, has been above average in the northernmost and southernmost sections of the Antarctic Peninsula, but below average in nearly all other areas so far this season (Figure 1a). In early December, much of the Filchner Ice Shelf briefly experienced surface melt, a region that rarely has surface melting (Figure 1a, top right). However, much of coastal East Antarctica had significantly below average melting. This late in the melt season the ice surfaces of the Amery and Roi Baudouin Ice Shelves are usually flooded with extensive meltwater in the form of flooded snow, lakes, and even rivers. However, such features are absent this year. On the Antarctic Peninsula, a strong melt event in the first week of November was limited to the northeastern sector. Strong foehn, or chinook, winds warmed the northern Larsen C and remnant Larsen B Ice Shelves (Figure 1b). This early surge in surface melting did not persist as it had in some record-setting past years like 1992-1993 and 2001-2002. Surface melting resumed in December and January, leading to significant melt ponding on the northern Larsen C Ice Shelf and decade-old land fast sea ice in the Larsen B embayment. Also of note is the very low number of melt days on the Wilkins and George VI Ice Shelves, usually the regions with the highest number of melt days on the continent.
Conditions in context
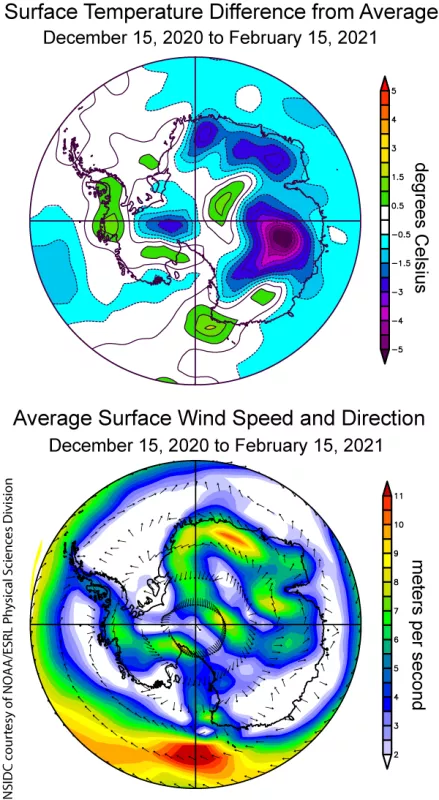
The period of December 15, 2020 to February 15, 2021 spans the core of the Antarctic summer melt season. During this time, below average surface air temperatures and a very strong Amundsen Sea Low (ASL) prevailed (Figure 2). The ASL has produced strong southward blowing winds, which are warm, along the Bellingshausen coastline and increased the winds from the east along the Amundsen Sea coast.
Surface air temperatures along the extensive coast of East Antarctica and a broad region of the adjacent Southern Ocean have been 1 to 1.5 degrees Celsius (2 to 3 degrees Fahrenheit) below average for the core period, relative to the 1981 to 2010 average (Figure 3, top). This is consistent with the near absence of surface melting in the region. Temperatures of about 1 degree Celsius (2 degrees Fahrenheit) above average characterized the southern end of the Peninsula and Siple Coast regions, but temperatures were near average for most of West Antarctica. Wind patterns for the continent show moderate to strong offshore air flow over East Antarctica (Figure 3, bottom).
Trends in Antarctic surface melting
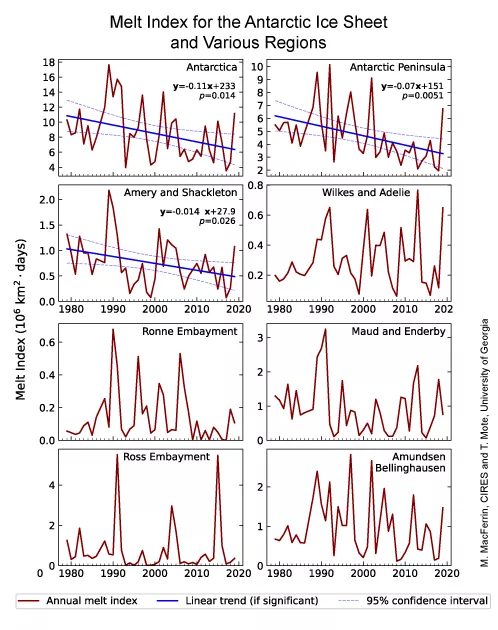
The melt index is a method of assessing the total surface melt over the entire melt season or the sum of melt area for all days in a season (Figure 3). Melt index values have been generally decreasing over the 1979 to 2020 period. (The 2020 to 2021 melt season has yet to be calculated.) The Antarctic Peninsula value significantly influences the melt index for the continent as a whole. This region is also where the melt index has been declining despite a warming trend in the annual average temperature for much of the past century. The annual average warming trend in turn has been dominated by increases in winter temperature. Surface melting on the Peninsula is strongly controlled by winds from the northwest during the austral summer, which bring warm moist air to the eastern side and produce strong downslope (foehn) winds, which induce extensive surface melting and ponding. Climate factors such as the Southern Annular Mode and the El Niño Southern Oscillation modulate the occurrence and intensity of these northeasterly winds. Other regions of the ice sheet show no clear trend but highlight the erratic extent of melt year to year.
More than one way to break up—for icebergs
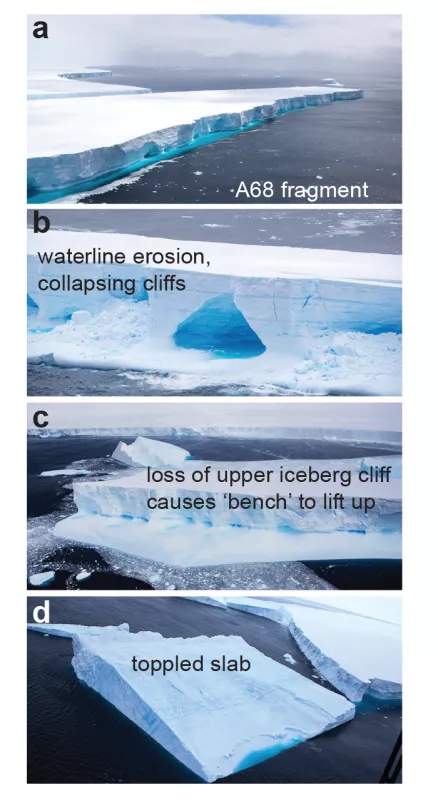
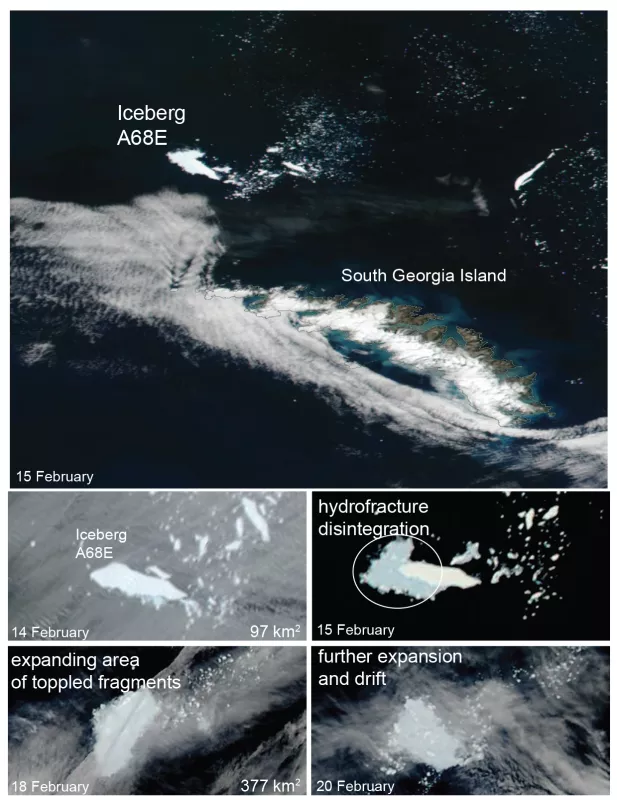
The giant A68 iceberg, roughly the size of Delaware, broke away from the Larsen C Ice Shelf in 2017. Since then, it has slowly drifted northeast. In December, it approached the vicinity of South Georgia Island, in the southern Atlantic Ocean, where atmospheric and ocean conditions are much warmer than around Antarctica. In late December, the iceberg drifted over strong and warm ocean currents, causing the iceberg to break apart and thin. This is a well-known process that is typical for large icebergs entering warm waters. The large fragments tend to break off along pre-existing lines of weakness that were present in the ice shelf prior to calving. They then begin to shed pieces along their edges as the icebergs drift into warm surface water, 2 to 4 degrees Celsius (4 to 7 degrees Fahrenheit) above freezing (Figure 4a). This process, known as edge wasting or footloose calving, occurs when warm ocean water melts the iceberg at the waterline. The section of the iceberg above the waterline, or freeboard area, begins to collapse as a result of this undercutting. As it collapses, its weight is lifted off the ice beneath the waterline. This allows the smooth subsurface bench to float upward. Eventually, the bench of ice exerts enough upward force to break away from the edge of the large fragment, creating sliver icebergs. A new paper by colleagues Mark England, Till Wagner, and Ian Eisenmann models this process. Under continued warm conditions, intense surface melting occurs, and meltwater accumulates in the upper snowpack or as melt ponds. Eventually, the snow layer saturates with water. At this point, fractures in the upper surface of the iceberg can fill with water and rapidly fracture the iceberg, a process called hydrofracture. This process occurs on a very fine spatial scale, and the calved icebergs generally topple, appearing as a blue mush in satellite images (Figure 4b). This process is thought to be responsible for the rapid disintegration of the following ice shelves: Larsen A in 1995, Larsen B in 2002, and Wilkins in 2008.
Adjustment to processing for Antarctica Today
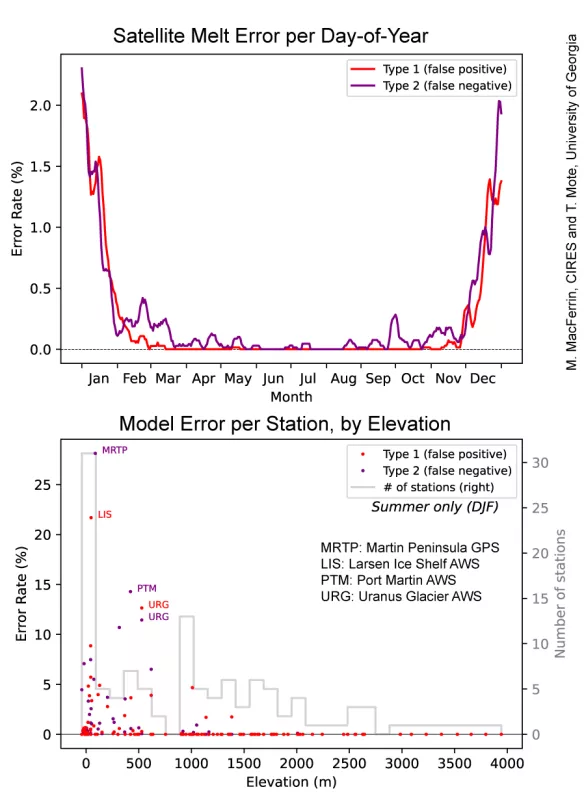
After posting a preliminary map of the 2019-to-2020 melt days in the opening post for Antarctica Today on January 11, several readers noted differences between our assessment and other approaches to estimating surface melt conditions. The initial map of the previous summer’s melt season was based on an identical approach that has been used successfully for Greenland Today. The discrepancy for Antarctica prompted a closer evaluation of several regions, particularly high-elevation areas where melt is extremely rare, such as above the Mertz and Ninnis glacier outlets, and above the West Ice Shelf. These regions were found to have unusual passive microwave emission signatures, notably large annual cycles in the 37 GHz brightness temperature (TB) and lower TB at 18 or 19 GHz than at 37 GHz. The Greenland Today algorithm uses dynamic threshold of the 37 GHz, horizontally polarized TBs. The threshold TB is simulated by a simple microwave emission model for each grid cell, re-evaluated each season, associated with 1 percent liquid water content of the firn (see Mote and Anderson 1995; Mote 2007). With a large annual cycle, false indications of melt can occur. To reduce the false positives, the new processing eliminates grid cells that have an unusual TB variation with frequency unless they exceed the melt threshold by 10 Kelvin or more. A survey of Greenland’s snow characteristics showed few such anomalous grid cells, and these were sparsely distributed. No change is planned to the Greenland processing at this time. We conducted an error analysis over the years 2002 to 2020 by comparing the satellite-derived melt to observed air temperatures at 131 ground weather stations (74 automated weather stations managed by the University of Wisconsin and 57 UNAVCO meteorology sensors mounted at GPS or seismic stations) (Figure 5). Overall, errors in melt detection by our algorithm were 1.5 percent for the summer months of December, January, and February, when nearly all the melt occurs. These were nearly evenly split by errors of commission (false positive; that is, detecting melt in a grid cell when the local weather sensor does not record temperatures ≥ 0 degrees Celsius for the day; 0.72 percent overall) and errors of omission (false negative; not detecting melt when a surface station indicated a temperature ≥ 0 degrees Celsius that day: 0.78 percent). Errors are dominated by a few locations, often those where nearby stations record persistent warm, near-freezing temperatures, or where stations are located on or near dark rock outcrops. It is likely that a substantial fraction of the errors of omission are due to the specific satellite overpass times versus the daily temperature cycle. Errors of commission may be due to remaining problems associated with unusual firn characteristics at some sites. Another issue can be the difference in temperature measurement between air temperature a few meters above the surface and the snow, particularly on bright sunny days.
Further Reading
Banwell, A. F., R. T. Datta, R. L. Dell, M. Moussavi, L. Brucker, G. Picard, C. A. Shuman and L. A. Stevens. 2021. The 32-year record-high surface melt in 2019/2020 on the northern George VI Ice Shelf, Antarctic Peninsula. The Cryosphere, 15, 909–925. doi:10.5194/tc-15-909-2021.
Barrand, N. E., D. G. Vaughan, N. Steiner, M. Tedesco, P. Kuipers Munneke, M. R. Van den Broeke, and J. S. Hosking. 2013. Trends in Antarctic Peninsula surface melting conditions from observations and regional climate modeling. Journal of Geophysical Research: Earth Surface, 118(1), pp. 315-330. doi:10.1029/2012JF002559.
England, M. R., T. J. Wagner and I. Eisenman. 2020. Modeling the breakup of tabular icebergs. Science Advances, 6(51), p.eabd1273. doi:10.1126/sciadv.abd1273.
Mote, T. L. 2007. Greenland surface melt trends 1973–2007: Evidence of a large increase in 2007. Geophysical Research Letters, 34(22), L22507. doi:10.1029/2007GL031976.
Mote, T. L. 2014. MEaSUREs Greenland Surface Melt Daily 25km EASE-Grid 2.0, Version 1. Boulder, Colorado USA. NASA National Snow and Ice Data Center Distributed Active Archive Center. doi:10.5067/MEASURES/CRYOSPHERE/nsidc-0533.001.
Mote, T. L. and M. R. Anderson. 1995. Variations in snowpack melt on the Greenland ice sheet based on passive microwave measurements. Journal of Glaciology, 41, 51-60. doi:10.3189/S0022143000017755.
Scambos, T., H. A. Fricker, C. C. Liu, J. Bohlander, J. Fastook, A. Sargent, R. Massom and A. M. Wu. 2009. Ice shelf disintegration by plate bending and hydro-fracture: Satellite observations and model results of the 2008 Wilkins ice shelf break-ups. Earth and Planetary Science Letters, 280(1-4), 51-60. doi.org:10.1016/j.epsl.2008.12.027.
Scambos, T., Sergienko, O., Sargent, A., MacAyeal, D. and Fastook, J., 2005. ICESat profiles of tabular iceberg margins and iceberg breakup at low latitudes. Geophysical Research Letters, 32(23). doi:10.1029/2005GL023802.
Wagner, T. J., P. Wadhams, R. Bates, P. Elosegui, A. Stern, D. Vella, E. P. Abrahamsen, A. Crawford and K. W. Nicholls. 2014. The “footloose” mechanism: Iceberg decay from hydrostatic stresses. Geophysical Research Letters, 41(15), 5522-5529. doi:10.10022014GL060832.
