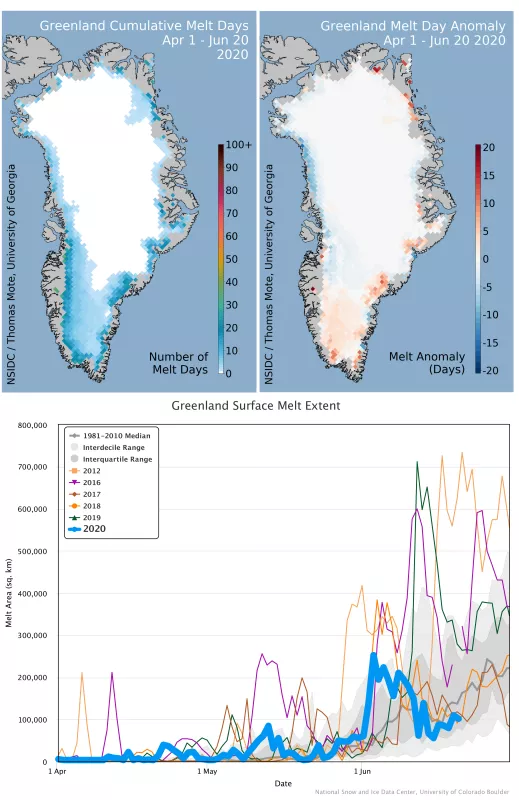
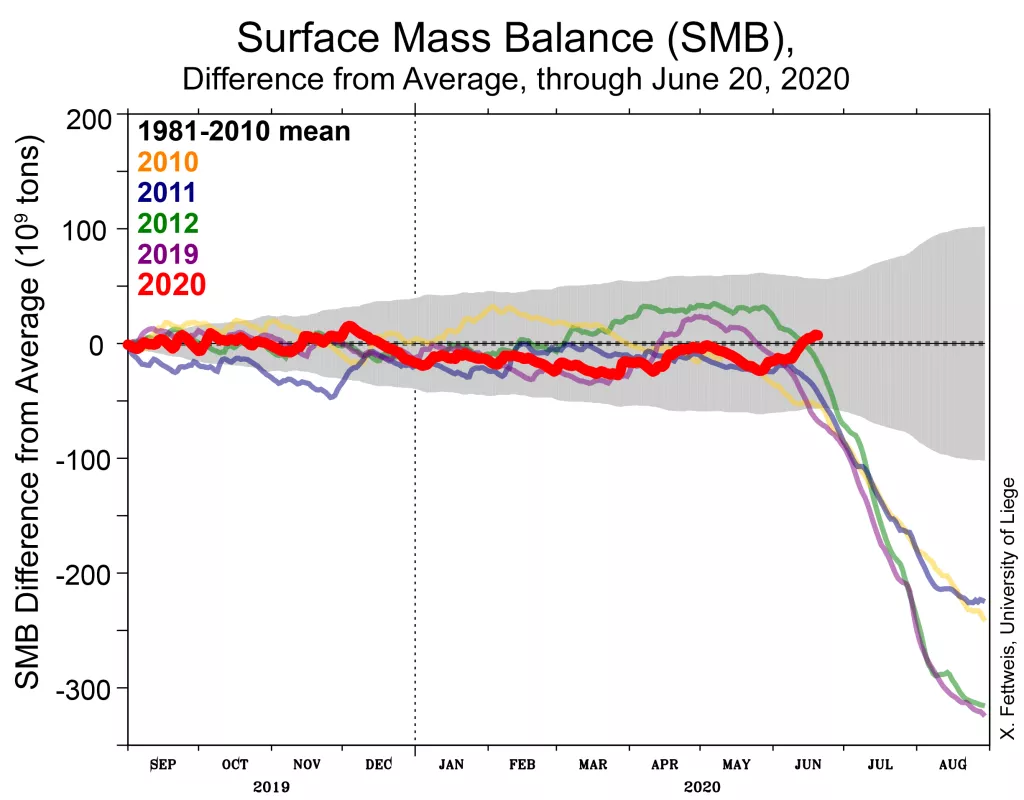
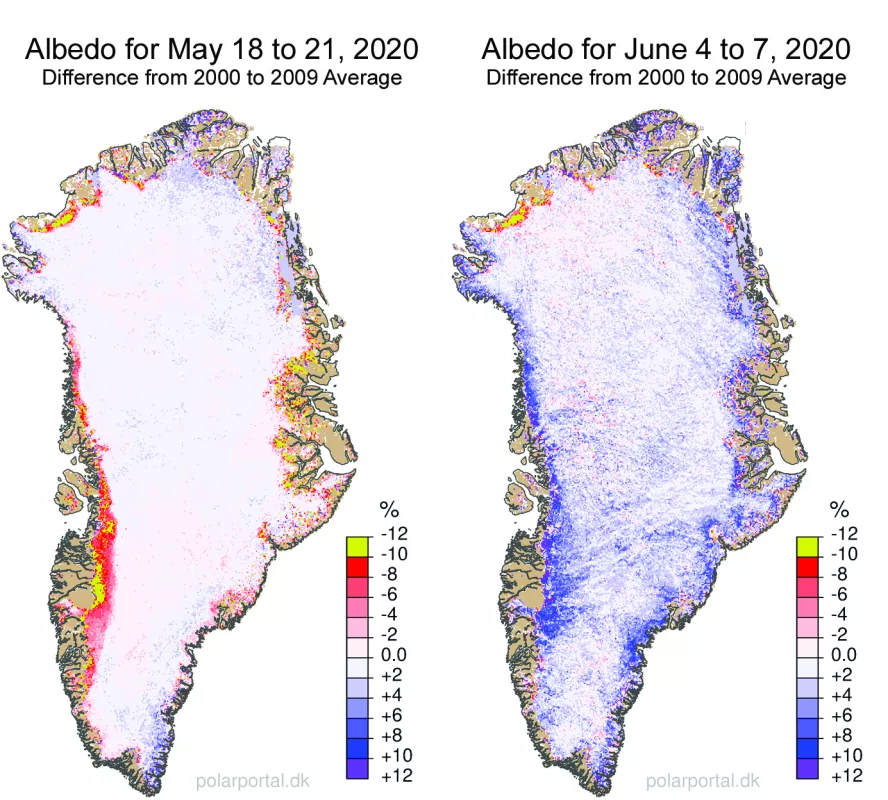
Spring melting over Greenland was near the long-term average, and concentrated along the southern coast, where extent was slightly above average. Although snowfall contribution to the ice sheet was below average early in the year, a significant snowfall event in early to mid-June brought the ice sheet close to balance, delaying the rapid early surface mass loss seen in recent years. A large melt event began on June 21, 2020, which will be discussed in a future post.
Overview of conditions
The total aerial extent of surface melting through June 20, 2020, was slightly above the 1981 to 2010 average, particularly along the southeastern coast. Total melt-day extent was 3.60 million square kilometers (1.39 million square miles) for 2020, versus 3.30 million square kilometers (1.27 million square miles) for the 1981 to 2010 average. Most of the melt-day area accumulated during a moderate 10-day-long spike in melt area beginning around June 2, 2020. Areas on both coasts north of 65 degrees N had fewer melt days. Near Nuuk, on the southern tip of the island, 30 out of 81 days were melt days, and there were around 25 melt days near the Helheim Glacier region.
Conditions in context
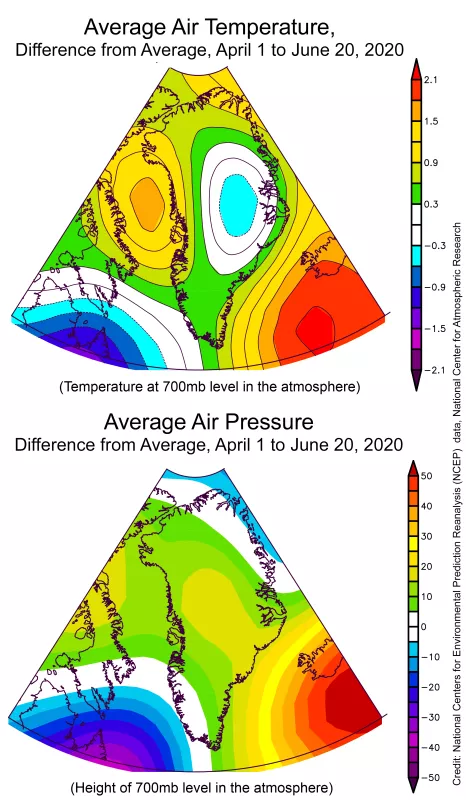
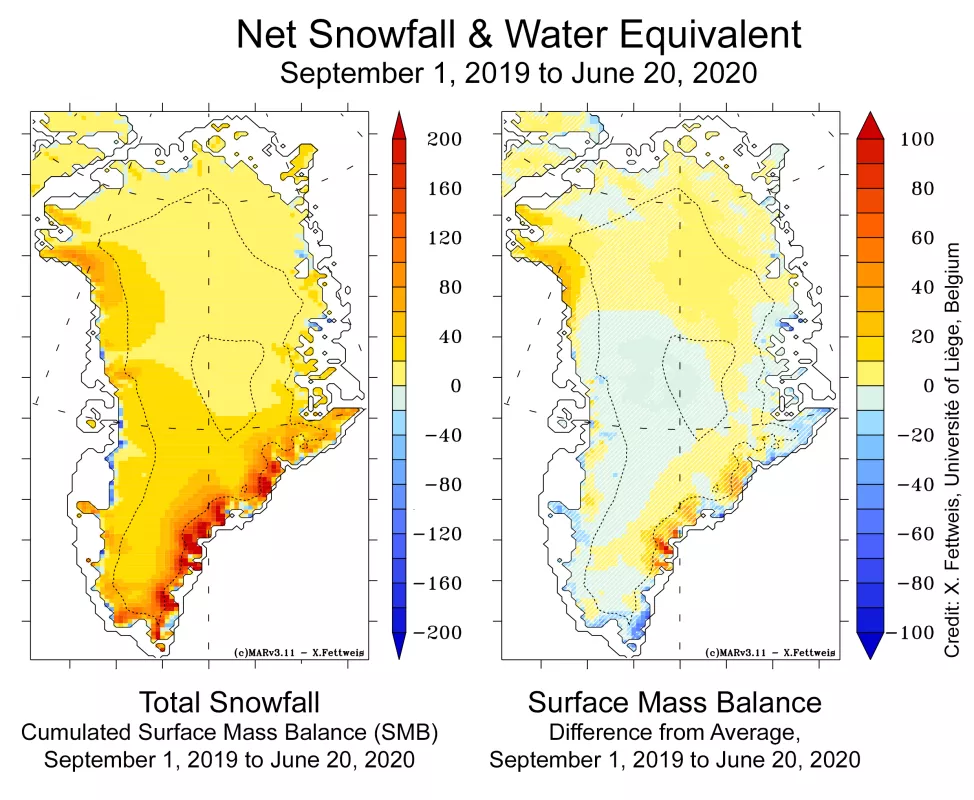
Temperatures in the Greenland region were generally higher than average over the April 1 to June 20, 2020 period, except for highest elevations of the ice sheet where temperatures were near-average to slightly below average (Figure 2). The western coastline was about 1 degree Celsius (2 degrees Fahrenheit) higher than the 1981 to 2010 average, while other coastlines were about 0.5 degrees Celsius (1 degree Fahrenheit) above average. Air pressure was generally slightly higher than the 1981 to 2010 average. This pattern, low pressure to the southwest and high pressure to the southeast, brought more frequent warm winds from the south throughout the late spring. Total snowfall and rainfall over Greenland since September 1, 2019 shows that the beginning of 2020 was drier than the 1981 to 2020 average (Figure 3). However, increased snowfall in late April and especially mid-June has increased the surface mass balance (SMB), which does not include glacier outflow, to above average (Figure 4). The additional snowfall is in the southeast. Much of the southern and western side of the ice sheet has less snow cover than average. With summer melt, this can mean that the albedo, or reflectivity, of the Greenland surface will drop quickly, leading to more heat absorption and more intense surface melting. In recent years, intense melting and runoff at the beginning of June have removed hundreds of billions of tons of snow relative to Greenland’s 1981 to 2010 net accumulation, resulting in about half of the total ice lost from the ice sheet each year. A more intense melting event occurred in late June, and runoff is increasing for the year.
Wearing white in June
An expansive snowfall event in early June added to the net mass of the ice sheet relatively late in the melt season and brightened the surface, reducing the impact of later warm weather in mid-June by allowing the surface to reflect heat. However, the snow cover over much of the western side of the ice sheet is thin, and further warm events will re-expose the dark bare ice and dustier snow below the fresh layer, accelerating melt and run off.
Further reading
The Greenland Ice Sheet SMB simulated by MARv3.5.2 in real time
