Warm air from Europe's heat wave reached Greenland on July 29 and 30, setting temperature records at Summit Station and melting about 90 percent of the ice sheet surface from July 30 to August 3. Melt runoff was estimated at 55 billion tons during the interval, or about 40 billion tons more than the 1981 to 2010 average for the same time period. Overall, melting this July was much higher than average, leading to more extensive bare ice and flooded snow areas.
Overview of conditions
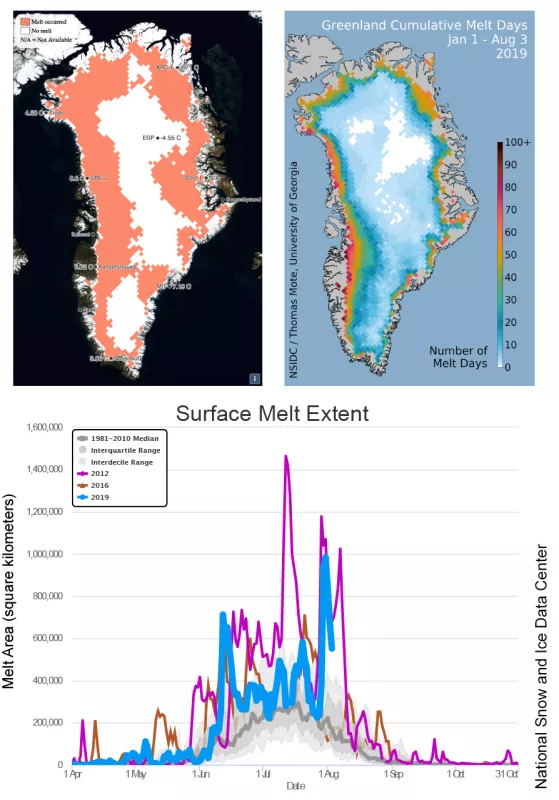
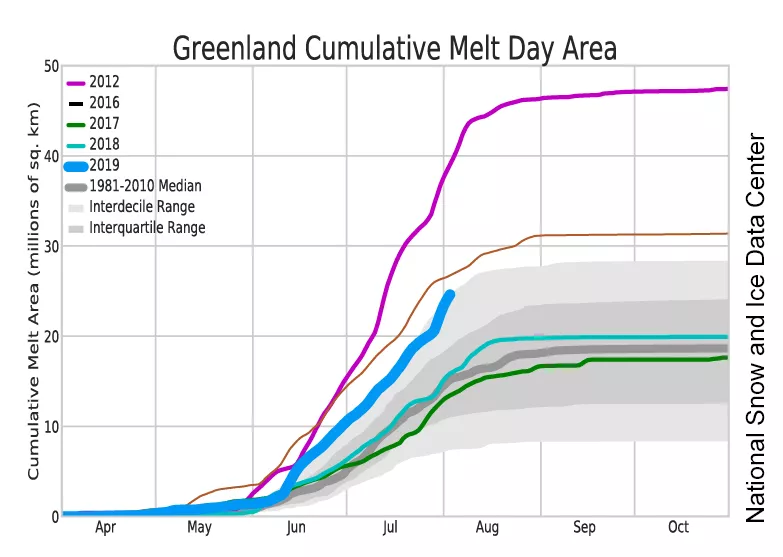
A rapid increase in surface melting on the Greenland ice sheet began on July 30 and continued through August 3, covering primarily the central and northern areas of the ice sheet on both the east and west ice sheet slopes. On July 30 and 31, melting reached the Summit Camp area of the ice sheet, corroborated by both air temperature from the National Oceanic and Atmospheric Administration (NOAA) weather station at Summit and the passive-microwave melt analysis. Peak melt area occurred on July 31, with just over 60 percent of the ice sheet surface experiencing melt (Figure 1a). Over the course of the five-day event approximately 90 percent of the surface of Greenland reached the melting point at least once. The daily sum of melt area in July was 397,560 square kilometers (154,500 square miles), well above the 1988 to 2017 average of 337,945 square kilometers (130,481 square miles). The 1988 to 2017 range is a 30-year record of daily melt mapping for Greenland in summer. Melt area mapping from 1979 to 1987, on the other hand, recorded every other day, using a earlier passive microwave satellite. Cumulatively, the 2019 season sum of melt area for every day is tracking well behind 2012, the satellite-era record for total melt-day area, and slightly behind 2016 (Figure 1b). However, total ice mass loss for 2019 is nearly equal to 2012 because of low winter snowfall. Early melting of the surface in 2019 quickly removed the snow accumulation from winter, and deeper melting this month has eroded older snow and ice over large areas of the western side of Greenland.
Conditions in context
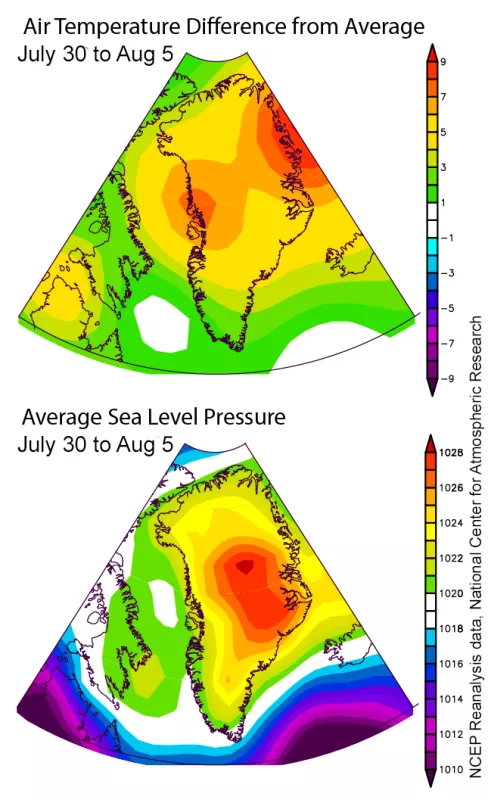
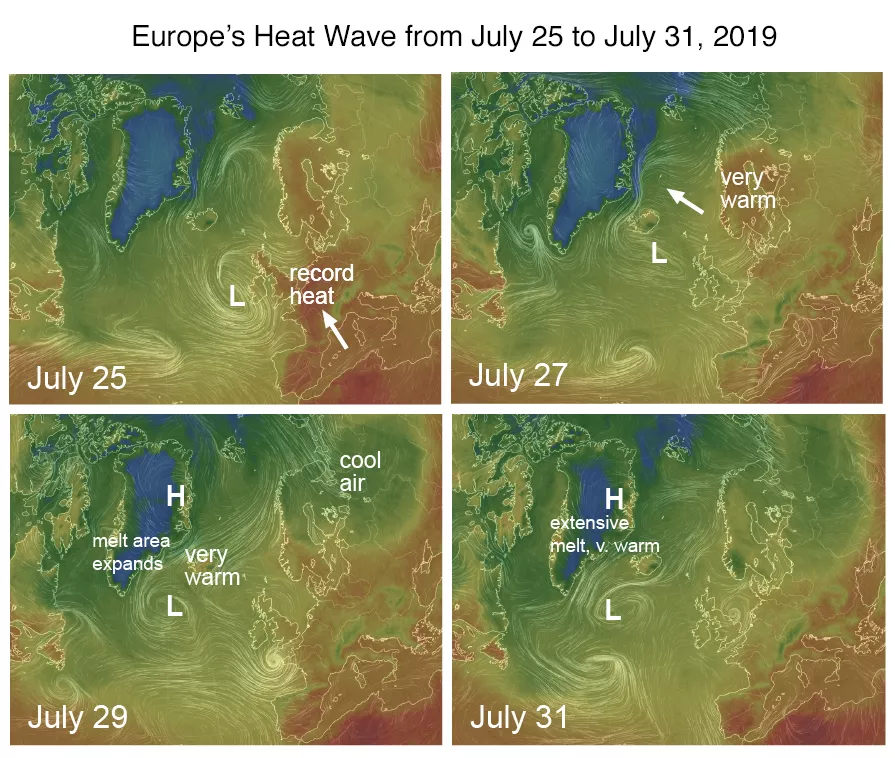
Surface air temperatures during the warm event over Greenland peaked to 12 degrees Celsius (22 degrees Fahrenheit) above the 1981 to 2010 reference period, and averaged 3 to 9 degrees Celsius (5 to 16 degrees Fahrenheit) above the reference period over nearly the entire ice sheet for the five-day period. High pressure was centered over the ice sheet during the event. Extreme warm air conditions were present over western Europe in late July, as desert air from the Sahara moved northward. Following the record high temperatures in France, the Netherlands, and Germany, counterclockwise airflow around a low pressure in the North Atlantic brought the warm air mass from Scandinavia to Iceland and then to Greenland. As warm air arrived at Summit Station, Greenland, a prolonged period of near-freezing to above-freezing temperatures occurred on July 30 and 31. In a place where the sun sits low on the horizon at night, these temperatures are unprecedented in the period of observations for this site, which began in 1987. Temperatures dropped further on the night of July 31, but came close to melting again on August 1. With air incoming from the east and some cloudiness in the south of Greenland, melting was amplified on the western side by heating from air compression in downslope winds, increasing the surface melting and runoff. The westward movement of the warm air mass is unusual. Most recent warm events, such as the widespread melting earlier this year, and in July and August of 2012, were a result of air masses coming from the southwest and up along the western Greenland coast.
Losing billions of tons of ice per day
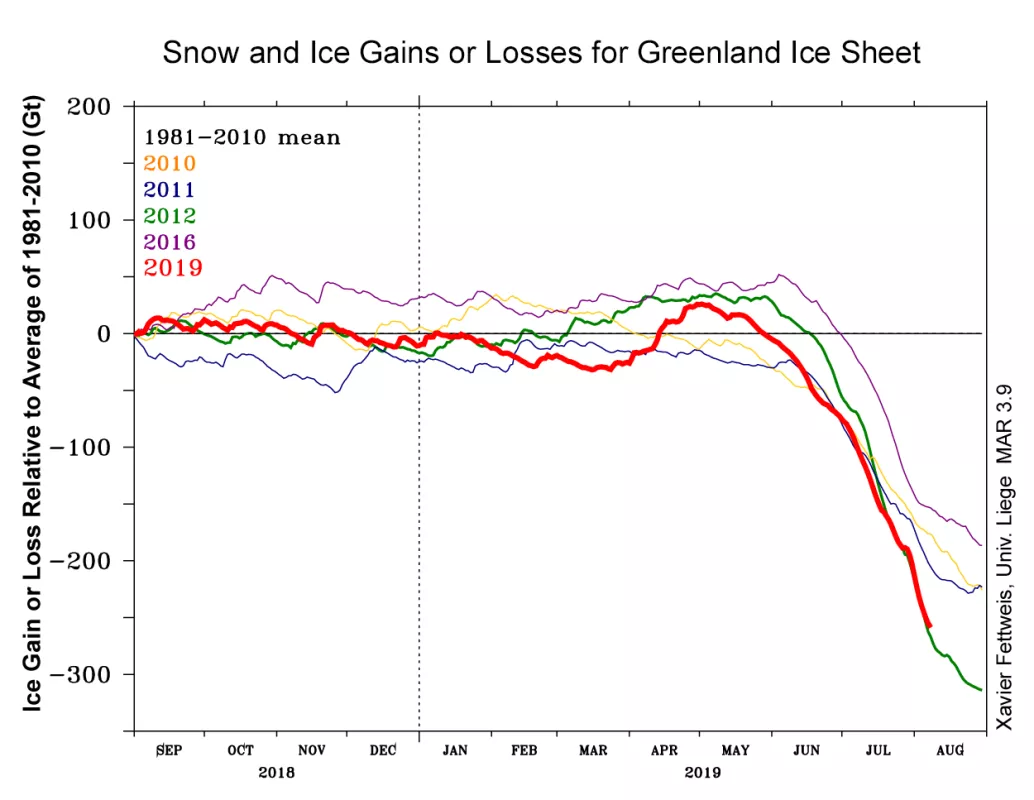
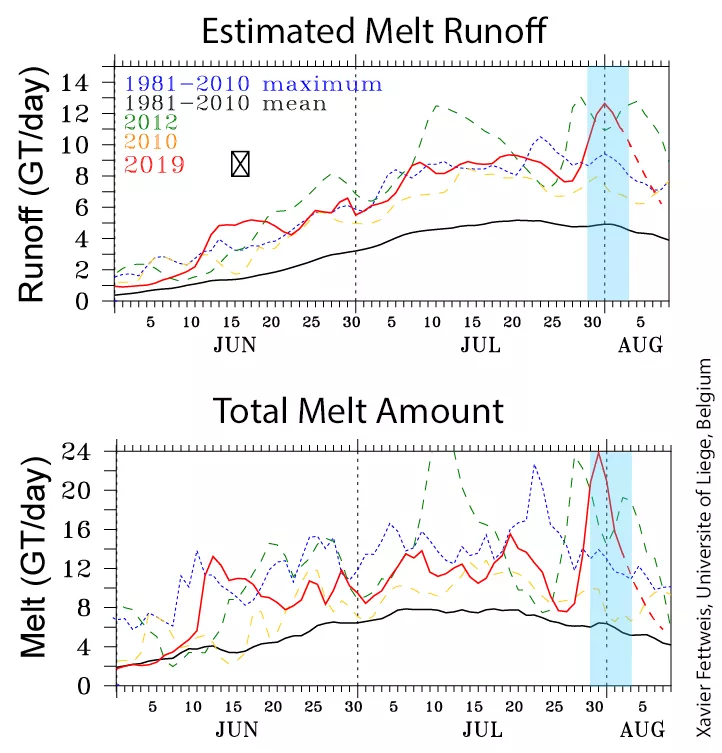
Our colleague, Xavier Fettweis at the Université of Liège, Belgium, developed a Greenland ice and climate model that provides estimates of mass gained or lost by snowfall and melt (not including ice lost from the outflow of glaciers) (Figure 3a). To date, 2019 is tracking the record high melt volume and ice loss of 2012 almost exactly, with about 40 days left in the melt season. At present, Greenland has lost a total of over 250 billion tons from melt runoff (and low total snowfall earlier in the season). Daily melt amounts were 12 to 24 billion tons through the five-day event, about 6 to 18 billion tons above the rates typical of the 1981 to 2010 reference period for these days. Total runoff for the five-day period was 10 to 12 billion tons per day, or 5 to 7 billion tons per day above average rates (Figure 3b). The ice sheet lost approximately 55 billion tons through melt runoff during the event.
At summit: The highest temperatures in the past 12 years
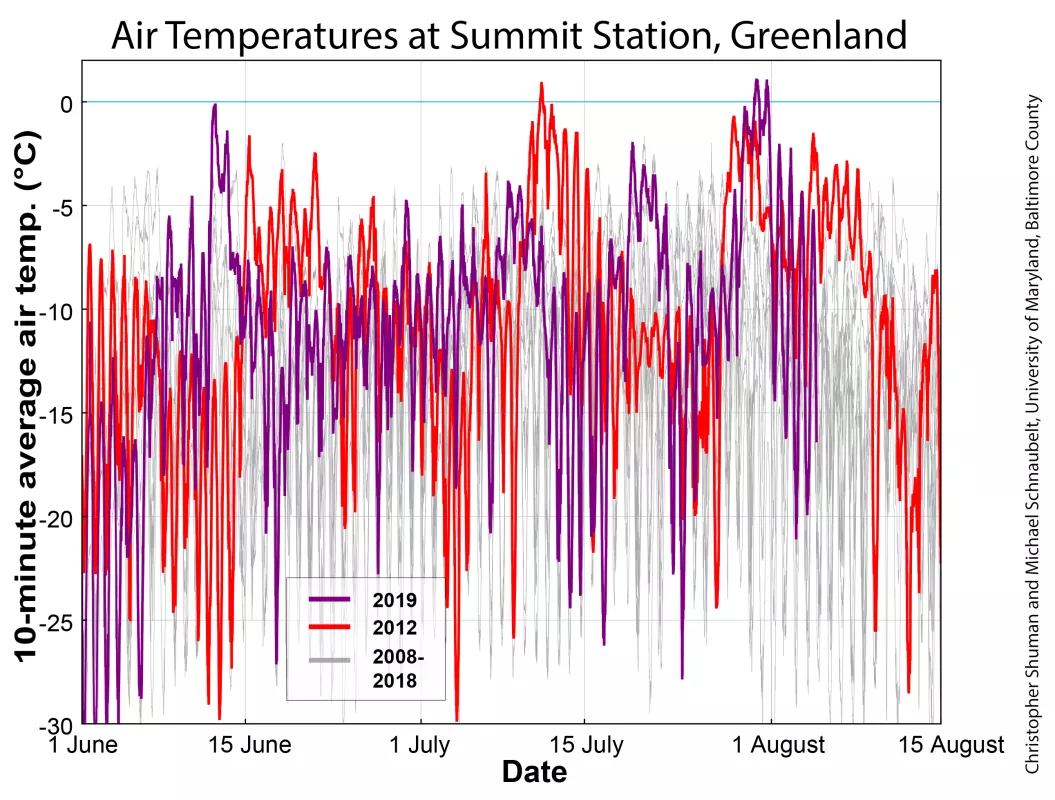
The NOAA 2-meter air temperature data from Summit Station on the July 30, 2019 was at or above freezing for more than 11 hours, a record in the last 12 years, which has seen a period of increased temperatures overall. Furthermore, this melting event on July 30 also sets the record for the preceding century. Prior to 2012, melt layers at summit have been absent since 1889, and only appear again 680 years earlier. Only two other melt events occurred here in the last 12 years, both shorter: On July 11, 2012 melting lasted for about 6.5 hours and on July 31, 2019 for more than five hours. The highest 1-hour average of above-freezing temperatures were set in 2012 at 0.79 degrees Celsius (33.4 degrees Fahrenheit) and in 2019 at 0.92 degrees Celsius (33.7 degrees Fahrenheit). Cooling on the evening of July 30 to 31 was minimal, to approximately -2.5 degrees Celsius (27.5 degrees Fahrenheit), and an unprecedented second day of above-freezing maximum temperatures occurred on July 31, 2019, when temperatures were above freezing for more than five hours and reached a maximum of 1.1 degrees Celsius (34.0 degrees Fahrenheit).
Deep blue ice and darker snow
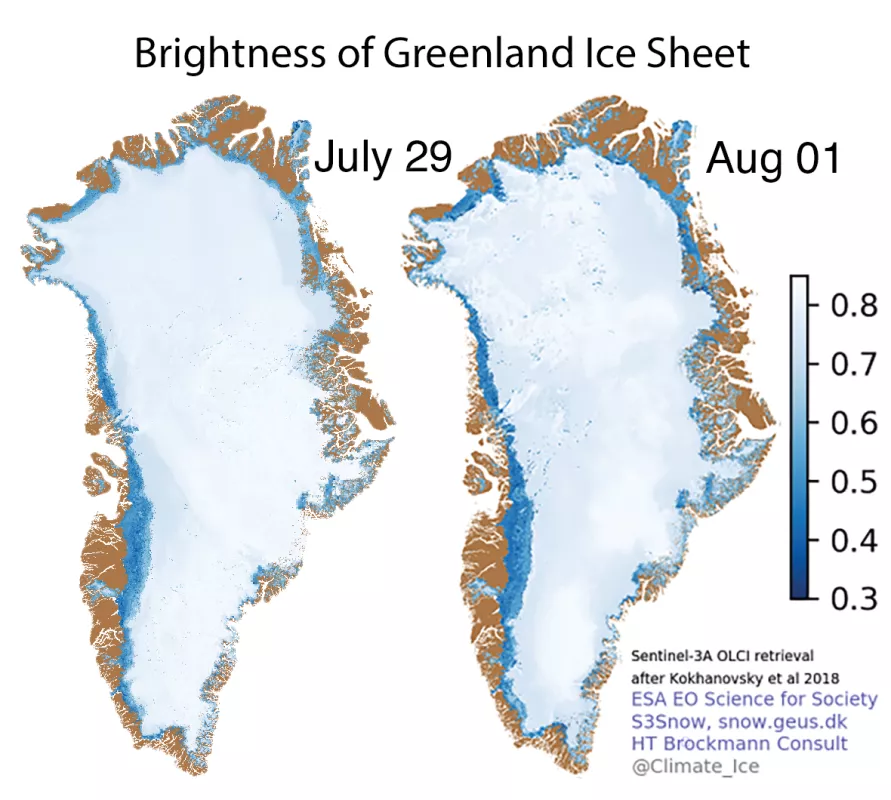
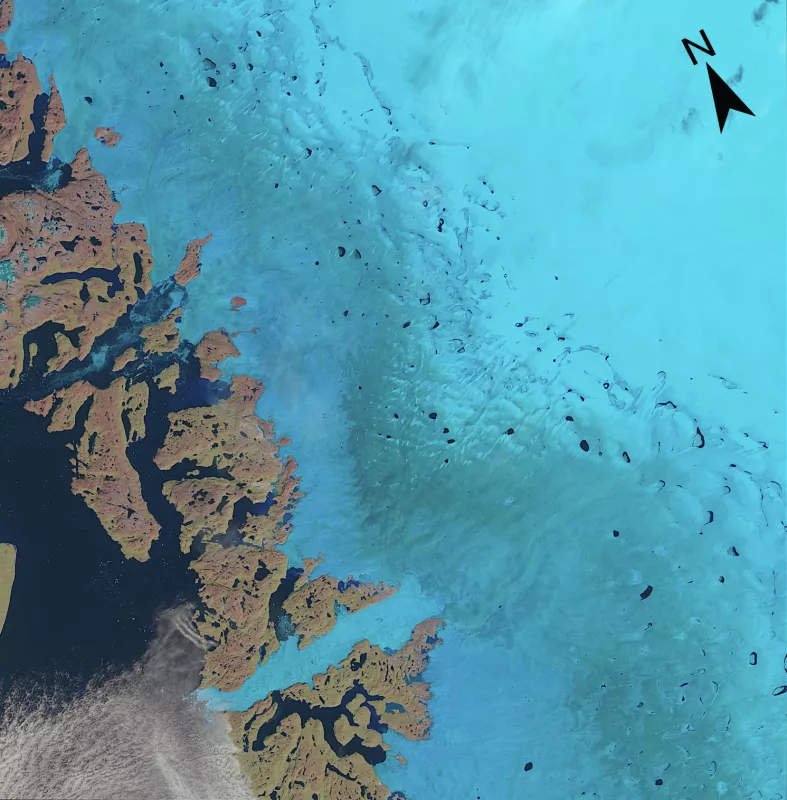
As the melt event progressed, a wider area of dark bare ice was exposed (Figure 5a). However, a brief snow event just prior to the major melt period left some areas slightly brighter and more reflective, reducing the total area that melted relative to the 2012 event (60 percent in 2019 versus 70 percent of the ice sheet in 2012). Jason Box of the Geological Survey of Denmark and Greenland (GEUS) provided the new albedo, or solar reflectance, mapping product. A Landsat image of the western flank of Greenland acquired on August 2 shows dark blue exposing older bare ice, with a darker band of dust-laden ice—formed during the last ice age—and wet snow and melt ponds at higher elevations along the right side of the image.
July run-off: whitewater
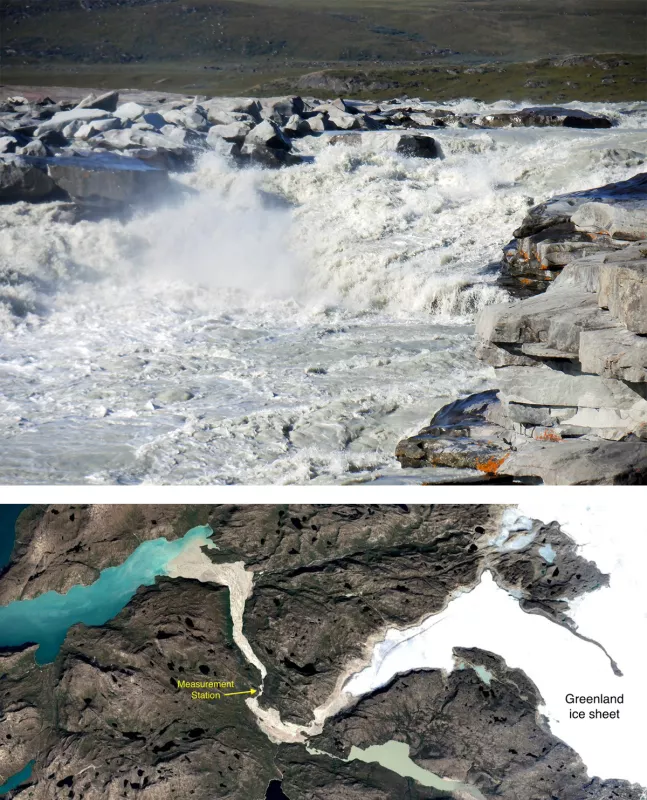
Water from the Greenland ice sheet contains rock flour, or very finely ground mineral dust, from bedrock erosion by the flowing ice. In the Naajatkuat River, a meltwater river in the Nuuk fjord region, a measurement station above the rapids monitors river levels (Figure 6). The image of runoff was taken during an earlier warm week, July 12 to 14, in southwest Greenland when daytime high temperatures at this low coastal elevation were 19 degrees Celsius (66 degrees Fahrenheit). Irina Overeem has been monitoring river levels at the flood station at this location since 2011. At the time the picture was taken, the river level was 5.3 meters (17 feet) below the sensor. At the highest level during the exceptional melt in 2012, the water reached to 2.5 meters (8.2 feet) below the sensor. As of this post, water levels for the peak of the July to August 2019 event had not been recovered from the station.
Further reading
Hanna, E., X. Fettweis, S. H. Mernild, J. Cappelen, M. H. Ribergaard, C. A. Shuman, K. Steffen, L. Wood, and T. L. Mote. 2013. Atmospheric and oceanic climate forcing of the exceptional Greenland ice sheet surface melt in summer 2012. International Journal of Climatology, 34, 4, 1022–1037. doi:10.1002/joc.3743.
Shuman, C. A., K. Steffen, J. E. Box, and C. R. Stearns. 2001. A dozen years of temperature observations at the summit: Central Greenland automatic weather stations 1987–99. American Meteorological Society, 741-752. doi:10.1175/1520-0450(2001)040<0741:ADYOTO>2.0.CO;2.
Trusel, L. D., Das, S. B., Osman, M. B., Evans, M. J., Smith, B. E., Fettweis, X., McConnell, J. R., Noël, B. P. and van den Broeke, M. R. 2018. Nonlinear rise in Greenland runoff in response to post-industrial Arctic warming. Nature, 564(7734), 104. doi:10.1038/s41586-018-0752-4.
Acknowledgements
Xavier Fettweis, Université of Liège in Belgium, for providing the MAR 3.9 model results.
Christopher A. Shuman (University of Maryland Baltimore County (UMBC) Joint Center for Earth Systems Technology at NASA Goddard Space Flight Center (GSFC)) and Mike Schnaublet (UMBC Physics) for producing the "Air Temperatures at Summit, Greenland" graph from data provided by NOAA’s Earth System Research Laboratory, Global Monitoring Division.
Jason Box, Geological Survey of Denmark and Greenland (GEUS) in Copenhagen, Denmark, for producing albedo measurements from a variety of sources for the Greenland ice sheet.
Irina Ovreem and Jasmine Hansen,The Institute of Arctic and Alpine Research (INSTAAR) and the Cooperative Institute for Research in Environmental Sciences (CIRES) at the University of Colorado Boulder (CU). The Research and Innovation Office (RIO), INSTAAR, and CU Boulder funded this field season.
