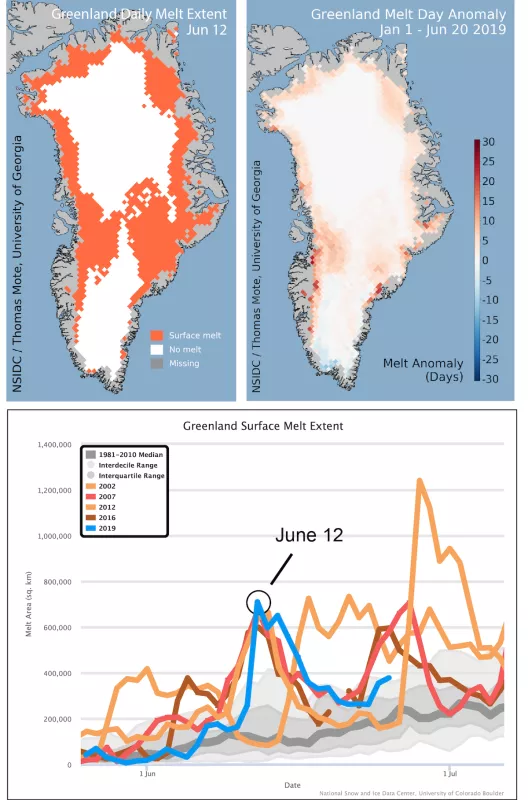
Between June 11 and 20, an extensive area of the Greenland Ice Sheet surface melted. At its peak on June 12, thawing climbed from the western and eastern coasts to elevations above 3,000 meters (9,800 feet). High air pressure and clockwise circulation around the island brought warm air from the south and sunny conditions. While several recent years have had similar early widespread melt events, the event of June 11 to 20 reached a peak of just over 700,000 square kilometers (270,000 square miles), setting a record for this early in the melt season. Models estimate the amount of melted ice at approximately 80 billion tons for that period.
Overview of conditions
Following a relatively dry winter and warm spring for Greenland, a major surface melt episode occurred between June 11 and 20. The maximum area of melt occurred on June 12, at 712,000 square kilometers (275,000 square miles). Melting was detected around the entire coast except the far southern tip of the ice sheet, and extended well inland in both the west central and east central regions, nearly to the summit. The eastern and northeastern coastal areas also melted extensively. Melting in Greenland through the end of spring has been significantly higher than the 1981 to 2010 average, with several areas exceeding 10 days of additional melt above the average, and a few regions with more than 20 days. Only the southernmost tip of the island and a region along the southwestern side of the ice sheet are below the average to date.
Conditions in context
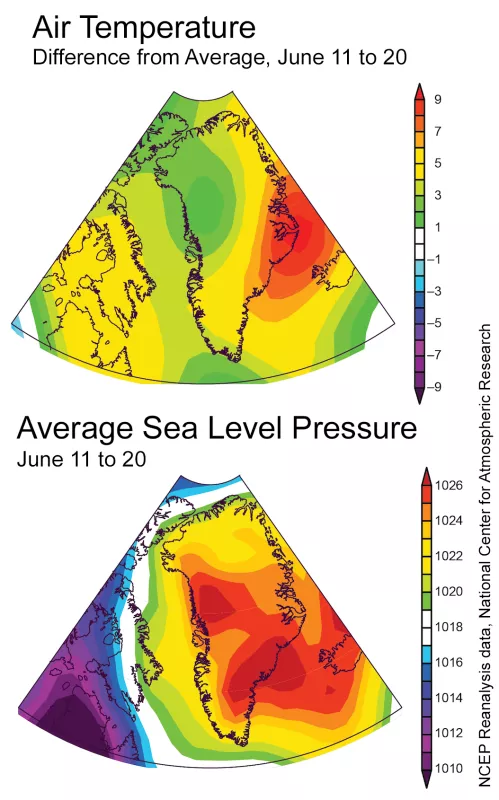
During the June 11 to 20 melt event, warm conditions extended over the entire island and particularly along the eastern coast with temperatures up to 9 degrees Celsius (16 degrees Fahrenheit) above the 1981 to 2010 average. High air pressure across the island drew warm air from northeastern Canada across the island. Along the eastern coast, warm winds from the west flowed downhill. Sunny conditions across nearly the entire island were seen on June 11, 12, and 13 (Figure 2b), increasing melt.
Rapid drop in albedo along the western flank
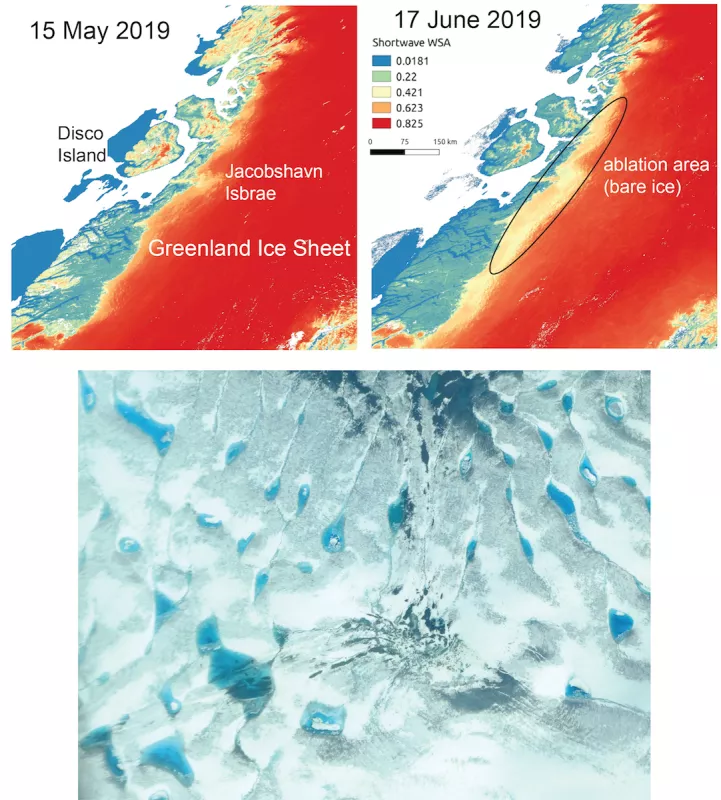
In our previous post, we noted that low snowfall over western Greenland and early spring warming led to an early beginning to the 2019 melt season. Loss of this thin snow cover has rapidly darkened the surface of the western coast by exposing the bare ice of the ablation area of the ice sheet earlier than usual (Figure 3). The ablation area is the area of a glacier where more glacier mass is lost than gained, and where old snow has eroded leaving bare ice. Fresh powdery snow reflects about 80 percent of solar energy, while bare clean ice reflects between 40 to 50 percent, depending on the dust content, which can darken its surface. This early exposure of bare ice increases the pace of meltwater production by allowing the darker ice surface to absorb more solar radiation. An image acquired by one of our readers from a commercial jet crossing southern Greenland shows the edge of the bare ice zone, with darkened snow and bare ice, along with some remaining snow from the previous winter.
A very warm spring
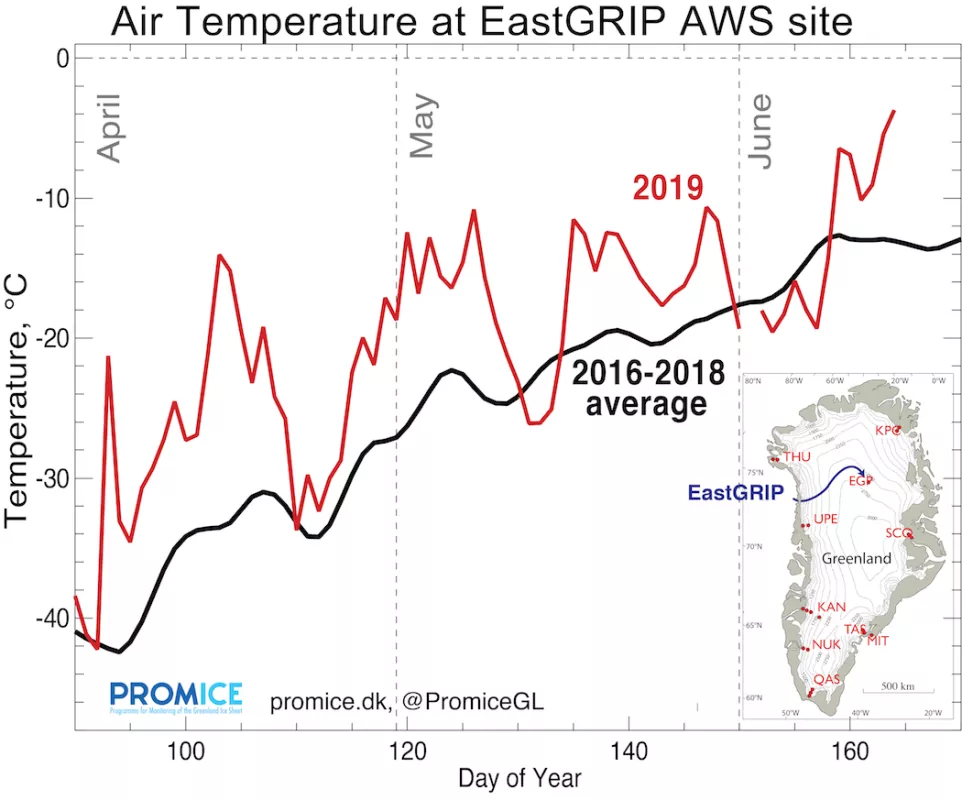
A warm spring has heated the Greenland snowpack, preconditioning it for early melting. Although early-season melting (prior to the June 12 event) was not record breaking, the upper snow layers are more likely to thaw as summer proceeds.
Estimated total melt and meltwater runoff from a climate model
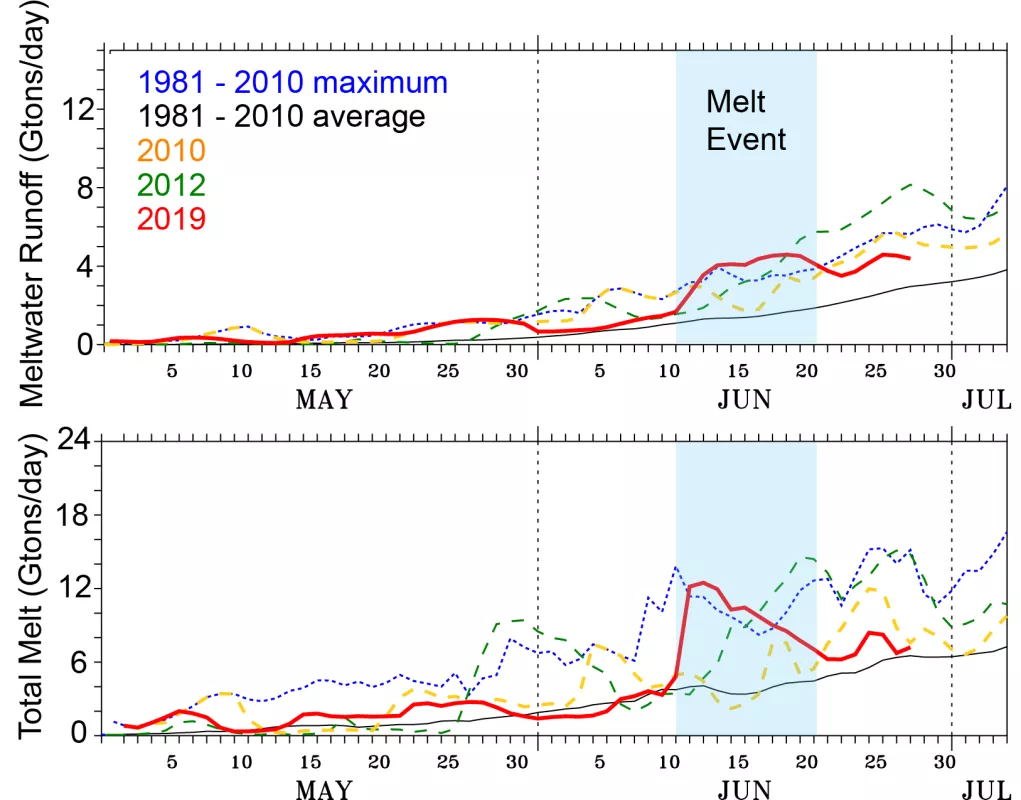
A model of Greenland climate, using inputs of weather data and forecasts as well as the physical properties of the ice sheet, has estimated the total amount of melt during the extensive melt event. The model also estimated the total amount of melt that flowed off the ice sheet and into the ocean (Figure 5). Both total melt and meltwater runoff set new records for several of the melt event dates. Total melt from June 11 to 20 was about 80 billion tons, of which approximately 30 billion tons ran off the ice into the ocean (or was stored temporarily in lakes).
Further reading
The 2017 Greenland Ice Sheet SMB simulated by MARv3.5.2 in real time
Polar Portal's Greenland surface conditions
Programme for Monitoring of the Greenland Ice Sheet (PROMICE)
