Greenland's surface ice melt season reached a peak in late July, coinciding with a period of very warm weather. Greenland's melt season this year will be closer to average than was 2012, with far less melting in the northern ice sheet and at high elevations. Nevertheless, an all-time record high temperature for Greenland may have been set in 2013.
Overview of conditions
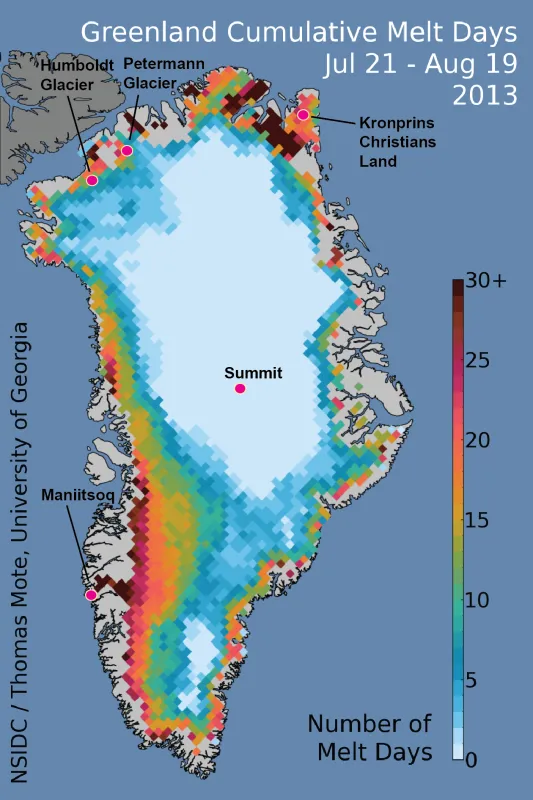
Surface melt on the Greenland ice sheet spread to the northern coastal regions and became especially frequent in the far northeastern corner of the island (Kronprins Christians Land). However, while some high-melt-extent years recently have seen elevations above 2,500 meters (8,200 feet) warm to the melting point, this rarely occurred in 2013, nor was there extensive melt in the northern interior portion of the ice sheet. A small region of the northwestern ice sheet, the drainage areas of Peterman and Humbolt glaciers, saw some inland melting. (However, some of these dark red pixels are mixed land areas, including ice plus rock and permanently frozen ground.) Melt lakes were prevalent along the central western coast in 2013 (as is typical of most seasons) but far less extensive in the northeastern and northwestern regions than in 2012. Melt lakes in Greenland may be seen in NASA Rapid Response-MODIS Arctic Subset images.
Conditions in context
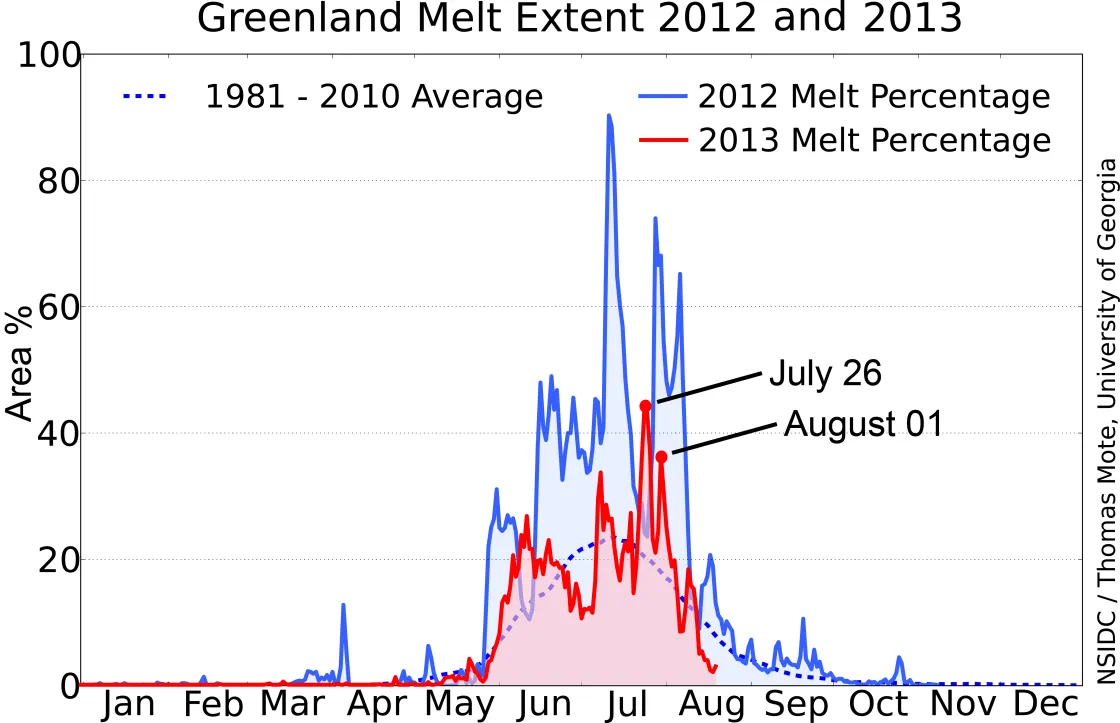
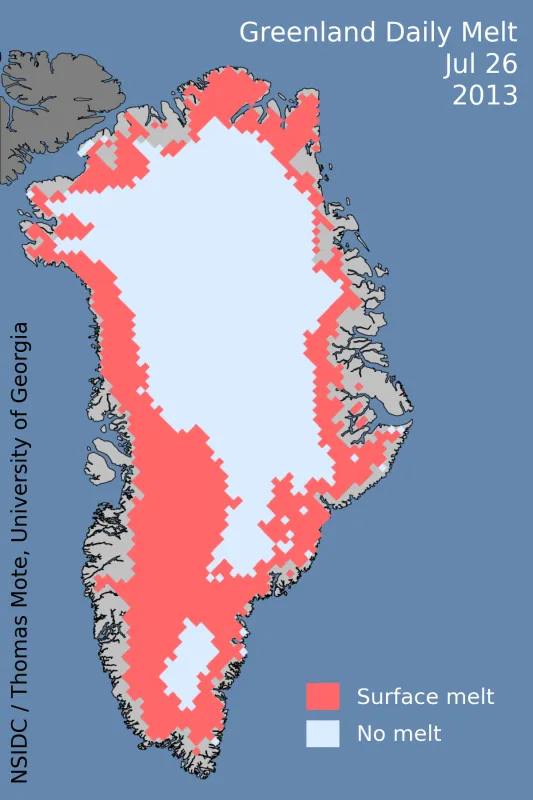
The period between July 21 and August 19 (Figure 1) included the greatest percentage of surface melt extent days for Greenland during 2013, peaking at 44% on July 26 (Figure 2b). However, the overall melt extent for 2012 was far greater, exceeding 40% for several weeks (Figure 2a). Data posted by Xavier Fettweis at the University of Liège using a different melt algorithm show that melt day frequency is slightly greater than average for northwestern Greenland near the coast (2 to 8 more melt days than average for the reference period, 1980-2011), and significantly greater than average for northeastern Greenland (8 to 16 days more). According to the MAR (Modèle Atmosphérique Régional) regional climate model, the main melt anomalies in 2013 have occurred along the northeast coast. These anomalies are also indicated in the satellite data, by red pixels in Figure 1. This has been due to the lower winter snowfall than average (resulting in a lower albedo) combined with warmer than average summer temperatures. However, the majority of the ice sheet showed mild to moderately lower-than-average melt duration for this season.
Warm temperatures for Greenland: Maniitsoq, July 30
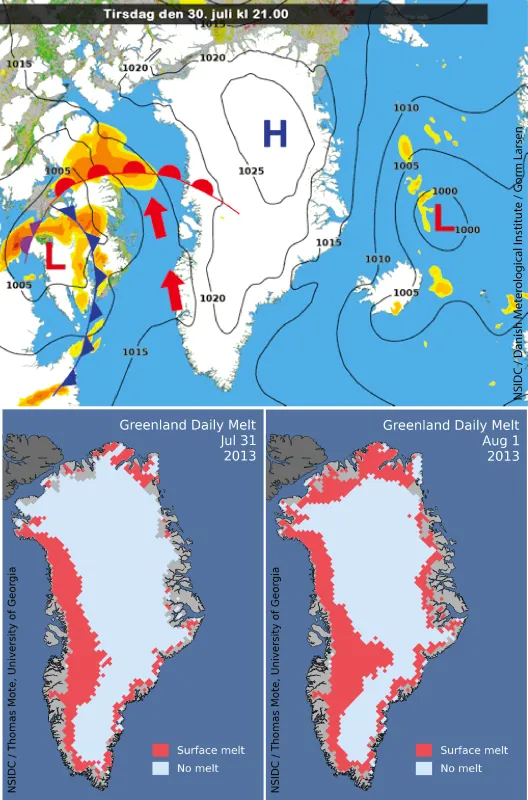
A pattern of strong southerly winds in late July brought very warm temperatures to southwestern Greenland, possibly the warmest air temperature ever recorded on Greenland since 1958 (when extensive accurate records began). Temperatures at the small hamlet of Maniitsoq were measured at 25.9 degrees Celsius (78.6 degrees Fahrenheit) on July 30. These conditions were in part due to the downhill flow of the air off the western side of the Greenland Ice Sheet. Downhill air flow warms the air as a result of its compression as it goes to lower altitude (foehn or chinook effect). This weather event also led to a large region of melt along the western part of the ice shelf on July 31 and August 1, and the second-highest area of melt this year.
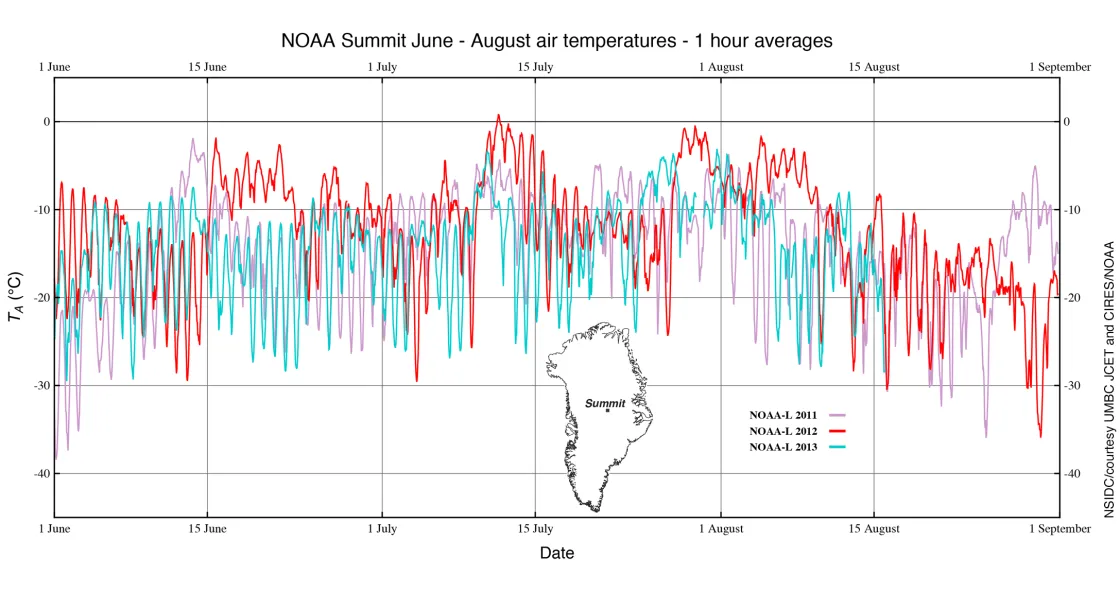
Three summers at Summit
Summit is a research station located at the highest point on the Greenland Ice Sheet, at 3,216 meters (10,551 feet) above sea level. Above-freezing air temperatures were observed there by NOAA sensors for the first time in 2012, although ice cores indicate rare melting events in past centuries. The years preceding and following 2012 show more typical temperature conditions. Figure 4 shows a plot of temperatures recorded at the NOAA observatory at Summit, Greenland. The daily oscillation is a result of a day-night cycle. Although the sun remains above the horizon for much of the summer at Summit, it drops very low in the sky during evening hours and temperatures drop. Research shows that surface melting detectable by remote sensing (see Figures 1 and 2) can begin a degree or two Celsius (2 to 4 degrees Fahrenheit) below freezing due to solar heat absorption by the snow. (Thanks to Chris Shuman, University of Maryland Baltimore County with the support of the NASA Cryospheric Sciences Program, for this part of the discussion.)
